Abstract
This is the first report that inhibition of negative regulators of skeletal muscle by a soluble form of activin type IIB receptor (ACE-031) increases muscle mass independent of fiber-type expression. This finding is distinct from the effects of selective pharmacological inhibition of myostatin (GDF-8), which predominantly targets type II fibers. In our study 8-wk-old C57BL/6 mice were treated with ACE-031 or vehicle control for 28 days. By the end of treatment, mean body weight of the ACE-031 group was 16% greater than that of the control group, and wet weights of soleus, plantaris, gastrocnemius, and extensor digitorum longus muscles increased by 33, 44, 46 and 26%, respectively (P < 0.05). Soleus fiber-type distribution was unchanged with ACE-031 administration, and mean fiber cross-sectional area increased by 22 and 28% (P < 0.05) in type I and II fibers, respectively. In the plantaris, a predominantly type II fiber muscle, mean fiber cross-sectional area increased by 57% with ACE-031 treatment. Analysis of myosin heavy chain (MHC) isoform transcripts by real-time PCR indicated no change in transcript levels in the soleus, but a decline in MHC I and IIa in the plantaris. In contrast, electrophoretic separation of total soleus and plantaris protein indicated that there was no change in the proportion of MHC isoforms in either muscle. Thus these data provide optimism that ACE-031 may be a viable therapeutic in the treatment of musculoskeletal diseases. Future studies should be undertaken to confirm that the observed effects are not age dependent or due to the relatively short study duration.
Keywords: myostatin, GDF-8, myosin heavy chain, muscular dystrophy
genetic disorders targeting skeletal muscle are associated with muscle loss, weakness, disability, and mortality (14, 22). While advances in gene therapies may ultimately allow these inherited diseases to be treated directly, therapeutics that effectively promote skeletal muscle growth may help to improve quality of life and reduce mortality of those who are afflicted with these disorders. In this light, the modulation of myostatin (GDF-8) function in adult skeletal muscle is an important stratagem in the treatment of muscle wasting in chronic disease. Naturally occurring mutations in the myostatin gene, resulting in deficiencies in the mature myostatin protein, are associated with a hypermuscular phenotype in species ranging from sheep to humans (10, 29, 32, 38). Targeted disruption of the myostatin gene in mice is associated with a 200–300% increase in muscle size that is characterized as both hypertrophic and hyperplastic (28). When investigated in mouse models of muscle degeneration, such as muscular dystrophy (43) or acute muscle injury (40, 42), myostatin deficiency has been shown to stimulate growth of both dystrophic and injured muscles and is associated with greater muscle mass, improved morphology, and reduced fibrosis.
The discovery of biological inhibitors of myostatin, such as follistatin (4), follistatin-related gene (19), GDF-associated serum protein-1 (15), and the myostatin propeptide (19), has offered a multifaceted approach to the treatment of muscular degenerative diseases through the neutralization of myostatin. Exploiting these naturally occurring inhibitors or their derivatives by means of overexpression (33, 35) or gene delivery (15) has produced substantial improvements in muscle mass and function in both normal and dystrophic muscle that is not unlike that seen in myostatin null mice. Similarly, the myostatin neutralizing antibody JA16 administered to mdx mice, a mouse model of Duchenne muscular dystrophy, markedly increased muscle mass and absolute force production of dystrophic muscles, thus improving functional capacity so that dystrophic mice treated with JA16 performed similarly to wild-type controls in an endurance test (8).
It has been proposed that the regulation of skeletal muscle is not the sole responsibility of myostatin, but is shared by other members of the transforming growth factor-β superfamily. For instance, ectopic expression of activin A inhibits myoblast differentiation and the expression of creatine phosphokinase, a surrogate marker of myotube maturation (27). Similarly, bone morphogenetic protein-2 and -7 are correlated with a decline in protein synthesis in developing skeletal muscle (39). Although the role of these factors has not been characterized in adult skeletal muscle, there is evidence that at least one other transforming growth factor-β family member functions as a negative regulator of skeletal muscle mass postnatally. Administration of a soluble form of the activin type IIB receptor (ActRIIB) has been shown to increase muscle mass to a greater extent than that of a myostatin-specific neutralizing antibody (26). Furthermore, administration of soluble ActRIIB to hypermuscular myostatin-deficient mice produces further increases in skeletal muscle mass (26). Therefore, the use of an agent that targets multiple negative regulators of skeletal muscle may prove more effective in stimulating muscle growth in those afflicted by diseases associated with muscle loss and degeneration.
The contractile (slow vs. fast) and metabolic (oxidative vs. glycolytic) properties of any given muscle are largely the consequence of the combined expression of various myosin heavy chain (MHC) isoforms. The MHC isoforms predominantly expressed in adult rodent skeletal muscle, in the order of their slow/oxidative to fast/glycolytic phenotype, are I, IIa, IIx, and IIb. While myostatin deficiency in mice does not alter the amount of MHC expressed per milligram of total protein (45), it is associated with an increase in MHC IIb expression at the expense of MHC I (13, 18), resulting in muscles that are more susceptible to fatigue (18). Similarly, cattle deficient in myostatin are characterized by decreased endurance capacity and a higher glycolytic profile at the whole body level (20), presenting with significantly greater blood lactate levels during forced exercise. Slow-twitch oxidative fibers are important in insulin-mediated glucose uptake in skeletal muscle (7), and low type I fiber expression is associated with type 2 diabetes (34) and has been identified as a predictor of obesity and cardiovascular disease (21). Thus a shift in a MHC profile that is associated with a faster more glycolytic phenotype may be an undesirable consequence of myostatin-specific inhibition, regardless of its muscle-building potential.
The shift in MHC isoform expression associated with myostatin deficiency is largely a developmental phenomenon, as this phenotype is not recapitulated in adult mice administered a myostatin-neutralizing antibody (13). However, to date, it is not known whether inhibiting multiple regulators of skeletal muscle will result in a change in the inherent MHC profile. Therefore, the purpose of the present study was to investigate the effects of ACE-031, a soluble form of the extracellular region of ActRIIB fused to the Fc portion of human IgG, on skeletal muscle mass, fiber-type distribution, and MHC isoform expression in mice.
MATERIALS AND METHODS
Expression and purification of ACE-031.
The ActRIIB extracellular domain was produced by PCR amplification of the human ActRIIB gene. The primers used for the 5′ and 3′ end included a SfoI and AgeI restriction site, respectively. The PCR product was purified, digested with SfoI and AgeI, and ligated to the pAID4 hFc vector (containing the tissue plasminogen activator signal sequence) to create the pAID4 ActRIIB.hFc expression construct. The sequences of ActRIIB extracellular domain and human immunoglobulin Fc region were confirmed by double-strand dideoxy sequencing. ActRIIB.hFc plasmid was transfected into Chinese hamster ovary cells, and a stable clone expressing ActRIIB.hFc was isolated. ActRIIB.hFc was purified from serum-free media using affinity chromatography with Mab Select Sure Protein A (GE Healthcare, Piscataway, NJ) and additional purifications steps, as needed. Purified ActRIIB.hFc was dialyzed into Tris-buffered saline (TBS; 10 mM Tris, 137 mM NaCl, and 2.7 mM KCl, pH 7.2).
Animals.
Experimental procedures were performed according to protocols approved by the Acceleron Pharma Institutional Animal Care and Use Committee. Eight-week-old male C57BL/6 mice were obtained from Taconic (Germantown, NY) and allowed to acclimate to the animal facility for 7 days. At the end of the acclimation period, mice were randomized to receive ACE-031 at 10 mg/kg of body wt (n = 5) or an equal volume of TBS vehicle control (n = 5). Mice were weighed and dosed twice weekly for 4 wk (day 28 body weights were not collected). At the end of the treatment period, mice were euthanized by CO2 asphyxiation and soleus, plantaris, gastrocnemius, and extensor digitorum longus (EDL) muscles were removed, wet weighed, and placed in RNAlater tissue storage reagent (Ambion, Austin, TX) or fixed in 10% formalin.
Histological analysis.
Formalin-fixed tissues were bisected and paraffin-embedded, and 10-μm cross sections were taken at the midbelly region. Sections were deparaffinized and rehydrated, and antigen retrieval was achieved by heating sections in sodium citrate buffer (10 mM sodium citrate, 0.05% Tween 20, pH 6.0) at 95°C for 20 min. Endogenous peroxidase activity was blocked with 3% hydrogen peroxide for 10 min. For cross-sectional analyses, sections were incubated in wheat germ agglutinin conjugated to Alexa Fluor 488 labeling reagent (Invitrogen, Carlsbad, CA), diluted 1:200 in PBS for 60 min at room temperature. Adjacent sections were incubated in anti-fast (type II) MHC conjugated to alkaline phosphatase (Sigma, St. Louis, MO) diluted 1:50 in PBS for 60 min at room temperature. Stained sections were visualized with an Eclipse 80i fluorescent microscope, and images were captured with a Digital Sight DS-5Mc digital camera (Nikon, Melville, NY). Images were analyzed with NIS Elements imaging software (Nikon). All fibers per section were counted to determine fiber-type distribution, and 100 fibers per section were measured for fiber cross-sectional area.
Taqman real-time PCR.
Muscle tissues were removed from RNAlater and disrupted by homogenization (Tissue Tearor, BioSpec Products, Bartlesville, OK) in TRI Reagent (Ambion). Total RNA was extracted with Ribopure kit (Ambion), according to the manufacturer's instructions. Briefly, homogenized samples were mixed with bromo-chloropropane and separated into organic/phenol and aqueous phases via centrifugation at 4°C. The organic/phenol phase was saved for protein isolation, and the aqueous phase was mixed with 100% ethanol and transferred to glass-fiber filter mini-columns to be washed and RNA eluted by centrifugation. Nucleotide concentration was determined with a NanoDrop 1000 spectrophotometer (Thermo Scientific, Wilmington, DE). Total RNA (100 ng) was converted to cDNA by the Moloney murine leukemia virus reverse transcriptase in the presence of random hexamers, dNTP mixture, and RNase inhibitor (Taqman Reverse Transcription Reagents, Applied Biosystems, Foster City, CA). First-strand cDNAs were amplified, and cDNA levels were quantified by real-time PCR using custom and predesigned forward and reverse primers and a fluorogenic Taqman probe (Applied Biosystems). Custom probe/primer sets for MHC I, IIa, and IIb were designed using Primer Express version 1.5 (Applied Biosystems) and synthesized by Applied Biosystems. Custom primer and probe sequences were as follows: 5′-CCA AGA GCC GGG ACA TTG-3′ (forward), 5′-TTG GAG CTG GGT AGC ACA AGA-3′ (reverse), and 5′-TGC CAA GGG CCT GAA-3′ (probe) for MHC I; 5′-GTC TGC GCA AAC ACG AGA GA-3′ (forward), 5′-CCA AAT CCT GAA GCC TGA GAA TAT-3′ (reverse), and 5′-ACT TAC CAG ACA GAA GAA-3′ (probe) for MHC IIa; and 5′-AAC AGA AGC GCA ACA TCG AA-3′ (forward), 5′-TTT AGT CTG TAG TTT GTC CAC CAA GTC-3′ (reverse), and 5′-ACC TAC CAG ACC GAG GAG-3′ (probe) for MHC IIb. The Taqman predesigned probe/primer set for MHC IIx (MYH1; Mm01332489_m1), was purchased from Applied Biosystems. All probes were labeled with FAM at the 5′-end, carried the MGB quencher at the 3′-end, and were complementary to an exon/exon junction so as to avoid the amplification of residual genomic DNA. cDNA levels were normalized to 18S levels in multiplex reactions. Amplifications were performed in a 7300 Real-Time PCR System (Applied Biosystems).
MHC isoform separation.
Protein was isolated according to the TRI Reagent method. Briefly, the organic/phenol phase separated from the RNA isolation procedure was mixed with 100% ethanol and centrifuged to pellet and remove DNA. Three volumes of acetone were then added to precipitate protein. The protein precipitate was pelleted by centrifugation and was washed three times in protein wash 1 (300 mM guanidine hydrochloride in 95% ethanol and 2.5% glycerol) and once in protein wash 2 (95% ethanol and 2.5% glycerol). Protein was solubilized in 1% SDS and 2.5% trybutyl-phosphine. MHC isoforms were separated according to the method described by Fauteck and Kandarian (12). Briefly, the stacking and separating gels consisted of 30% glycerol and 3.5% and 7% acrylamide, respectively. Electrophoresis was performed using a constant voltage of 70 V for 24 h at 4°C. Gels were stained with Coomassie blue and visualized with the Chemi Genius Bio Imaging System (Syngene, Cambridge, UK) and GeneSnap 7.04 software (Syngene). Densitometric analysis was performed with GeneTools 3.07 software (Syngene). MHC IIa and IIx isoforms migrated closely together, appearing as a single band, and were, therefore, not possible to quantify separately.
Statistical analysis.
Data are reported as means ± SE. Nonnormally distributed variables were log-transformed so that data were normally distributed before statistical analysis. Body weight was evaluated by a two-way ANOVA to measure main effects of the time and ACE-031 treatment variables, as well as their interaction. Analysis of body weight included only the first 25 days of the experimental period as terminal body weights were not collected. Muscle weights and MHC protein and transcript levels were analyzed by a nonpaired Student's t-test. Muscle-specific differences were analyzed by ANOVA followed by a Bonferroni adjustment for multiple comparisons. Differences were considered statistically significant when the two-tailed P -value was ≤0.05. Analysis of variance measurements were performed with SAS 9.1 for Windows (SAS Institute, Cary, NC).
RESULTS
ACE-031 increases body and muscle weight.
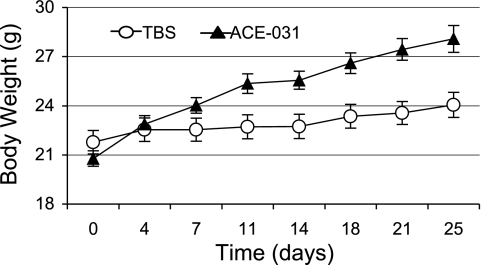
We used body weight measurements throughout the experimental period as a longitudinal corroborative marker of skeletal muscle mass. Both ACE-031- and vehicle-treated mice presented with a substantial increase in body weight by day 25 of the experiment (terminal body weights were not collected). However, as shown in Fig. 1, mice treated with ACE-031 exhibited a sharper rate of growth throughout and gained ∼16% more body weight than vehicle-treated controls. We found significant main effects for ACE-031 treatment and time (P < 0.05 and P < 0.01, respectively). We also detected a significant treatment × time interaction, indicating the rate of growth, or slope of the line, was significantly greater in the ACE-031-treated group (P < 0.01).
Fig. 1.
ACE-031-treated mice exhibit a sharper rate of body weight gain. The rate of growth in the ACE-031-treated mice (10 mg/kg twice weekly for 4 wk) exceeded that of the vehicle-treated controls, such that ACE-031-treated mice gained 16% more body weight by day 25 of the experimental period. Values are presented as means ± SE. Body weight was evaluated by a two-way ANOVA; there was a significant main effect for ACE-031 treatment (P < 0.05), time (P < 0.01), and treatment × time interaction (P < 0.01). TBS, Tris-buffered saline.
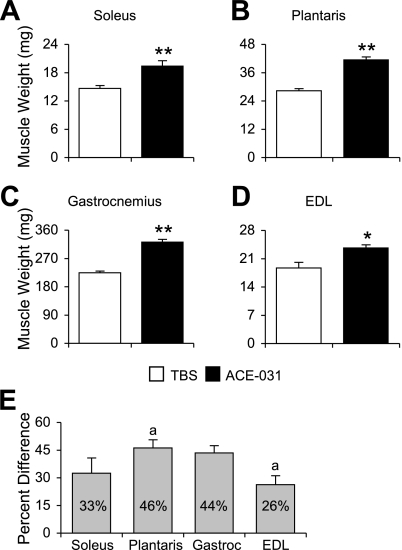
At the end of the study, lower hindlimb skeletal muscles were harvested on the basis of their function and fiber-type distribution. We selected the soleus, plantaris, and gastrocnemius, which function in plantar flexion, and their antagonist, the EDL, a dorsiflexor. The soleus is relatively rich in type I fibers; however, this varies largely between strains. For instance, the proportion of type I fibers in the mouse soleus ranges from 35% in C57BL/6 mice to 75% in CBA mice. On the other hand, gastrocnemius (17), plantaris (16), and EDL (3) are composed almost exclusively of type II fibers. At the end of the experimental period, wet weights of the soleus, plantaris, gastrocnemius, and EDL were 33, 46, 44, and 26% greater in the ACE-031-treated mice (P < 0.01; Fig. 2), respectively. A comparable gain in weights among plantar flexors indicates that ACE-031 does not discriminate between muscles on the basis of fiber-type distribution. On the other hand, the degree of weight gain in the EDL was significantly less than that of the plantaris (P < 0.05; Fig. 2E), suggesting an effect that may be influenced by the degree of muscle use.
Fig. 2.
ACE-031 promotes muscle growth in both type I- and type II-rich muscles. Wet weights of soleus (A), plantaris (B), gastrocnemius (Gastroc; C), and extensor digitorum longus (EDL; D) muscles were greater in ACE-031-treated mice than those treated with vehicle control. E: all muscles exhibited a comparable increase in muscle weight; however, the percent difference in plantaris weight was significantly greater than that of the EDL. Muscle weights are presented as means ± SE (A–C) and percent differences ± SE for percent differences (E). *P < 0.05; **P < 0.01. a Bars annotated with the same letter contain values that are significantly different from each other, P < 0.05.
ACE-031-induced muscle gain is the result of both type I and type II fiber hypertrophy.
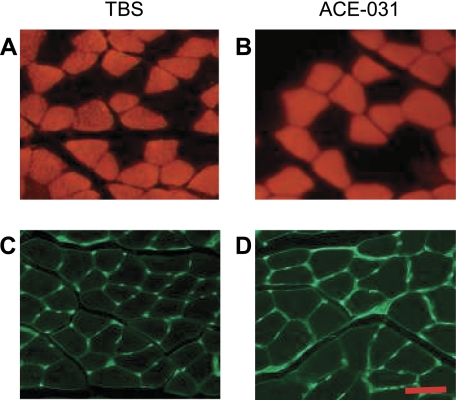
Next we performed a morphometric analysis of the type-I-rich soleus and type-II-rich plantaris to determine whether ACE-031-induced muscle growth was fiber-type specific. Soleus muscle fibers were stained for fast MHC expression and with wheat germ agglutinin to examine fiber-type distribution and cross-sectional areas (Fig. 3).
Fig. 3.
Representative cross section of soleus. Cross sections of soleus muscles from mice treated with TBS (A and C) or ACE-031 (B and D) and stained for fast myosin heavy chain (MHC; A and B) or outlined with wheat germ agglutinin (C and D) are shown. Scale bar: 50 μm.
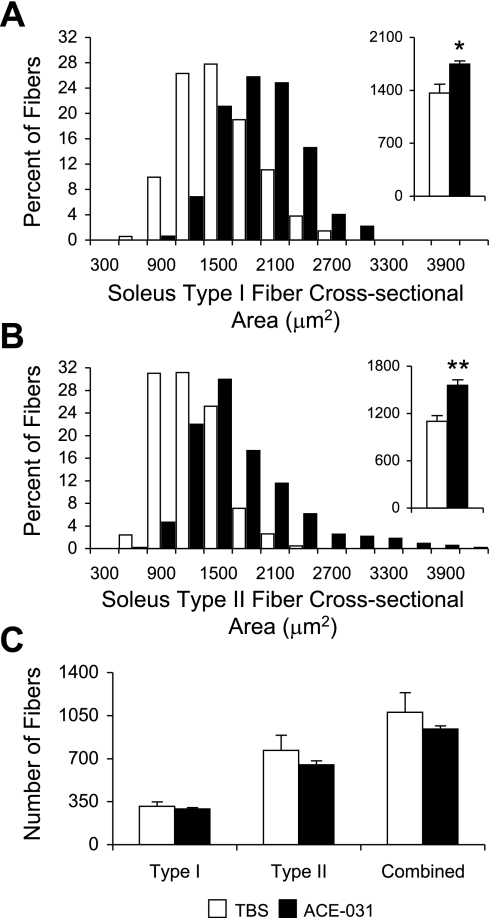
At the end of the experimental period, morphometric analysis of the soleus revealed no change in the total number of fibers in response to ACE-031 administration (Fig. 4C and Table 1). Upon staining for fast MHC expression, we did not detect a change in the distribution of type I or II fibers with ACE-031 administration, and both fiber types exhibited a rightward shift in their respective cross-sectional area frequency distribution plots (Fig. 4, A and B). Mean cross-sectional area of type I and II fibers of the soleus increased by 22 and 29% in the ACE-031-treated group, respectively (P < 0.05; Fig. 4, A and B, insets, and Table 1). A similar increase in soleus type I and II fiber mean cross-sectional areas suggests that the action of ACE-031 is not preferential to either fiber type.
Fig. 4.
Treatment with ACE-031 promotes hypertrophy but not hyperplasia in soleus type I and type II fibers. Soleus type I (A) and type II (B) fiber cross-sectional area frequency distribution shifts to the right with ACE-031 treatment and is associated with an increase in type I (A, inset) and type II (B, inset) mean cross-sectional area. C: there was no change in the total number of type I or type II fibers with ACE-031 administration. Values in A and B insets and C are presented as means ± SE. *P < 0.05; **P < 0.01.
Table 1.
Soleus and plantaris fiber cross-sectional area and total fiber number
| Soleus |
|||
|---|---|---|---|
| Type I | Type II | Plantaris Type I and II Combined | |
| Fiber cross-sectional area, μm2 | |||
| TBS | 1,365.61 ± 116.83 | 1,101.39 ± 71.78 | 1,030.50 ± 59.87 |
| ACE-031 | 1,747.49 ± 43.05* | 1,557.52 ± 70.36† | 1,619.77 ± 114.42† |
| Total fiber number | |||
| TBS | 311.80 ± 35.84 | 766.20 ± 123.98 | 938.80 ± 58.40 |
| ACE-031 | 290.60 ± 10.68 | 650.40 ± 25.48 | 883.20 ± 82.30 |
Values are means ± SE. TBS, Tris-buffered saline.
P < 0.05,
P < 0.001: TBS vs. ACE-031.
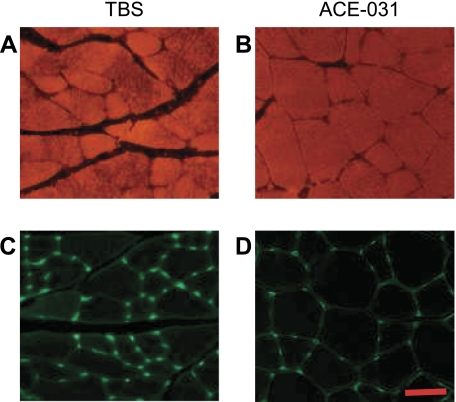
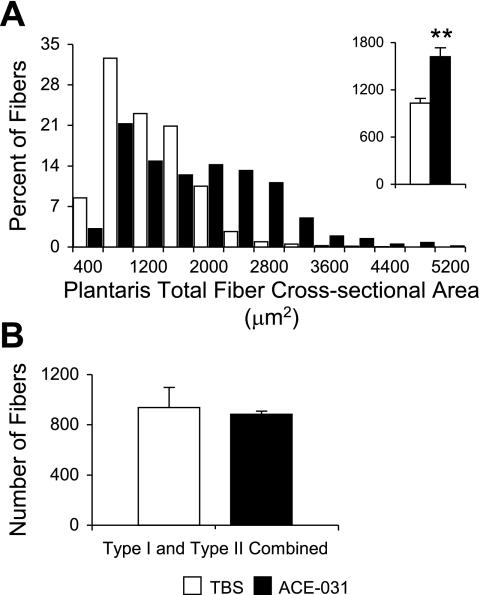
In both the TBS- and ACE-031-treated groups, the plantaris consisted almost exclusively of type II fibers (Fig. 5). Due to the paucity of type I fibers, results for type I and II fibers of the plantaris were combined. There was no difference in total fiber number between ACE-031- and TBS-treated mice (Fig. 6 and Table 1). On the other hand, ACE-031 administration was associated with a rightward shift in the plantaris fiber cross-sectional area frequency distribution plot, so that mean fiber cross-sectional area was 57% greater than that of the TBS-treated group (P < 0.01; Fig. 6A and Table 1).
Fig. 5.
Representative cross section of plantaris. Cross sections of plantaris muscles from mice treated with TBS (A and C) or ACE-031 (B and D) and stained for fast MHC (A and B) or outlined with wheat germ agglutinin (C and D) are shown. Scale bar: 50 μm.
Fig. 6.
Treatment with ACE-031 promotes hypertrophy but not hyperplasia in plantaris fibers. A: plantaris fiber cross-sectional area frequency distribution shifts to the right with ACE-031 treatment and is associated with an increase in mean cross-sectional area (inset). B: there was no change in the total number of fibers with ACE-031 administration. Values in A inset and B are presented as means ± SE. **P < 0.01.
ACE-031 does not alter the proportion of MHC isoform proteins.
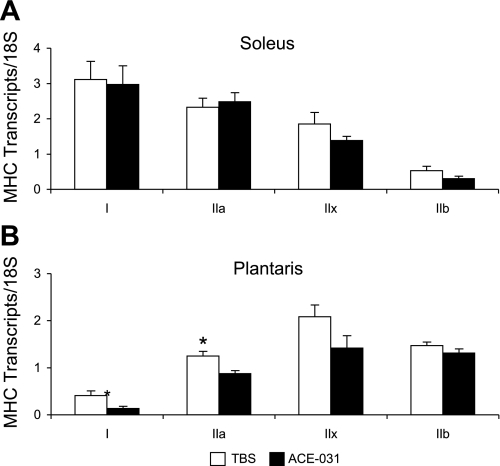
We utilized real-time PCR to determine whether the expression of MHC isoforms differed at the level of transcription in response to 28 days of ACE-031 administration. As shown in Fig. 7A, soleus muscles presented with a similar pattern of MHC isoform transcript expression in ACE-031- and TBS-treated mice. MHC I transcripts were most abundant followed by IIa, IIx, and IIb. In contrast, MHC IIx and IIb transcripts were greatest in the plantaris of both ACE-031- and TBS-treated mice, followed by IIa and I. The plantaris exhibited a significant decline in MHC I and IIa transcript levels (P < 0.05) with ACE-031 administration, but no change was observed in the expression of IIx and IIb transcripts (P > 0.05; Fig. 7B).
Fig. 7.
MHC transcript levels are unchanged in soleus (A) but not plantaris (B) muscles with ACE-031 administration. Expression of MHC isoform transcripts in the soleus and plantaris were adjusted for loading and total cDNA in multiplex reactions with 18S. The soleus exhibited no change in MHC isoform transcript levels, whereas the plantaris showed a decline in MHC I and IIa with ACE-031 treatment. Values are presented as means ± SE. *P < 0.05.
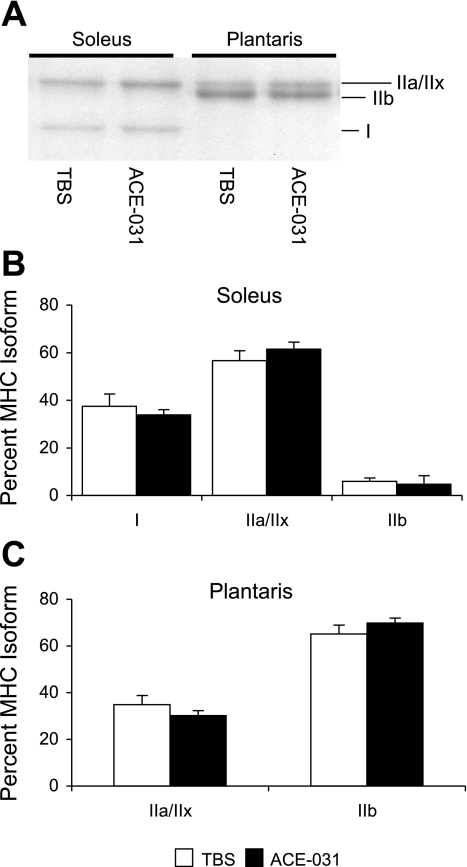
We isolated total protein from the soleus and plantaris to determine whether protein expression of MHC isoforms followed a similar pattern of expression as their corresponding transcripts. In rodent skeletal muscle, electrophoretic separation of MHC isoforms is typically characterized by a rapid migration of MHC I followed by IIb, IIx, and IIa (12). In our experiment, MHC isoforms followed a similar pattern of migration (Fig. 8A); however, MHC IIa and IIx migrated closely together, appearing as a single band, and were, therefore, difficult to quantify separately. From here on they are referred to as MHC IIa/IIx.
Fig. 8.
MHC protein levels do not change in the soleus or plantaris with ACE-031 treatment. A: representative gel depicting MHC isoform separation in soleus and plantaris muscles. MHC I migrates first followed by IIb and IIa/IIx. Densitometric analysis of MHC isoforms indicates no change in the pattern of MHC isoform expression with ACE-031 administration in soleus (B) or plantaris (C) muscles. Values are presented as means ± SE.
Soleus MHC content in the TBS-treated mice was 37% type I, 57% IIa/IIx, and 6% IIb (Fig. 8B). These levels were not different after 28 days of ACE-031 administration (34%, I; 61% IIa/x; 5% IIb). In the plantaris of the TBS-treated group, only MHC IIa/IIx and IIb were detected at 35 and 65%, respectively. These levels did not differ significantly with ACE-031 administration (30% type IIa/x; 70% type IIb; Fig. 8C).
Thus the decline in MHC I and IIa transcripts was not associated with a corresponding decrease in MHC isoform protein levels within the 28-day period of treatment; however, as we were unable to distinguish between MHC IIa and IIx, we could not determine whether there was a change in the expression of the individual isoforms. Additionally, the duration of treatment may not have been sufficient to alter the MHC profile at the protein level.
DISCUSSION
The hypermuscular phenotype associated with the numerous species presenting with myostatin null mutations has encouraged the development of myostatin antagonists that offer promising new therapies in the prevention of muscle loss and function associated with musculoskeletal disorders. Preclinical studies investigating myostatin inhibition in a mouse model of muscular dystrophy have demonstrated significant improvements in both muscle mass and functional capacity (8, 9). Interestingly, the use of a myostatin neutralizing antibody in a clinical trial consisting of muscular dystrophy patients failed to yield similar results (41). Although the neutralizing antibody was associated with improvements in contractile properties at the single fiber level (24), this did not translate to greater muscle mass or functional capacity at the whole body level. Therefore, employing a more broad-based therapeutic, i.e., one that inhibits multiple negative regulators of skeletal muscle, may be necessary to augment the efficacy of these therapies. To date, several preclinical studies have been completed investigating the effects of RAP-031, an analog of ACE-031 containing the Fc region of murine IgG. These studies have demonstrated improvements in obesity and insulin sensitivity (2), as well as increases in muscle mass and functional capacity in mouse models of hypoxia (36) and amyotrophic lateral sclerosis (31). Consistent with RAP-031, we have shown that muscle mass is increased by the administration of ACE-031, a soluble form of the extracellular region of ActRIIB fused to the Fc region of human IgG. Furthermore, we have also shown that muscle growth occurs in a non-fiber-type-specific manner, without altering fiber-type distribution or the MHC profile after 28 days of treatment.
Consistent with results reported from previous myostatin blockade experiments (8, 47), ACE-031 administration produced a significant increase in body weight that corroborated an increase in muscle mass. Administration of the myostatin neutralizing antibody JA16 for 15 wk produced a significant increase in body weight compared with nontreated controls (47). However, in our experiment, the administration of ACE-031 for only 4 wk also produced a significant increase in body weight (Fig. 1). We suspect that the more rapid degree of weight gain is attributed largely to the greater muscle-building capacity of ACE-031 via its ability to inhibit multiple ActRIIB ligands functioning as negative regulators of skeletal muscle. This may indeed be the case, as muscles exhibited a pattern of growth that was proportionately greater than that of body weight (Fig. 2, C and E). Our work is consistent with Lee (25), who observed similar increases in muscle weights after 4 wk of treatment with soluble ActRIIB. Furthermore, a side-by-side comparison of the myostatin-neutralizing antibody JA16 and soluble ActRIIb in myostatin-deficient mice concluded that the inhibition of multiple ActRIIB ligands stimulates greater muscle growth than myostatin inhibition alone (26).
We have also demonstrated that ACE-031-induced muscle growth does not discriminate on the basis of fiber-type distribution. We observed comparable increases in the weights of the type I-rich soleus and the type II-rich plantaris and gastrocnemius (Fig. 2, A–C and E). To our knowledge, there are no reports specifically investigating the effects of myostatin inhibition on muscles that differ in fiber-type distribution or MHC isoform content. Therefore, we are the first to report that the inhibition of myostatin and other negative regulators of skeletal muscle by a soluble form of ActRIIB increases muscle mass, independent of fiber-type expression. Interestingly, we observed a significant difference in weight gain between the plantaris and EDL; muscles that differ on the basis of function, but not fiber-type expression. As a plantar flexor, the plantaris bears considerably more body weight than the EDL, which functions in dorsiflexion and metatarsal extension and, consequently, is limited to only bearing the weight of the foot. Therefore, muscle function and the degree of weight-bearing may be influential in establishing the degree of muscle growth in response to the inhibition of negative regulators of skeletal muscle. One may argue that, as the soleus is relatively more active during normal weight-bearing (44), this muscle would be most responsive to ACE-031 treatment. However, according to Mendias et al. (30), ActRIIB expression in the soleus is only 50% of that of the EDL, thereby rendering the soleus less responsive to ActRIIB loss of signaling. On the other hand, if muscle growth is indeed proportional to activity level, this may compensate for lower ActRIIB expression, ultimately leading to a net gain of muscle. However, to better clarify the role of weight-bearing and muscle function on the degree of ACE-031-induced muscle growth, future studies should investigate the effects of ACE-031 on muscles with diminished activity or function, such as those subjected to unloading or immobilization.
Girgenrath et al. (13) reported that 12 wk of myostatin inhibition by a neutralizing antibody did not alter fiber-type distribution or MHC isoform transcript levels. Consistent with this, we did not observe a difference in fiber-type distribution of the soleus or plantaris of ACE-031- and TBS-treated mice after 4 wk of treatment (Fig. 4C and data not shown). Moreover, the hypertrophic response to ACE-031 was not fiber-type specific, as type I and II fibers of the soleus exhibited a comparable increase in cross-sectional area (Fig. 4, A and B). While we did not detect a difference in the proportion of MHC isoform proteins in the soleus or plantaris after 28 days of ACE-031 treatment (Fig. 8), we did detect a decline in MHC I and IIa transcript levels in the plantaris (Fig. 7B), suggesting the duration of treatment was not adequate to stimulate changes at the protein level. However, as the half-life of MHC proteins is ∼7–10 days (6), we believe that 28 days of ACE-031 treatment is sufficient to detect a shift in MHC isoform protein levels. For example, a decline in type I and IIa fibers and an increase in type IIx and IIb fibers is detected after 4 wk of β2-adrenoceptor agonist administration (5, 37), and changes in MHC profile are observed in as little as 2 wk of hindlimb unloading (11) and compensatory hypertrophy (1) in rats. Therefore, we believe it is unlikely that ACE-031 administration induces changes in fiber-type distribution in skeletal muscle. However, this should be confirmed in future studies involving a longer duration of treatment in mice and other species. Last, myostatin deficiency is associated with a decrease in myocyte enhance factor 2 expression and an increase in MyoD (18); a pattern of myogenic regulatory factor (MRF) expression indicative of a faster and more glycolytic phenotype (23, 46). While we did not measure MRF expression in the present study, future studies should address the role of MRFs in ACE-031-induced hypertrophy and their potential consequences on the inherent MHC profile.
In summary, the inhibition of myostatin and other negative regulators of skeletal muscle by ACE-031 may offer promise as a potential therapy in the treatment of diseases affecting skeletal muscle, such as muscular dystrophy and amyotrophic lateral sclerosis. An advantage of this treatment over other prospective treatments, such as β2-adrenoceptor agonists, is that it stimulates muscle growth in a non-fiber-type-specific manner, without altering the MHC chain profile or fiber-type distribution.
DISCLOSURES
The authors declare competing financial interests as experiments were conceived, designed, performed, and analyzed by full-time Acceleron Pharma employees.
ACKNOWLEDGMENTS
We thank Edouard Vannier (Tufts Medical Center, Boston, MA) for designing custom MHC I, IIa, and IIb probe and primer sequences; Yijun Yang (Acceleron Pharma) for assistance with statistical analysis; and Tim Ahern for help editing this paper.
REFERENCES
- 1. Adams GR, Caiozzo VJ, Haddad F, Baldwin KM. Cellular and molecular responses to increased skeletal muscle loading after irradiation. Am J Physiol Cell Physiol 283: C1182–C1195, 2002 [DOI] [PubMed] [Google Scholar]
- 2. Akpan I, Goncalves MD, Dhir R, Yin X, Pistilli EE, Bogdanovich S, Khurana TS, Ucran J, Lachey J, Ahima RS. The effects of a soluble activin type IIB receptor on obesity and insulin sensitivity. Int J Obes (Lond) 33: 1265–1273, 2009 [DOI] [PMC free article] [PubMed] [Google Scholar]
- 3. Amthor H, Macharia R, Navarrete R, Schuelke M, Brown SC, Otto A, Voit T, Muntoni F, Vrbova G, Partridge T, Zammit P, Bunger L, Patel K. Lack of myostatin results in excessive muscle growth but impaired force generation. Proc Natl Acad Sci U S A 104: 1835–1840, 2007 [DOI] [PMC free article] [PubMed] [Google Scholar]
- 4. Amthor H, Nicholas G, McKinnell I, Kemp CF, Sharma M, Kambadur R, Patel K. Follistatin complexes myostatin and antagonises myostatin-mediated inhibition of myogenesis. Dev Biol 270: 19–30, 2004 [DOI] [PubMed] [Google Scholar]
- 5. Baker DJ, Constantin-Teodosiu D, Jones SW, Timmons JA, Greenhaff PL. Chronic treatment with the beta(2)-adrenoceptor agonist prodrug BRL-47672 impairs rat skeletal muscle function by inducing a comprehensive shift to a faster muscle phenotype. J Pharmacol Exp Ther 319: 439–446, 2006 [DOI] [PubMed] [Google Scholar]
- 6. Baldwin KM, Haddad F. Skeletal muscle plasticity: cellular and molecular responses to altered physical activity paradigms. Am J Phys Med Rehabil 81: S40–S51, 2002 [DOI] [PubMed] [Google Scholar]
- 7. Bassel-Duby R, Olson EN. Signaling pathways in skeletal muscle remodeling. Annu Rev Biochem 75: 19–37, 2006 [DOI] [PubMed] [Google Scholar]
- 8. Bogdanovich S, Krag TO, Barton ER, Morris LD, Whittemore LA, Ahima RS, Khurana TS. Functional improvement of dystrophic muscle by myostatin blockade. Nature 420: 418–421, 2002 [DOI] [PubMed] [Google Scholar]
- 9. Bogdanovich S, Perkins KJ, Krag TO, Whittemore LA, Khurana TS. Myostatin propeptide-mediated amelioration of dystrophic pathophysiology. FASEB J 19: 543–549, 2005 [DOI] [PubMed] [Google Scholar]
- 10. Clop A, Marcq F, Takeda H, Pirottin D, Tordoir X, Bibe B, Bouix J, Caiment F, Elsen JM, Eychenne F, Larzul C, Laville E, Meish F, Milenkovic D, Tobin J, Charlier C, Georges M. A mutation creating a potential illegitimate microRNA target site in the myostatin gene affects muscularity in sheep. Nat Genet 38: 813–818, 2006 [DOI] [PubMed] [Google Scholar]
- 11. Desaphy JF, Pierno S, Liantonio A, De LA, Didonna MP, Frigeri A, Nicchia GP, Svelto M, Camerino C, Zallone A, Camerino DC. Recovery of the soleus muscle after short- and long-term disuse induced by hindlimb unloading: effects on the electrical properties and myosin heavy chain profile. Neurobiol Dis 18: 356–365, 2005 [DOI] [PubMed] [Google Scholar]
- 12. Fauteck SP, Kandarian SC. Sensitive detection of myosin heavy chain composition in skeletal muscle under different loading conditions. Am J Physiol Cell Physiol 268: C419–C424, 1995 [DOI] [PubMed] [Google Scholar]
- 13. Girgenrath S, Song K, Whittemore LA. Loss of myostatin expression alters fiber-type distribution and expression of myosin heavy chain isoforms in slow- and fast-type skeletal muscle. Muscle Nerve 31: 34–40, 2005 [DOI] [PubMed] [Google Scholar]
- 14. Grootenhuis MA, de Boone J, van der Kooi AJ. Living with muscular dystrophy: health related quality of life consequences for children and adults. Health Qual Life Outcomes 5: 31, 2007 [DOI] [PMC free article] [PubMed] [Google Scholar]
- 15. Haidet AM, Rizo L, Handy C, Umapathi P, Eagle A, Shilling C, Boue D, Martin PT, Sahenk Z, Mendell JR, Kaspar BK. Long-term enhancement of skeletal muscle mass and strength by single gene administration of myostatin inhibitors. Proc Natl Acad Sci U S A 105: 4318–4322, 2008 [DOI] [PMC free article] [PubMed] [Google Scholar]
- 16. Harrison BC, Allen DL, Girten B, Stodieck LS, Kostenuik PJ, Bateman TA, Morony S, Lacey D, Leinwand LA. Skeletal muscle adaptations to microgravity exposure in the mouse. J Appl Physiol 95: 2462–2470, 2003 [DOI] [PubMed] [Google Scholar]
- 17. Harrison BC, Allen DL, Girten B, Stodieck LS, Kostenuik PJ, Bateman TA, Morony S, Lacey D, Leinwand LA. Skeletal muscle adaptations to microgravity exposure in the mouse. J Appl Physiol 95: 2462–2470, 2003 [DOI] [PubMed] [Google Scholar]
- 18. Hennebry A, Berry C, Siriett V, O'Callaghan P, Chau L, Watson T, Sharma M, Kambadur R. Myostatin regulates fiber-type composition of skeletal muscle by regulating MEF2 and MyoD gene expression. Am J Physiol Cell Physiol 296: C525–C534, 2009 [DOI] [PubMed] [Google Scholar]
- 19. Hill JJ, Davies MV, Pearson AA, Wang JH, Hewick RM, Wolfman NM, Qiu Y. The myostatin propeptide and the follistatin-related gene are inhibitory binding proteins of myostatin in normal serum. J Biol Chem 277: 40735–40741, 2002 [DOI] [PubMed] [Google Scholar]
- 20. Holmes JH, Ashmore CR, Robinson DW. Effects of stress on cattle with hereditary muscular hypertrophy. J Anim Sci 36: 684–694, 1973 [DOI] [PubMed] [Google Scholar]
- 21. Karjalainen J, Tikkanen H, Hernelahti M, Kujala UM. Muscle fiber-type distribution predicts weight gain and unfavorable left ventricular geometry: a 19 year follow-up study. BMC Cardiovasc Disord 6: 2, 2006 [DOI] [PMC free article] [PubMed] [Google Scholar]
- 22. Kiebert GM, Green C, Murphy C, Mitchell JD, O'Brien M, Burrell A, Leigh PN. Patients' health-related quality of life and utilities associated with different stages of amyotrophic lateral sclerosis. J Neurol Sci 191: 87–93, 2001 [DOI] [PubMed] [Google Scholar]
- 23. Kim MS, Fielitz J, McAnally J, Shelton JM, Lemon DD, McKinsey TA, Richardson JA, Bassel-Duby R, Olson EN. Protein kinase D1 stimulates MEF2 activity in skeletal muscle and enhances muscle performance. Mol Cell Biol 28: 3600–3609, 2008 [DOI] [PMC free article] [PubMed] [Google Scholar]
- 24. Krivickas LS, Walsh R, Amato AA. Single muscle fiber contractile properties in adults with muscular dystrophy treated with MYO-029. Muscle Nerve 39: 3–9, 2009 [DOI] [PubMed] [Google Scholar]
- 25. Lee SJ. Regulation of muscle mass by myostatin. Annu Rev Cell Dev Biol 20: 61–86, 2004 [DOI] [PubMed] [Google Scholar]
- 26. Lee SJ, Reed LA, Davies MV, Girgenrath S, Goad ME, Tomkinson KN, Wright JF, Barker C, Ehrmantraut G, Holmstrom J, Trowell B, Gertz B, Jiang MS, Sebald SM, Matzuk M, Li E, Liang LF, Quattlebaum E, Stotish RL, Wolfman NM. Regulation of muscle growth by multiple ligands signaling through activin type II receptors. Proc Natl Acad Sci U S A 102: 18117–18122, 2005 [DOI] [PMC free article] [PubMed] [Google Scholar]
- 27. Link BA, Nishi R. Opposing effects of activin A and follistatin on developing skeletal muscle cells. Exp Cell Res 233: 350–362, 1997 [DOI] [PubMed] [Google Scholar]
- 28. McPherron AC, Lawler AM, Lee SJ. Regulation of skeletal muscle mass in mice by a new TGF-beta superfamily member. Nature 387: 83–90, 1997 [DOI] [PubMed] [Google Scholar]
- 29. McPherron AC, Lee SJ. Double muscling in cattle due to mutations in the myostatin gene. Proc Natl Acad Sci U S A 94: 12457–12461, 1997 [DOI] [PMC free article] [PubMed] [Google Scholar]
- 30. Mendias CL, Marcin JE, Calerdon DR, Faulkner JA. Contractile properties of EDL and soleus muscles of myostatin-deficient mice. J Appl Physiol 101: 898–905, 2006 [DOI] [PMC free article] [PubMed] [Google Scholar]
- 31. Morrison BM, Lachey JL, Warsing LC, Ting BL, Pullen AE, Underwood KW, Kumar R, Sako D, Grinberg A, Wong V, Colantuoni E, Seehra JS, Wagner KR. A soluble activin type IIB receptor improves function in a mouse model of amyotrophic lateral sclerosis. Exp Neurol 217: 258–268, 2009 [DOI] [PubMed] [Google Scholar]
- 32. Mosher DS, Quignon P, Bustamante CD, Sutter NB, Mellersh CS, Parker HG, Ostrander EA. A mutation in the myostatin gene increases muscle mass and enhances racing performance in heterozygote dogs. PLoS Genet 3: e79, 2007 [DOI] [PMC free article] [PubMed] [Google Scholar]
- 33. Nakatani M, Takehara Y, Sugino H, Matsumoto M, Hashimoto O, Hasegawa Y, Murakami T, Uezumi A, Takeda S, Noji S, Sunada Y, Tsuchida K. Transgenic expression of a myostatin inhibitor derived from follistatin increases skeletal muscle mass and ameliorates dystrophic pathology in mdx mice. FASEB J 22: 477–487, 2008 [DOI] [PubMed] [Google Scholar]
- 34. Oberbach A, Bossenz Y, Lehmann S, Niebauer J, Adams V, Paschke R, Schon MR, Bluher M, Punkt K. Altered fiber distribution and fiber-specific glycolytic and oxidative enzyme activity in skeletal muscle of patients with type 2 diabetes. Diabetes Care 29: 895–900, 2006 [DOI] [PubMed] [Google Scholar]
- 35. Ohsawa Y, Hagiwara H, Nakatani M, Yasue A, Moriyama K, Murakami T, Tsuchida K, Noji S, Sunada Y. Muscular atrophy of caveolin-3-deficient mice is rescued by myostatin inhibition. J Clin Invest 116: 2924–2934, 2006 [DOI] [PMC free article] [PubMed] [Google Scholar]
- 36. Pistilli EE, Bogdanovich S, Mosqueira M, Lachey J, Seehra J, Khurana TS. Pretreatment with a soluble activin type IIB receptor/Fc fusion protein improves hypoxia-induced muscle dysfunction. Am J Physiol Regul Integr Comp Physiol 298: R96–R103, 2010 [DOI] [PMC free article] [PubMed] [Google Scholar]
- 37. Ryall JG, Gregorevic P, Plant DR, Sillence MN, Lynch GS. Beta 2-agonist fenoterol has greater effects on contractile function of rat skeletal muscles than clenbuterol. Am J Physiol Regul Integr Comp Physiol 283: R1386–R1394, 2002 [DOI] [PubMed] [Google Scholar]
- 38. Schuelke M, Wagner KR, Stolz LE, Hubner C, Riebel T, Komen W, Braun T, Tobin JF, Lee SJ. Myostatin mutation associated with gross muscle hypertrophy in a child. N Engl J Med 350: 2682–2688, 2004 [DOI] [PubMed] [Google Scholar]
- 39. Suryawan A, Frank JW, Nguyen HV, Davis TA. Expression of the TGF-beta family of ligands is developmentally regulated in skeletal muscle of neonatal rats. Pediatr Res 59: 175–179, 2006 [DOI] [PubMed] [Google Scholar]
- 40. Wagner KR. Muscle regeneration through myostatin inhibition. Curr Opin Rheumatol 17: 720–724, 2005 [DOI] [PubMed] [Google Scholar]
- 41. Wagner KR, Fleckenstein JL, Amato AA, Barohn RJ, Bushby K, Escolar DM, Flanigan KM, Pestronk A, Tawil R, Wolfe GI, Eagle M, Florence JM, King WM, Pandya S, Straub V, Juneau P, Meyers K, Csimma C, Araujo T, Allen R, Parsons SA, Wozney JM, Lavallie ER, Mendell JR. A phase I/II trial of MYO-029 in adult subjects with muscular dystrophy. Ann Neurol 63: 561–571, 2008 [DOI] [PubMed] [Google Scholar]
- 42. Wagner KR, Liu X, Chang X, Allen RE. Muscle regeneration in the prolonged absence of myostatin. Proc Natl Acad Sci U S A 102: 2519–2524, 2005 [DOI] [PMC free article] [PubMed] [Google Scholar]
- 43. Wagner KR, McPherron AC, Winik N, Lee SJ. Loss of myostatin attenuates severity of muscular dystrophy in mdx mice. Ann Neurol 52: 832–836, 2002 [DOI] [PubMed] [Google Scholar]
- 44. Walmsley B, Hodgson JA, Burke RE. Forces produced by medial gastrocnemius and soleus muscles during locomotion in freely moving cats. J Neurophysiol 41: 1203–1216, 1978 [DOI] [PubMed] [Google Scholar]
- 45. Welle S, Bhatt K, Pinkert CA. Myofibrillar protein synthesis in myostatin-deficient mice. Am J Physiol Endocrinol Metab 290: E409–E415, 2006 [DOI] [PubMed] [Google Scholar]
- 46. Wheeler MT, Snyder EC, Patterson MN, Swoap SJ. An E-box within the MHC IIB gene is bound by MyoD and is required for gene expression in fast muscle. Am J Physiol Cell Physiol 276: C1069–C1078, 1999 [DOI] [PubMed] [Google Scholar]
- 47. Whittemore LA, Song K, Li X, Aghajanian J, Davies M, Girgenrath S, Hill JJ, Jalenak M, Kelley P, Knight A, Maylor R, O'Hara D, Pearson A, Quazi A, Ryerson S, Tan XY, Tomkinson KN, Veldman GM, Widom A, Wright JF, Wudyka S, Zhao L, Wolfman NM. Inhibition of myostatin in adult mice increases skeletal muscle mass and strength. Biochem Biophys Res Commun 300: 965–971, 2003 [DOI] [PubMed] [Google Scholar]


