Abstract
Tendinous tissues respond to chronic unloading with adaptive changes in mechanical, elastic, and morphological properties. However, little is known about the changes in the detailed structures of the entire tendinous tissue and whether the change in tendon stiffness is related to morphology. We investigated changes in dimensional (volume, cross-sectional area, segmented lengths) and elastic (Young's modulus) properties of the Achilles tendon and distal aponeurosis in response to chronic unilateral lower limb suspension (ULLS) using velocity encoded phase contrast (VE-PC) and three-dimensional morphometric magnetic resonance imaging (MRI). Five healthy subjects underwent ULLS for 4 wk. Axial morphometric MRI was acquired along the entire length from the calcaneous to the medial gastrocnemius insertion. An oblique sagittal VE-PC MRI was also acquired. The Young's modulus could be calculated from this cine dynamic sequence of velocity encoded images from the slope of the stress-strain curve during the submaximal isometric plantar flexion. After 4 wk of ULLS, we found significant (46.7%) decrease in maximum plantar flexion torque. The total volumes of entire tendinous tissue (determined as the sum of the Achilles tendon and distal aponeurosis) increased significantly by 6.4% (11.9 vs. 12.7 ml) after ULLS. In contrast, Young's modulus decreased significantly by 10.4% (211.7 vs. 189.6 MPa) for the Achilles tendon and 29.0% for the distal aponeurosis (158.8 vs. 113.0 MPa) following ULLS. There was no significant correlation between relative change in volume and Young's modulus with 4 wk of ULLS. It is suggested that, although tendon hypertrophy can be expected to adversely affect tendon stiffness, the absence of any significant correlation between the magnitude of tendon hypertrophy and reduced Young's modulus indicates that dimensional factors were not critical to the elastic properties.
Keywords: Young's modulus, stress-strain, stiffness, magnetic resonance imaging
the morphology of tendinous structures and their elastic properties have significant impact on the joint kinetics involved in various movements. Changes in these properties of tendon tissue have been reported in response to both increased and decreased levels of physical loading (for a review, please see Ref. 19). Although the effect of increased levels of loading has been comprehensively studied, experiments investigating the effect of chronic unloading have focused largely on alteration in mechanical properties. Numerous studies have shown that chronic unloading leads to reduced tendon mechanical stiffness in vivo in humans and animals (e.g., Ref. 19). However, the exact causative mechanism remains unclear. The reductions in tendon mechanical stiffness is generally attributed to material deterioration, since the tendon cross-sectional area (CSA) remained unchanged with chronic unloading in humans (9, 15, 27, 30). However, this conclusion necessitates several major presumptions. The results of animal experiments characterizing the effect of chronic unloading on tendon dimension are inconsistent. For example, in animal models, tendon size has been shown to decrease (24), as well as not to change (2, 12, 21), or to increase (14, 35) in response to chronic unloading. Several human studies (9, 15, 27, 30) have indicated that chronic unloading does not lead to significant change in tendon size, but dimensional measures were limited to a very restricted fraction of the length. Thus there is a considerable amount of ambiguity regarding the changes in the detailed structures of the entire tendinous tissue, and, furthermore, since there is considerable uncertainty related to the mechanism of decreased tendon stiffness following chronic unloading, there is a necessity to determine whether the changes in tendon stiffness are related to morphology. In addition, we examined the response of the aponeurosis to chronic unloading given that some regions undergo compression along the load axis during a contraction (11, 13). Recent modeling efforts suggest that this phenomenon may be pennation angle dependent (6). Given that the pennation angle decreases with atrophy (23), we would predict that the apparent regional contraction of the aponeurosis should increase and overall aponeurosis strain should decrease. The presence or absence of such changes in atrophic muscle would therefore help determine the validity of such a model.
Our objective in this investigation was to determine the relationship between the changes in dimensions and stiffness of the human tendon and aponeurosis in response to chronic unloading of the limb. The changes in the dimension and stiffness of tendinous tissue were measured using velocity encoded phase contrast (VE-PC) and three-dimensional morphometric magnetic resonance imaging (MRI) techniques. The superior soft tissue contrast and a large field of view (FOV) afforded by the MRI techniques allow measurement over a large volume of multiple intramuscular tissue structures with a high image resolution.
We have previously reported changes in the soleus aponeurosis strain distribution (17) and Achilles tendon stiffness (30) with 4 wk of unilateral lower limb suspension (ULLS). In the present study, we examined changes in 1) dimensional properties, i.e., volume, CSA, and length of the cross-sectional segment of the Achilles tendon and distal aponeurosis, and 2) relationship between changes in dimension and stiffness of the Achilles tendon and distal aponeurosis, with 4 wk of ULLS using VE-PC and three-dimensional morphometric MRI. We hypothesized that tendinous tissues would alter its volume following 4 wk of ULLS, and change in volume of the tendinous tissues would be associated with reduction in the stiffness.
METHODS
Subjects.
Five healthy subjects (4 men and 1 woman, age 24.2 ± 5.4 yr, height 178.8 ± 18.5 cm, weight 76.4 ± 9.7 kg) with no history of neurological and musculoskeletal disorders were recruited. Before their participation, detailed information of the experimental procedures and possible risks of the procedures were explained to the subjects, and written, informed consent was obtained. Experimental protocols used in this study were approved by the Institutional Medical Review Board of the University of California, Los Angeles.
Study design.
One week before the intervention, all subjects underwent orientation and familiarization with the different elements of the ULLS and all testing procedures. All baseline data were collected in the week before starting ULLS. The duration of the ULLS intervention was chosen to be 4 wk, based on the observations in previous studies that significant muscle atrophy occurred following ∼3–4 wk of unloading (4, 28). Subsequent measurements were performed on day 28 (4 wk) of ULLS. Subjects were subsequently made to participate in guided physical rehabilitation for 6 wk to facilitate return to normalcy.
ULLS.
The volunteers were subjected to a unilateral unloading protocol of the dominant leg. This has been used by this group in the past (17, 30). One of the subject's legs was raised from the ground with the knee joint maintained at ∼120° using an adjustable sling, which was anchored at the subject's waist and attached to the foot of the suspended leg. Additional ground clearance for the suspended leg was achieved by adding a 5-cm raised platform on the shoe on the other feet, so that chances of accidental dragging of the foot were minimized. All ambulatory activities during the ULLS were achieved using only the non-suspended leg, together with provided crutches. The subjects' compliance was monitored by daily telephone interview and a weekly journal that reported detailed activities and any symptom of complications. A physician monitored the subjects weekly for any indication of pathological complications such as thrombosis.
Force measurement.
Ankle plantarflexion torque was measured using a fiberglass cast equipped with an optical Fabry-perot interferometer strain gauge system (Fiberscan 2000, Luna Innovations, Blacksburg, VA). The fiberglass cast was molded to accommodate each subject's posterior half of the lower leg. The leg was immobilized within the cast with the ankle joint at 90° by tightly wrapping layers of elastic bandage and securing adhesive tape around the leg, while ensuring that the blood circulation was not hindered. The subject was secured to the bed with straps placed around the hips and knee with the knee joint at 180° to avoid movement. The strain gauge signal was digitally sampled at 200 Hz and stored in a personal computer using an indigenously developed data acquisition program (LabView, National Instruments, Austin, TX). The strain was calibrated with four known weights to obtain a calibration factor relating cast strain with the force on the ball of the foot. For the measurement of maximum ankle plantar flexion torque, the subject was instructed to perform maximal isometric contraction and to hold the maximal torque level for ∼3–5 s three times with at least a 1-min resting period between the trials. The highest torque among three trials was taken as the maximum voluntary contraction (MVC). Achilles tendon force was calculated by dividing the MVC torque by the moment arm of the tendon. Using a modified Reuleaux method (36), the moment arm was measured from the magnetic resonance (MR) sagittal plane images at the tested ankle angle by digitizing the perpendicular distance from the corresponding instant center of rotation of the talocrural joint to the Achilles tendon line of action.
MRI.
The subject was laid in the supine position within the bore of a 3.0-Tesla Siemens Trio MR scanner (Malvern, PA). The leg remained within the fiberglass cast, and both legs were placed in a multi-channel, phased array torso coil during image acquisition. An oblique sagittal, two-dimensional spoiled gradient echo VE-PC sequence (prescribed off a series of axials from the calcaneus to the MG insertion), was used to acquire the cine dynamic sequence of velocity-encoded images. Velocity encoding (VENC) of 10 cm/s in the superior-inferior direction was used, with three views per segment, repetition time (TR)/echo time (TE)/flip angle of 13.3 ms/7.5 ms/20°, 3-mm slice thickness, 290-Hz receiver bandwith/pixel, 128 × 256 matrix size, 160 × 320-mm field of view (FOV), two averages. Retrospective gated mode was used to acquire time-resolved 22 frames during contraction cycle. The temporal resolution of each frame was ∼79.8 ms. VE-PC images were acquired from the lower leg under active plantarflexion against 40% of the subject's plantarflexion MVC strength. The 40% MVC was considered to be the maximum resistance that would not cause significant fatigue (13). The target force was projected and displayed on the scanner face in real time, allowing the subject to achieve the target force accurately and consistently. The subject performed ∼86 isometric contractions at a rate of 35 cycles/min with the guidance of a computer-generated audio metronome cue fed to the subject via headphone. The VE-PC MRI acquisition generated 22 non-interpolated time-resolved frames within the duration of each contraction cycle of ∼1.71 s.
Before the VE-PC image acquisition, morphological images were acquired in the axial plane from the calcaneous to the MG insertion by using a spoiled gradient echo sequence (TR/TE/flip angle: 371.0 ms/2.4 ms/45°; slice thickness: 5 mm; receiver bandwidth: 320 Hz/pixel; imaging matrix: 256 × 240; FOV: 180 mm × 168.75 mm; 2 averages, 30 slices). These images were used for the measurement of volume, CSA, and the cross-sectional segment lengths of the Achilles tendon and distal aponeurosis. Special care was taken to ensure that one of the axial slices corresponded to the level on the VE-PC MRI oblique sagittal plane where the tendon strain was calculated. This location level was ∼5 cm from the calcaneal insertion and was specifically chosen since this region is the thinnest and the most common site of tendon rupture and tear in humans (1). The reference lines corresponding to the oblique plane displayed on the axial images were saved on a laptop to be referenced in a subsequent imaging session (pre and post), thereby preserving the exact similar plane orientation prescribed in the pre-suspension session.
Image processing and analysis.
Image processing and analysis algorithms were indigenously developed in MATLAB (The Mathworks, Natick, MA). The systematic phase shading errors were quantified and subtracted from the individual phase image of the cine sequence using the technique by Sinha et al. (33). The error-corrected phase data was converted to velocity data using VENC such that the gray-scale intensity at each pixel represented its tissue velocity.
Displacement, strain, stress.
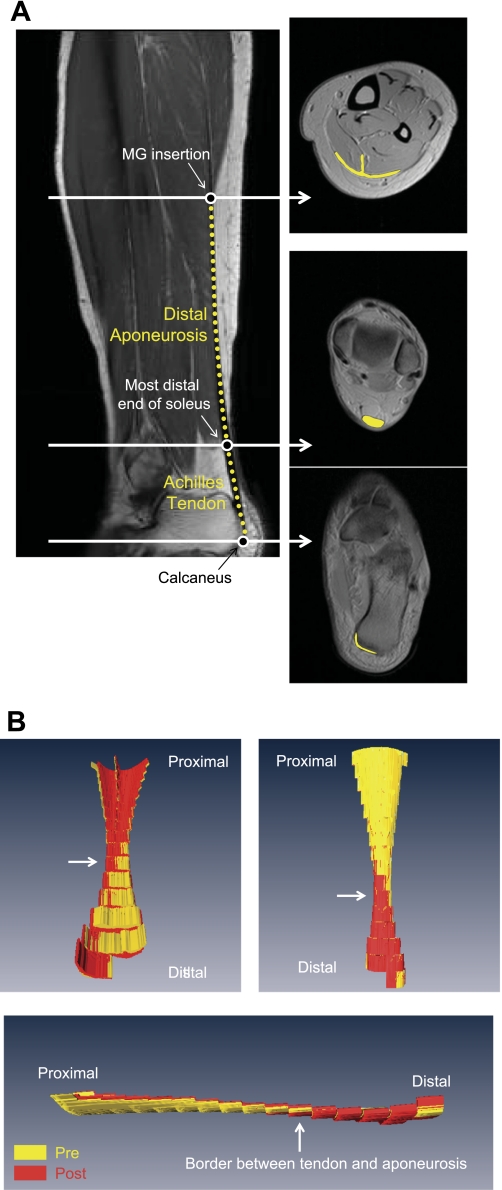
The 1 × 1 pixel region of interest (ROI) was positioned on the first image at MG insertion and the most distal end of the soleus. Care was taken to ensure that the projected ROI in the subsequent images in the rest of the contraction cycle did not fall into the tendinous tissue. The indigenously developed tracking algorithm calculated the mean velocity of a larger 3 × 3 pixel-matrix window centered on the original ROI. The mean filtered velocity was then multiplied by the temporal resolution of its frame to calculate the displaced location in the next frame. The pixel trajectory was thereafter calculated through the entire contraction cycle. This procedure allowed us to calculate the displacement (velocity × time). The displacement at the distal end of the Achilles tendon, where the pixel was positioned on the calcaneous, was manually determined from each magnitude image frame by using ImageJ. To compensate for bulk leg movement during contraction, the displacement of the calcaneus was also manually tracked at all 22 phases and was subtracted from the displacement. In the present study, we defined the Achilles tendon as being from the distal end of soleus to the calcaneous and distal aponeurosis as from the MG insertion to the most distal end of the soleus, respectively (Fig. 1). Strain was calculated by using the distances between points in two pairs of ROIs located in the soleus muscle adjacent to the posterior aponeurosis. One adjacent to the MG insertion and the other at the most distal end of soleus (i.e., distal aponeurosis), and the most distal end of soleus to the calcaneous (i.e., Achilles tendon), and measuring their changes between a given temporal phase and the resting length, respectively. The resting length was determined from the phase in which the plantar flexion torque had zero value during the contraction cycle. The maximal tendon force was divided by averaged Achilles tendon CSA and distal aponeurosis CSA over the entire length of the Achilles tendon and distal aponeurosis to obtain maximal tendon and aponeurosis stress, respectively. One subject was excluded from these analyses because of the low image quality during VE-PC MRI acquisition.
Fig. 1.
Representative oblique sagittal and axial morphological magnetic resonance (MR) images at rest (A) and typical examples of three-dimensional (3D) volume-rendered images of the Achilles tendon and distal aponeurosis in three different views (B). A: white arrows in sagittal image correspond to positions at three different axial images. The Achilles tendon is the segment between the most distal portion of the soleus (middle circle symbol on left) and the calcaneus (bottom circle symbol on left). The distal aponeurosis is the segment between the medial gastrocnemius (MG) insertion region (top circle symbol on left) and most distal portion of the soleus. Achilles tendon and distal aponeurosis are indicated by yellow lines both in the sagittal (dotted) and axial images (solid). There are some inaccuracies in calculating the tendon volume from the acquired MR images since it is difficult to define the most distal edge of the Achilles tendon, particularly as a clearly delineated line, since the Achilles tendon in reality “merges” into the calcaneus progressively. B: typical examples of 3D volume-rendered images of the Achilles tendon and distal aponeurosis in three different views. Achilles tendon and distal aponeurosis were volume rendered from axial morphological MR images. Yellow and red indicate pre- and post-unilateral lower limb suspension (ULLS), respectively.
Young's modulus.
The elastic modulus or Young's modulus, defined as the slope of the stress-strain curve, can be experimentally determined from the stress-strain relationship generated during a submaximal contraction (31). In the present study, stress and strain pair was calculated over all 22 phases during contraction cycle. The Young's modulus was calculated from the slope of “linear region” in the stress-strain curve, representing the contractile phase (from initiation of force generation to peak force exertion) of the cycle (31), i.e., the relaxation phase was excluded.
Volume, CSA, length.
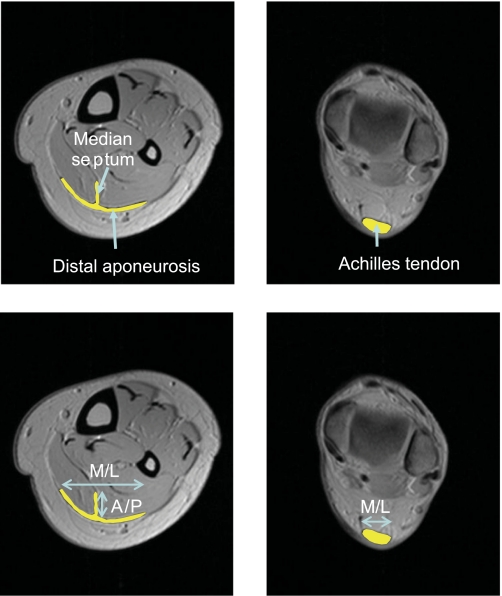
Morphological axial images were transferred to the personal computer. The CSA of the Achilles tendon and distal aponeurosis were manually traced and measured using Amira 5.2.2 (Visage Imaging, San Diego, CA). The volume was calculated by multiplying the sum of the CSAs by the distance between slices. Test-retest reproducibility of volume measurement was assessed with four male subjects (age 29 ± 5 yr, weight 73 ± 8 kg, height 176 ± 10 cm) within the same day. The lengths of the Achilles tendon and aponeurosis structure were calculated along the superior-inferior direction from either one morphological oblique sagittal image or several, if the border points of these structures could be localized only on different images. The lengths along the anterior-posterior and medial-lateral directions of the cross-sectional segment, i.e., the median septum, was calculated as the product of the number of pixels and the dimension of one pixel and were measured for the Achilles tendon and aponeurosis from multiple morphological axial images (Fig. 2).
Fig. 2.
Determination of cross-sectional segment lengths of the Achilles tendon (right), distal aponeurosis, and median septum (left), which are indicated by yellow lines. Segmented length of the Achilles tendon and distal aponeurosis are measured by medial-lateral (M/L) direction, and the median septum is measured by anterior-posterior (A/P) direction.
Statistics.
All reported values are presented as means ± SD. The nonparametric test chosen for this study has a power efficiency of 95% for small sample sizes compared with the equivalent parametric t-tests (32). To evaluate the effect of 4 wk of ULLS, a Friedman test was used with post hoc Wilcoxon's test. Spearman's Rho was used for the correlation analysis on a limited number of data. Reproducibility of volume measurement was assessed by intraclass correlation coefficient. The significance level was set at P < 0.05.
RESULTS
As reported previously (and therefore mentioned only briefly here for sake of continuity) MVC torque decreased significantly by 46.7% after 4 wk of ULLS (P < 0.05; 535.0 ± 91.5 N vs. 292.0 ± 112.4 N, with rate of 1.7% per day).
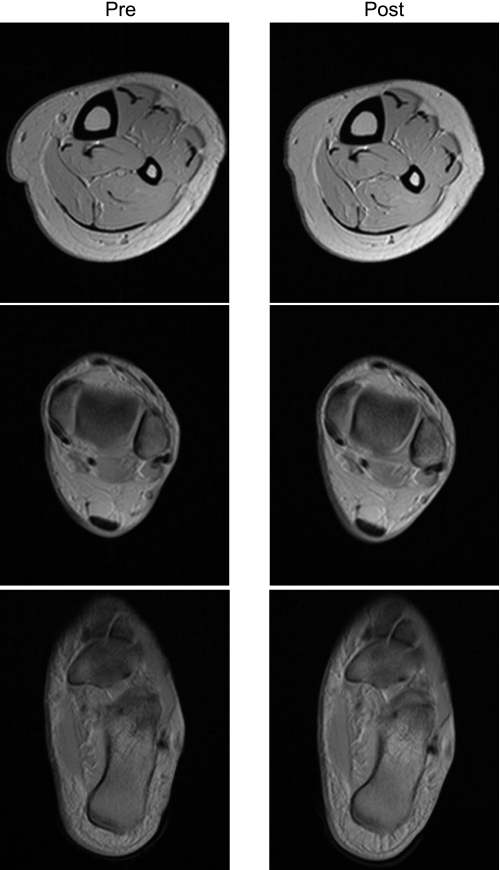
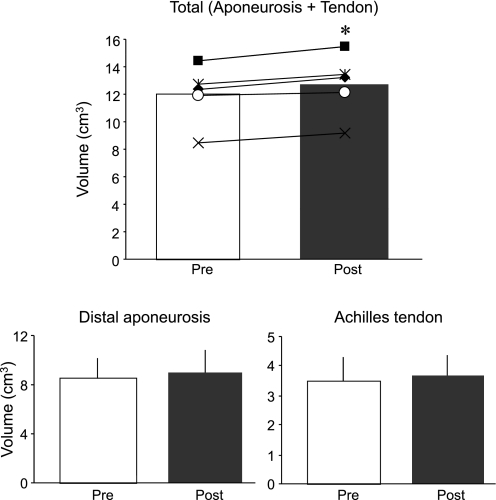
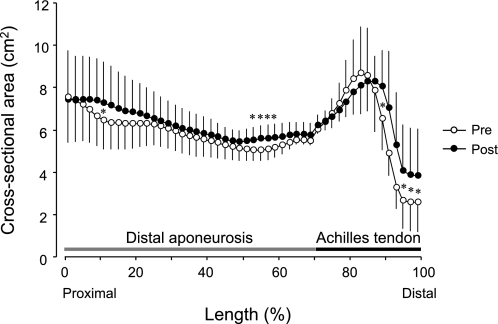
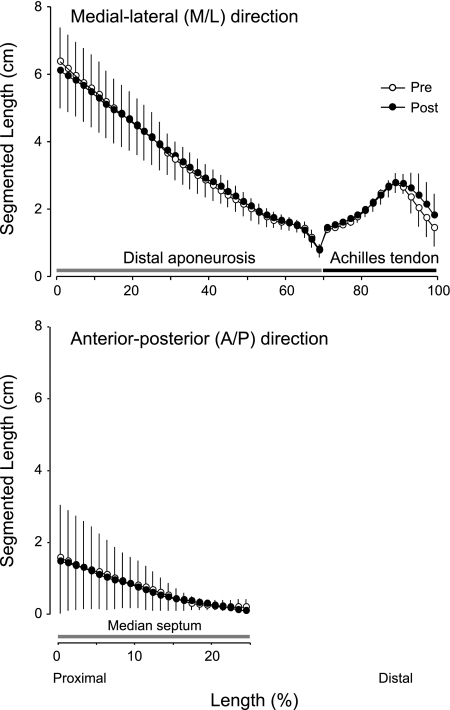
Volume measurement was highly reproducibility across sessions (intraclass correlation coefficient = 0.98). The positioning of consecutive axial images scanned pre- and post-ULLS were also reproducible, as shown in Fig. 3. The total volumes of tendinous tissues (determined as the sum of the Achilles tendon and distal aponeurosis volumes) increased significantly by 6.4% (P < 0.05, 11.9 ± 2.3 ml at pre and 12.7 ± 2.4 ml at post) after 4 wk of ULLS (Fig. 4). This tendency toward increased volume change was also observed in tendon (P = 0.09; 7.9%; 3.47 ± 0.85 ml at pre and 3.70 ± 0.71 ml at post) and distal aponeurosis volumes (P = 0.06; 5.7%; 8.48 ± 1.67 ml at pre and 8.99 ± 1.92 ml at post) but did not reach statistical significance. ULLS resulted in significant CSA increase in some regions of the Achilles tendon and distal aponeurosis CSA (Fig. 5). The total length of tendinous tissues (determined as the sum of tendon and distal aponeurosis length) along the superior-inferior direction decreased significantly by 1.6% at 4 wk of ULLS (P < 0.05; 21.7 ± 2.2 cm at pre and 21.4 ± 2.2 cm at post). Individually, both the tendon and distal aponeurosis lengths showed similar trends in shortening, but neither showed significant differences between pre- and post-ULLS lengths. The segmented length of the cross-sectional segment of both the Achilles tendon and distal aponeurosis and median septum did not change after 4 wk of ULLS (Fig. 6). These results indicate that increased volume of tendinous tissue arose mainly from an increase in its thickness.
Fig. 3.
Typical example of morphological MR images at three different axial images. Left and right columns indicate pre- and post-ULLS, respectively. Slice location in each axial image corresponds to positions in Fig. 1A.
Fig. 4.
Changes in volumes of the total Achilles tendon and distal aponeurosis (top) and individuals (bottom) following the 4-wk ULLS. Gray and black colors indicate pre- and post-ULLS, respectively. At top, each small marker indicates individual data of each subject (n = 5). Each data point presented is means ± SD. *Significant difference vs. pre-ULLS value (P < 0.05).
Fig. 5.
Changes in cross-sectional areas along the entire length of the Achilles tendon and distal aponeurosis following the 4 wk of ULLS (○, pre; ●, post). The entire length of the Achilles tendon and distal aponeurosis (i.e., the x-axis) is expressed as 100% using a cubic spline. Data points are means ± SD. *Significant difference vs. pre (P < 0.05).
Fig. 6.
Changes in segmented lengths of the Achilles tendon and distal aponeurosis (top), and median septum (bottom) following the 4-wk ULLS. The lengths (i.e., the x-axis) are expressed as 100% for the tendon and aponeurosis and 25% for medial septum using a cubic spline, respectively. Data points are means ± SD.
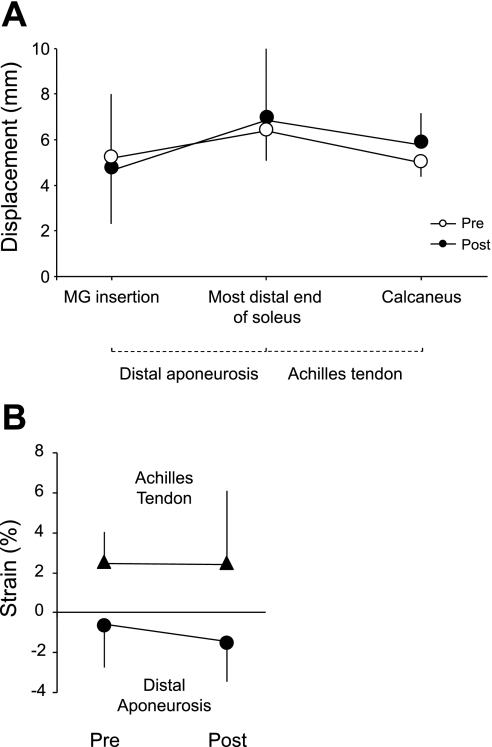
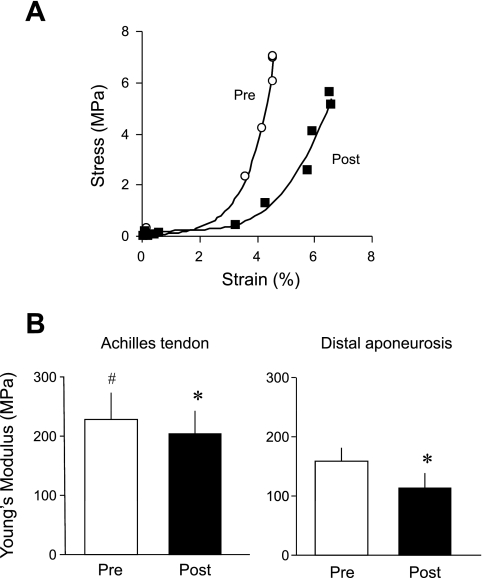
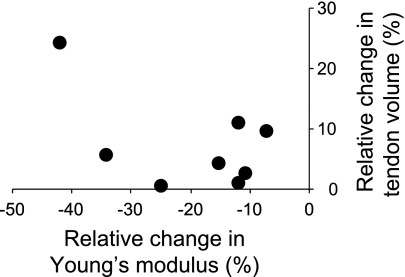
In Fig. 7A, points above the line indicate a proximal movement. Thus all ROIs moved proximally as the muscle contracted. If the ROIs did not move relative to the neighboring ROI, the strain value would remain at 0%. Values above 0% indicate a lengthening and points below a shortening. Consistent with our laboratory's previous findings (11, 17), the distal aponeurosis shortened during isometric contractions (Fig. 7B). The shortening was greater following ULLS but did not reach statistical significance. Maximal tendon stress decreased significantly by 46.2% for the Achilles tendon (P < 0.05; 19.2 ± 4.4 MPa at pre and 10.4 ± 3.1 MPa at post) and 44.5% for the distal aponeurosis (P < 0.05; 20.2 ± 3.2 MPa at pre and 11.5 ± 3.8 MPa at post) after 4 wk of ULLS. Young's modulus also decreased significantly by 10.4% for the Achilles tendon (P < 0.05; 211.7 ± 39.5 MPa at pre and 189.6 ± 34.3 MPa at post) and 29.0% for the distal aponeurosis (P < 0.05; 158.8 ± 23.0 MPa at pre and 113.0 ± 25.7 MPa at post) (Fig. 8). For the Achilles tendon, there was no significant correlation between relative change in volume and Young's modulus with 4 wk of ULLS (r = −0.54; P = 0.18) (Fig. 9).
Fig. 7.
A: displacement of each of three regions of interest (ROIs) located in MG insertion, most distal end of soleus, and calcaneus during submaximal [40% maximal voluntary contraction (MVC)] isometric contraction at pre- and post-ULLS. Location above the zero line indicates movement of the ROI in the proximal direction. B: strain of the Achilles tendon and distal aponeurosis during submaximal (40% MVC) isometric contraction at pre- and post-ULLS. Positive and negative strains indicate lengthening and shortening, respectively. Data points are means ± SD.
Fig. 8.
A: typical examples of stress-strain relationship of the Achilles tendon and distal aponeurosis from a representative subject pre- and post-ULLS. B: changes in Young's modulus of the Achilles tendon and distal aponeurosis following the 4-wk ULLS. Data points are means ± SD. *Significant difference vs. pre (P < 0.05). #Significant difference vs. distal aponeurosis (P < 0.05).
Fig. 9.
Relationship between relative changes in volume and Young's modulus of Achilles tendon and distal aponeurosis after 4 wk of ULLS. The regression line is not shown since the relationship was found to be insignificant.
DISCUSSION
The present study is the first to investigate the details of the simultaneous changes in morphology and elastic properties of the Achilles tendon and distal aponeurosis following 4 wk of unloading. We found that 4 wk of unloading induced tendon hypertrophy but reduced stiffness, suggesting that the composition of tendinous materials rather than dimension changes are responsible for the reduced stiffness. Our data further confirm the previous, somewhat counter-intuitive observations that the distal soleus aponeurosis shortens during an isometric contraction (11, 17). Although such shortening increased following muscle atrophy, it failed to reach statistical significance, thus tending to support Chi et al. (6) to explain aponeurosis shortening but providing no definitive measure.
Tendon hypertrophy.
In tendinous tissue, we found a significant 6% increase in volume after 4 wk of unloading. One explanation may arise from our further analysis showing that the entire length of the Achilles tendon and distal aponeurosis shortened along the superior-inferior direction and distal aponeurosis and median septum remained unchanged in cross-sectional segments length. This possibly indicates a slight increment of thickness rather than changes in the overall dimensions within a cross section. This assumption is supported by some relevant findings including an increase in rat collagen fiber proportion (5) and CSA of ewe spinal ligament (14) as a result of chronic unloading. However, animal data on the effects of chronic unloading on collagen fibril size, density, and number are conflicting. Human studies have demonstrated that, during 2 wk of unloading, there are either no changes or a downregulation of collagen I and III mRNA (12) and collagen synthesis (7), indicating that the ultrastructure of collagen fibril might not alter with chronic unloading. An increase in the water content in extracellular space may therefore provide a possible explanation for tendon hypertrophy. It is possible that extracellular space could be increased in response to chronic unloading (14, 35).
Earlier human studies have reported variable non-significant changes in CSA of various tendons (9, 15, 27, 30) after up to 90 days of unloading. We chose a sensitive statistical procedure to test for significance, and our relatively high-resolution data indicated regional differences in the tendon changes, suggesting a complex tendon response to unloading that may depend on location. The increases in CSA were observed mainly in distal portions of both the Achilles tendon and distal aponeurosis (Fig. 5). These findings might be associated with postural manipulations during ULLS and subsequent fluid shift eliciting marked changes in tendon and aponeurosis CSAs. The distal portions are therefore likely compartmental reservoirs for fluid redistribution associated with postural manipulations.
Young's modulus reduction in Achilles tendon.
In the present study, unloading clearly showed reduction of the Young's modulus, which mirrors that in Achilles tendon stiffness (10.4%). These findings are consistent with earlier studies showing reduced stiffness of tendon in humans following 4 wk of limb suspension (30) and 20 days of bed rest (15, 16). Although the tendon hypertrophy observed may be expected to compensate for the reduction in the tendon stiffness, the absence of any significant correlation between the magnitude of tendon hypertrophy and reduced Young's modulus seen in the present study suggests that tendon hypertrophy is not directly related to the reduced stiffness. Changes in the structure and packing of the collagen fibers (8), such as loss of transverse bands of collagen fiber (24), increased collagen fiber crimping (25), and reduction in the covalent intramolucular cross-links (3), are generally considered to be a factor in the alteration of tendon material properties.
Difference in the stiffness between Achilles tendon and distal aponeurosis.
Tissue velocity measures of the Achilles tendon and distal aponeurosis using VE-PC MRI enable us to estimate the Young's modulus during a submaximal contraction. One of the strengths of this technique compared with ultrasound technique is that it allows one to visualize the entire length of the aponeurosis, tendon, and even calcaneus. This allowed us to compare the stiffness between different tendinous tissues such as Achilles tendon and even regional differences along the aponeurosis.
Comparisons of stiffness between the tendon and aponeurosis are quite common (10, 18, 19, 26, 29, 34). Recent MRI studies have repeatedly shown regional differences in aponeurosis strain in the human soleus and gastrocnemius aponeuroses with the surprising and counter-intuitive observation that some regions of the aponeuroses of contracting muscles shorten under load (11, 13). Finite element simulations confirm these findings and suggest that the passive aponeurosis material and nearby contracting muscle fibers behave as a composite material in which local mechanical properties may be quite different from the properties of the individual constituent materials (6). Thus measures of aponeurosis stiffness must be interpreted with caution. However, they provide a good comparison with previous work (10, 18, 19, 26, 29, 34). The simulations also demonstrate that the local aponeurosis response in an isometric contraction is dependent on muscle fiber pennation angle, where aponeurosis shortening increases with smaller pennation angles. Our data suggest a modest increase in distal aponeurosis shortening following ULLS, although it failed to reach statistical significance. It is therefore consistent with the model prediction but fails to provide a definitive answer.
Muscle, fiber, and tendon length changes.
Slight shortening of the tendon and aponeurosis may reflect a lower passive tension in the muscle following atrophy. Changes in the stress/strain curves reported in this publication are consistent with our previous findings showing a decrease in tendon stiffness and a shift of the stress/strain curve to the right (30). A simple geometric model of the changes that occur following atrophy suggests that muscle fiber resting length will decrease simply as a consequence of a slimmer muscle (Fig. 10). This shortening of the muscle fibers will decrease the passive tension in the fibers and, therefore, of the whole muscle. We would expect this to be reflected as a shortening of the aponeuroses and tendon due to the lower passive force allowing them to shorten along their stress-strain curves. This would manifest as a rightward shift of the tendon observed stress/strain curve following atrophy (30). The shorter muscle fibers, shorter tendons, and lower tendon stiffness would also result in a leftward shift of the length-tension curve of the muscle fiber, causing a decline in force production for a given fiber shortening (42). Thus, in addition to the reduced force potential due to decreased muscle mass, the changes in atrophic muscle geometry may have a significant deleterious impact on the ability of the muscle to generate force.
Fig. 10.
Schematic diagram of the overall structure and distribution of an aponeurosis of origin, muscle, and aponeurosis of insertion before and after atrophy. The vertical black lines represent the aponeuroses of a muscle before atrophy. The vertical grey line shows the position change of the right aponeurosis after atrophy. If we make an initial simplifying assumption that the tendon and aponeurosis lengths remain constant, the proximo-distal coordinates (yo, yi, and yi′) should remain constant since the distance to the origin and insertion of tendons should remain the same. Due to thinning of the atrophic muscle, the separation of aponeuroses will decrease, thus moving the xi′ coordinate closer to xo. The atrophic muscle fiber length must therefore be shorter due to simple geometry. Not shown is that the decrease in passive force in the shorter fibers may also result in slight shortening of tendon and aponeuroses as a result of lower passive tension.
In conclusion, 4 wk of ULLS resulted in an increase in tendon volume but a decrease in Young's modulus. The magnitude of tendon hypertrophy was not correlated to the degree of reduced tendon stiffness, indicating that the change in tendon elastic properties could not be attributable to tendon volume and thus implies a role for a change in material properties.
GRANTS
This study was supported by the National Space Biomedical Research Institute (grant no. NCC9-58) and National Institute of Arthritis and Musculoskeletal and Skin Diseases Grant RO1-AR-53343.
DISCLOSURES
No conflicts of interest, financial or otherwise, are declared by the author(s).
ACKNOWLEDGMENTS
The authors thank all the participating subjects in the study.
REFERENCES
- 1. Ahmed IM, Lagopoulos M, McConnell P, Soames RW, Sefton GK. Blood supply of the Achilles tendon. J Orthop Res 16: 591–596, 1998 [DOI] [PubMed] [Google Scholar]
- 2. Almeida-Silveira MI, Lambertz D, Perot C, Goubel F. Changes in stiffness induced by hindlimb suspension in rat Achilles tendon. Eur J Appl Physiol 81: 252–257, 2000 [DOI] [PubMed] [Google Scholar]
- 3. Bailey AJ. Molecular mechanisms of ageing in connective tissues. Mech Ageing Dev 122: 735–755, 2001 [DOI] [PubMed] [Google Scholar]
- 4. Berg HE, Dudley GA, Haggmark T, Ohlsen H, Tesch PA. Effects of lower limb unloading on skeletal muscle mass and function in humans. J Appl Physiol 70: 1882–1885, 1991 [DOI] [PubMed] [Google Scholar]
- 5. Binkley JM, Peat M. The effects of immobilization on the ultrastructure and mechanical properties of the medial collateral ligament of rats. Clin Orthop Relat Res 203: 301–308, 1986 [PubMed] [Google Scholar]
- 6. Chi SW, Hodgson JA, Chen JS, Edgerton VR, Shin DD, Roiz RA, Sinha S. Finite element modeling reveals complex strain mechanics in the aponeuroses of contracting skeletal muscle. J Biomech 43: 1243–1250, 2010 [DOI] [PMC free article] [PubMed] [Google Scholar]
- 7. Christensen B, Dyrberg E, Aagaard P, Kjaer M, Langberg H. Short-term immobilization and recovery affect skeletal muscle but not collagen tissue turnover in humans. J Appl Physiol 105: 1845–1851, 2008 [DOI] [PubMed] [Google Scholar]
- 8. Danielsen CC, Andreassen TT. Mechanical properties of rat tail tendon in relation to proximal-distal sampling position and age. J Biomech 21: 207–212, 1988 [DOI] [PubMed] [Google Scholar]
- 9. de Boer MD, Maganaris CN, Seynnes OR, Rennie MJ, Narici MV. Time course of muscular, neural and tendinous adaptations to 23 day unilateral lower-limb suspension in young men. J Physiol 583: 1079–1091, 2007 [DOI] [PMC free article] [PubMed] [Google Scholar]
- 10. Delgado-Lezama R, Raya JG, Munoz-Martinez EJ. Methods to find aponeurosis and tendon stiffness and the onset of muscle contraction. J Neurosci Methods 78: 125–132, 1997 [DOI] [PubMed] [Google Scholar]
- 11. Finni T, Hodgson JA, Lai AM, Edgerton VR, Sinha S. Nonuniform strain of human soleus aponeurosis-tendon complex during submaximal voluntary contractions in vivo. J Appl Physiol 95: 829–837, 2003 [DOI] [PubMed] [Google Scholar]
- 12. Heinemeier KM, Olesen JL, Haddad F, Schjerling P, Baldwin KM, Kjaer M. Effect of unloading followed by reloading on expression of collagen and related growth factors in rat tendon and muscle. J Appl Physiol 106: 178–186, 2009 [DOI] [PubMed] [Google Scholar]
- 13. Kinugasa R, Shin D, Yamauchi J, Mishra C, Hodgson JA, Edgerton VR, Sinha S. Phase-contrast MRI reveals mechanical behavior of superficial and deep aponeuroses in human medial gastrocnemius during isometric contraction. J Appl Physiol 105: 1312–1320, 2008 [DOI] [PMC free article] [PubMed] [Google Scholar]
- 14. Kotani Y, Cunningham BW, Cappuccino A, Kaneda K, McAfee PC. The effects of spinal fixation and destabilization on the biomechanical and histologic properties of spinal ligaments. An in vivo study. Spine (Phila Pa 1976) 23: 672–683, 1998 [DOI] [PubMed] [Google Scholar]
- 15. Kubo K, Akima H, Ushiyama J, Tabata I, Fukuoka H, Kanehisa H, Fukunaga T. Effects of resistance training during bed rest on the viscoelastic properties of tendon structures in the lower limb. Scand J Med Sci Sports 14: 296–302, 2004 [DOI] [PubMed] [Google Scholar]
- 16. Kubo K, Kawakami Y, Kanehisa H, Fukunaga T. Measurement of viscoelastic properties of tendon structures in vivo. Scand J Med Sci Sports 12: 3–8, 2002 [DOI] [PubMed] [Google Scholar]
- 17. Lee HD, Finni T, Hodgson JA, Lai AM, Edgerton VR, Sinha S. Soleus aponeurosis strain distribution following chronic unloading in humans: an in vivo MR phase-contrast study. J Appl Physiol 100: 2004–2011, 2006 [DOI] [PubMed] [Google Scholar]
- 18. Maganaris CN, Paul JP. Load-elongation characteristics of in vivo human tendon and aponeurosis. J Exp Biol 203: 751–756, 2000 [DOI] [PubMed] [Google Scholar]
- 19. Magnusson SP, Hansen P, Aagaard P, Brond J, Dyhre-Poulsen P, Bojsen-Moller J, Kjaer M. Differential strain patterns of the human gastrocnemius aponeurosis and free tendon, in vivo. Acta Physiol Scand 177: 185–195, 2003 [DOI] [PubMed] [Google Scholar]
- 20. Magnusson SP, Narici MV, Maganaris CN, Kjaer M. Human tendon behaviour and adaptation, in vivo. J Physiol 586: 71–81, 2008 [DOI] [PMC free article] [PubMed] [Google Scholar]
- 21. Matsumoto F, Trudel G, Uhthoff HK, Backman DS. Mechanical effects of immobilization on the Achilles' tendon. Arch Phys Med Rehabil 84: 662–667, 2003 [DOI] [PubMed] [Google Scholar]
- 22. Nakagawa Y, Totsuka M, Sato T, Fukuda Y, Hirota K. Effect of disuse on the ultrastructure of the achilles tendon in rats. Eur J Appl Physiol Occup Physiol 59: 239–242, 1989 [DOI] [PubMed] [Google Scholar]
- 23. Narici MV, Maganaris CN, Reeves ND, Capodaglio P. Effect of aging on human muscle architecture. J Appl Physiol 95: 2229–2234, 2003 [DOI] [PubMed] [Google Scholar]
- 24. Paavola M, Kannus P, Jarvinen TA, Khan K, Jozsa L, Jarvinen M. Achilles tendinopathy. J Bone Joint Surg Am 84: 2062–2076, 2002 [DOI] [PubMed] [Google Scholar]
- 25. Patterson-Kane JC, Wilson AM, Firth EC, Parry DA, Goodship AE. Comparison of collagen fibril populations in the superficial digital flexor tendons of exercised and nonexercised thoroughbreds. Equine Vet J 29: 121–125, 1997 [DOI] [PubMed] [Google Scholar]
- 26. Rack PM, Westbury DR. Elastic properties of the cat soleus tendon and their functional importance. J Physiol 347: 479–495, 1984 [DOI] [PMC free article] [PubMed] [Google Scholar]
- 27. Reeves ND, Maganaris CN, Ferretti G, Narici MV. Influence of 90-day simulated microgravity on human tendon mechanical properties and the effect of resistive countermeasures. J Appl Physiol 98: 2278–2286, 2005 [DOI] [PubMed] [Google Scholar]
- 28. Schulze K, Gallagher P, Trappe S. Resistance training preserves skeletal muscle function during unloading in humans. Med Sci Sports Exerc 34: 303–313, 2002 [DOI] [PubMed] [Google Scholar]
- 29. Scott SH, Loeb GE. Mechanical properties of aponeurosis and tendon of the cat soleus muscle during whole-muscle isometric contractions. J Morphol 224: 73–86, 1995 [DOI] [PubMed] [Google Scholar]
- 30. Shin D, Finni T, Ahn S, Hodgson JA, Lee HD, Edgerton VR, Sinha S. Effect of chronic unloading and rehabilitation on human Achilles tendon properties: a velocity-encoded phase-contrast MRI study. J Appl Physiol 105: 1179–1186, 2008 [DOI] [PMC free article] [PubMed] [Google Scholar]
- 31. Shin D, Finni T, Ahn S, Hodgson JA, Lee HD, Edgerton VR, Sinha S. In vivo estimation and repeatability of force-length relationship and stiffness of the human achilles tendon using phase contrast MRI. J Magn Reson Imaging 28: 1039–1045, 2008 [DOI] [PMC free article] [PubMed] [Google Scholar]
- 32. Siegel S, Castellan NJ., Jr Nonparametric Statistics for the Behavioral Sciences. New York: McGraw-Hill, 1988 [Google Scholar]
- 33. Sinha S, Hodgson JA, Finni T, Lai AM, Grinstead J, Edgerton VR. Muscle kinematics during isometric contraction: development of phase contrast and spin tag techniques to study healthy and atrophied muscles. J Magn Reson Imaging 20: 1008–1019, 2004 [DOI] [PubMed] [Google Scholar]
- 34. Trestik CL, Lieber RL. Relationship between Achilles tendon mechanical properties and gastrocnemius muscle function. J Biomech Eng 115: 225–230, 1993 [DOI] [PubMed] [Google Scholar]
- 35. Tsuchida T, Yasuda K, Kaneda K, Hayashi K, Yamamoto N, Miyakawa K, Tanaka K. Effects of in situ freezing and stress-shielding on the ultrastructure of rabbit patellar tendons. J Orthop Res 15: 904–910, 1997 [DOI] [PubMed] [Google Scholar]
- 36. Voigt M. Muscle-Tendon Elasticity In Vivo and Its Significance for Human Perfomance. Copenhagen: University of Copenhagen, 1994 [Google Scholar]
- 37. Zajac FE. Muscle and tendon: properties, models, scaling, and application to biomechanics and motor control. Crit Rev Biomed Eng 17: 359–411, 1989 [PubMed] [Google Scholar]


