

Summary
The mechanism underpinning chloroquine drug resistance in the human malarial parasite Plasmodium falciparum has remained controversial. Currently discussed models include a carrier or a channel for chloroquine, the former actively expelling the drug, the latter facilitating its passive diffusion, out of the parasite’s food vacuole, where chloroquine accumulates and inhibits haem detoxification. Here we have challenged both models using an established trans-stimulation efflux protocol. While carriers may demonstrate trans-stimulation, channels do not. Our data reveal that extracellular chloroquine stimulates chloroquine efflux in the presence and absence of metabolic energy in both chloroquine-sensitive and -resistant parasites, resulting in a hyperbolic increase in the apparent initial efflux rates as the concentration of external chloroquine increases. In the absence of metabolic energy, the apparent initial efflux rates were comparable in both parasites. Significant differences were only observed in the presence of metabolic energy, where consistently higher apparent initial efflux rates were found in chloroquine-resistant parasites. As trans-stimulation is characteristic of a carrier, and not a channel, we interpret our data in favour of a carrier for chloroquine being present in both chloroquine-sensitive and -resistant parasites, however, with different transport modalities.
Introduction
Following the introduction of chloroquine as a first-line antimalarial drug in the late 1950s, malaria-related mortality among children declined by almost 50% in endemic areas (Carter and Mendis, 2002). The ground gained in the campaign against malaria was all but lost when chloroquine resistance emerged in the field. Today, chloroquine-resistant (CQR) Plasmodium falciparum parasites are widespread. Due to a paucity of suitable replacement drugs, malaria has increased to an unprecedented 515 million clinical cases and more than one million deaths annually (Carter and Mendis, 2002; Snow et al., 2005).
In its mode of action, chloroquine exploits a unique biochemical pathway of the parasite. During intraerythrocytic development, P. falciparum degrades haemoglobin of the host erythrocyte to meet its nutrient requirements and to counteract osmotic imbalances resulting from its own anabolic activity (Lew et al., 2003). The haem released in this process is mineralized to inert hemozoin in the parasite’s acidic food vacuole (Egan et al., 2002; Fitch, 2004). Chloroquine, which accumulates in this organelle (Yayon et al., 1984; Fitch, 2004), is thought to prevent haem bio-mineralization (Chou et al., 1980; Yayon et al., 1984; Dorn et al., 1998; Leed et al., 2002; De Dios et al., 2003; Fitch, 2004) by forming cytotoxic complexes with haem that are lipophilic and that eventually kill the parasite by perforating cellular membranes (Fitch et al., 1982; 1983). CQR P. falciparum parasites accumulate substantially less chloroquine (Fitch, 1970; 1973), apparently keeping their intracellular chloroquine concentration below toxic levels.
The consensus of evidence indicates that chloroquine resistance is linked with polymorphisms within the food vacuolar membrane protein PfCRT (Fidock et al., 2000; Djimde et al., 2001; Cooper et al., 2002; Sidhu et al., 2002; Lakshmanan et al., 2005). How PfCRT mediates reduced chloroquine accumulation and, hence, the chloroquine resistance phenotype has remained controversial. PfCRT groups with the drug/metabolite transporter superfamily (Martin and Kirk, 2004; Tran and Saier, 2004), which includes carriers that are capable of transporting weak bases and/or divalent organic cations in co- or counter-transport. Accordingly, it has been suggested that the PfCRT associated with chloroquine resistance acts as an active efflux carrier of chloroquine (Fidock et al., 2000; Cooper et al., 2002; Zhang et al., 2004; Naude et al., 2005; Sanchez et al., 2005). This concept is consistent with trans-stimulation kinetics, which showed that pre-loaded intracellular chloroquine stimulated the maximal level of chloroquine uptake from the external medium in CQR parasites (Sanchez et al., 2003; 2005). Stimulated chloroquine uptake was inhibited by verapamil (Sanchez et al., 2004), and was causatively linked to the PfCRT polymorphisms associated with chloroquine resistance (Sanchez et al., 2005).
Contrasting with the proposed carrier model, other studies have suggested that the CQR PfCRT protein acts as a voltage-gated channel facilitating the passive diffusion of protonated chloroquine down its concentration gradient and out of the food vacuole (Warhurst et al., 2002; Zhang et al., 2004; Bray et al., 2006). The channel model was evoked to explain why energy deprivation or uncoupling the food vacuolar proton gradient had no effect on the rate of chloroquine efflux from CQR parasites (Bray et al., 2006). In all cases, chloroquine efflux was rapid.
Consistent with both a carrier and a channel model, a recent study has shown that Dictyostelium discoideum, expressing CQR PfCRT in acidic vesicles, exhibited reduced chloroquine accumulation in a verapamil-sensitive manner, as compared with untransfected controls or slime moulds expressing the wild-type pfcrt allele (Naude et al., 2005). There is further evidence for chloroquine binding to PfCRT (Zhang et al., 2004) and PfCRT was shown to affect chloroquine accumulation in reconstituted proteoliposomes (Tan et al., 2006). To differentiate between the carrier and the channel model, we have now investigated the kinetics of chloroquine efflux under ‘reverse varying-trans’ conditions (Stein, 1986). This procedure investigates whether extracellular unlabelled chloroquine would stimulate the release of pre-loaded labelled chloroquine. If chloroquine moves across a membrane via a carrier, one would expect trans-stimulated chloroquine efflux, i.e. trans chloroquine should increase the apparent initial efflux rate (Stein, 1986). Facilitated diffusion through a conventional pore or channel does not demonstrate trans-stimulation, because movements in different directions within a pore or channel block rather than enhance one another (Keynes and Lewis, 1950; Dani and Levitt, 1981; Stein, 1986). Here we demonstrate trans-stimulated chloroquine efflux in CQR parasites in the presence and absence of metabolic energy. Unexpectedly, trans-stimulated chloroquine efflux was also observed in chloroquine-sensitive (CQS) parasites, but with kinetics differing from that of CQR parasites. These data suggest that both CQS and CQR parasites possess a carrier of chloroquine, however, with different transport modalities.
Results
Differences in chloroquine efflux kinetics between CQS and CQR parasites
Figure 1A depicts the time-courses of pre-loaded [3H]-chloroquine efflux from the CQS P. falciparum clone HB3 (chloroquine IC50 = 16.0 ± 1.0 nM) (closed symbols in this and all subsequent figures) and the CQR clone Dd2 (chloroquine IC50 = 137 ± 11.0 nM) (open symbols in this and all subsequent figures), over 10 min. The y-axis in this and the subsequent similar figures represents the amount of labelled chloroquine that is still remaining within the parasites at the time indicated on the x-axis. To account for the different chloroquine accumulation ratios of the two parasites, HB3 and Dd2 were incubated with different concentrations of labelled chloroquine (20 nM and 100 nM respectively). These concentrations were empirically determined to ensure comparable intracellular drug concentrations at the end of the pre-loading phase (data not shown). The labelled chloroquine was rapidly released from the CQR parasite, but slowly from the CQS parasite, with rates of 0.55 ± 0.06 min−1 and 0.09 ± 0.04 min−1 respectively (Table 1). This observation confirms the original findings of Krogstad et al. (1987) and the recent reports from Bray et al. (2006).
Fig. 1.

Time-courses of chloroquine efflux from P. falciparum-infected erythrocytes pre-loaded with [3H]-chloroquine. A and B. In the presence of glucose: HB3 (closed circles), Dd2 (open circles) with (A) in the absence and (B) in the presence of 10 μM verapamil added at time t0 to the assay. C and D. Using glucose-deprived cells: (C) HB3 (closed triangles); Dd2 (open triangles); no verapamil added. (D) HB3 (closed triangles); Dd2 (open triangles); with 10 μM verapamil added at time t0 to the assay. The means ± SEM of at least three independent determinations are shown. The data points in this and the following figures were fitted using a simple exponential decline and the rate constants compiled in Table 1.
Table 1.
Apparent initial chloroquine efflux rates from various P. falciparum parasites in glucose-rich (Glu) or glucose-free medium (replaced by an equivalent amount of 2-deoxyglucose, 2DG), and in the presence and absence of 10 μM verapamil (Ver).
| Parasite | Glu |
2DG |
||
|---|---|---|---|---|
| −Ver (min−1) | +Ver (min−1) | −Ver (min−1) | +Ver (min−1) | |
| Dd2 (CQR) | 0.55 ± 0.06* (5) | 0.08 ± 0.01 (4) | 0.23 ± 0.03** (3) | 0.25 ± 0.03** (3) |
| HB3 (CQS) | 0.09 ± 0.04 (9) | 0.08 ± 0.01 (3) | 0.28 ± 0.02** (3) | 0.31 ± 0.03** (3) |
| N3D6 (CQS) | 0.04 ± 0.01 (3) | 0.07 ± 0.01 (3) | 0.34 ± 0.07** (3) | 0.36 ± 0.09** (3) |
The means ± SEM of n independent determinations are shown.
P < 0.01, with HB3 as a reference;
P < 0.01 between rates determined in the presence and absence of glucose.
The above experiments were performed using HEPES-buffered media. We repeated the study using a CO2/bicarbonated buffer system and atmospheric conditions of 5% CO2 and 5% O2, used for in vitro culture of the parasite (Trager and Jensen, 1976) and resembling the partial gas pressures present in venular capillaries where parasitized erythrocytes adhere. Again, pre-loaded chloroquine was rapidly released from Dd2, but slowly from HB3, with rates of 0.54 ± 0.05 min−1 and 0.09 ± 0.03 min−1 respectively (Fig. S1). As the phenomena and rates were independent of the buffering system of the media in which experiments were performed, we conducted all subsequent kinetic studies using HEPES-buffered media.
The addition of 10 μM verapamil to the assay at t0 (the time at which efflux commenced, i.e. the cells were transferred to the external medium) eliminated the difference in chloroquine efflux rates between the two parasites (Fig. 1B), consistent with previous reports (Krogstad et al., 1987; Bray et al., 2006) (Fig. S2 further explores this effect by examining different verapamil concentrations). In control experiments, we investigated whether verapamil exerts a cytotoxic effect during the 10 min time-course of the efflux studies. Erythrocytes infected with trophozoites of HB3 and Dd2 were exposed to verapamil concentrations ranging from 0 to 100 μM for 10 min, washed and then returned to culture for 48 h (with [3H]-hypoxanthine added for the full duration). Verapamil-treated and untreated parasites showed no difference in growth (Fig. S3), suggesting that P. falciparum can tolerate short-term exposure to high concentrations of verapamil.
When the efflux experiments were repeated using glucose-deprived cells (replacing glucose by an equal amount of 2-deoxyglucose), the differences in efflux kinetics between HB3 and Dd2 vanished (Fig. 1C), consistent with previous reports (Bray et al., 2006). Chloroquine was rapidly released from both HB3 and Dd2, with rates of 0.28 ± 0.02 min−1 and 0.23 ± 0.03 min−1 respectively (Table 1). Addition of verapamil (10 μM) to the assay at t0 had no apparent effect on the chloroquine efflux kinetics from glucose-deprived cells of either parasite (compare Fig. 1C and D and Table 1). The efflux experiments were performed under conditions where both HB3 and Dd2 parasites accumulated comparable levels of pre-loaded labelled chloroquine at t0. This involved pre-incubation in medium containing 40 nM [3H]-chloroquine for both parasites.
Previous studies have suggested that parasites deprived of glucose can no longer maintain their intracellular ATP pool (Sherman, 1998), resulting in a breakdown of intracellular ion gradients, including the pH gradient across the food vacuolar membrane (Saliba and Kirk, 1999; Saliba et al., 2003). Under the glucose-deprived conditions employed in this study (10 min of incubation in glucose-free medium), parasites are indeed unable to maintain an acidified food vacuole, as demonstrated by their inability to accumulate the acidotropic fluorochrome LysoSensor Blue DND-192 (LS Blue) in this organelle (Fig. 2A and B) (Wissing et al., 2002; Rohrbach et al., 2005; Sanchez et al., 2005). Furthermore, ATP levels were substantially reduced in both HB3 and Dd2 parasites (Fig. 2C). Addition of glucose (after 10 min of incubation in glucose-free medium) established both intracellular ATP levels and food vacuolar LS Blue accumulation within 6 min (6 min data points in Fig. 2), indicating that the cells remain viable within the 10 min time frame of the efflux experiments, despite lacking metabolic energy.
Fig. 2.
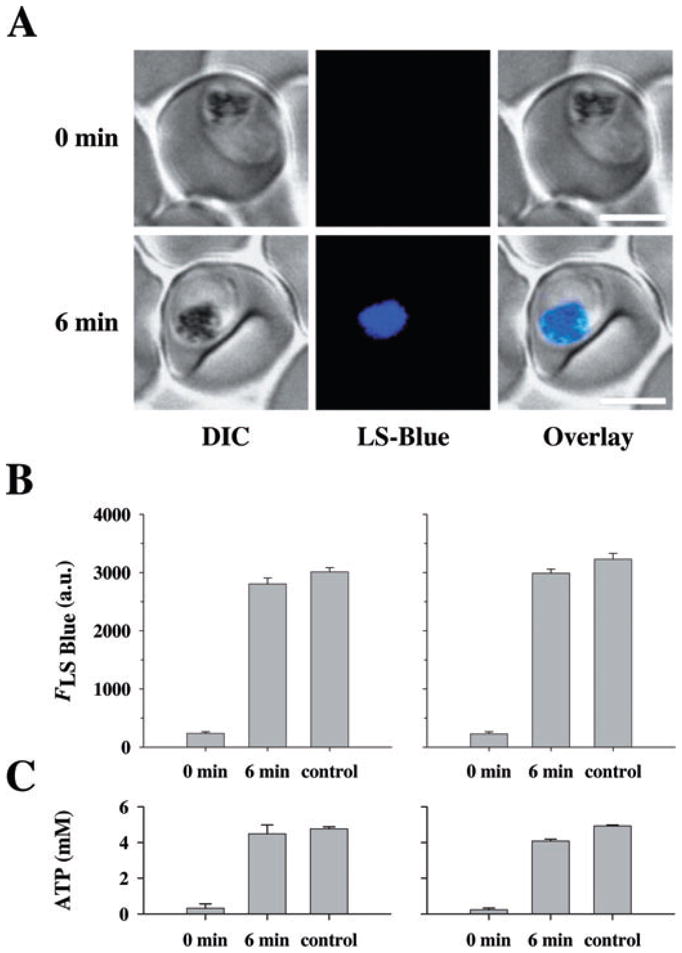
Effect of glucose deprivation on LS Blue fluorescence and intracellular ATP. A. Erythrocytes infected with the CQS parasite HB3 were perfused with glucose-free medium containing the qualitative pH indicator LS Blue. At t0, glucose was added to the medium (final concentration 11 mM). Confocal images taken just prior to and 6 min after the addition of glucose are shown. LS Blue accumulates in the food vacuole resulting in a bright fluorescence arising from this organelle (here shown in blue). Images are also available for Dd2, but are not shown in this figure. Bar, 5 μm.
B. Quantification of food vacuolar LS Blue fluorescence (FLS Blue), provided as arbitrary units (a.u.), before and 6 min after the addition of glucose to the medium. Control indicates food vacuolar LS Blue fluorescence intensities determined for cells held in glucose-supplemented medium during the entire duration of the experiments. Left panel, HB3; right panel, Dd2. The means ± SEM are shown for 30 or more determinations.
C. The intracellular ATP concentration was measured before and 6 min after the addition of glucose to the medium. The ATP concentration of control cells held in glucose-rich medium during the entire duration of the experiment is shown for comparison. Left panel, HB3; right panel, Dd2. The means ± SEM are shown for at least four independent determinations.
Chloroquine efflux under ‘reverse varying-trans’ conditions
We next investigated the kinetics of chloroquine efflux using the established ‘reverse varying-trans’ protocol (Levine et al., 1965; Baker and Widdas, 1973; Ribbes et al., 1985; Jarvis, 1986; Stein, 1986; Byers et al., 1990; Zhou et al., 1992; Closs et al., 1993; Villalobos and Braun, 1998; Yabuuchi et al., 1999; Engel and Wang, 2005). To this end, cells incubated in glucose-rich media were preloaded with labelled chloroquine (see above) and then placed in medium containing 0, 0.025 μM (HB3 only), 0.1 μM or 1.0 μM cold chloroquine. The presence of extracellular chloroquine had a clear and concentration-dependent effect on the rate of labelled chloroquine efflux in both HB3 and Dd2 parasites (compare circles – no external chloroquine – with squares and triangles – with external chloroquine added, in each figure) bringing about a substantial increase in the release of label (Fig. 3A and B).
Fig. 3.

Chloroquine efflux kinetics under ‘reverse varying-trans’ conditions, in glucose-rich medium. P. falciparum-infected erythrocytes were pre-loaded with comparable amounts of [3H]-chloroquine, washed and placed in medium containing the following concentrations of cold chloroquine: 0.0 μM (circles), 0.025 μM (inverted triangles), 0.1 μM (squares), 1.0 μM (triangles).
A. CQS parasite HB3.
B. CQR parasite Dd2.
In both panels, the grey squares (0.1 μM external chloroquine) show the effect of addition of 10 μM verapamil at zero time (dotted line). The means ± SEM of at least three independent determinations are shown.
The addition of 10 μM verapamil to the assay at time t0 increased the amount of labelled chloroquine that was released in the presence of 0.1 μM trans-chloroquine in HB3 (compare closed with grey squares in Fig. 3A). In contrast, in the CQR parasite Dd2, verapamil significantly inhibited stimulated chloroquine efflux in the presence of 0.1 μM extracellular chloroquine (1.20 ± 0.06 min−1 versus 0.50 ± 0.04 min−1; compare open with grey squares in Fig. 3B).
Stimulation of labelled chloroquine efflux by extracellular chloroquine was also observed in the absence of metabolic energy. The presence of 0.1 μM and 1.0 μM cold chloroquine in the external medium (compare circles – no external chloroquine – with squares and triangles –with external chloroquine added, in each figure) stimulated pre-loaded chloroquine efflux from both HB3 and Dd2 parasites (Fig. 4A and B). Interestingly, the rates of labelled chloroquine efflux and the effects of added external chloroquine were comparable in both parasites under these conditions (Table 2 and Fig. 4). Stimulated chloroquine efflux was insensitive to 10 μM verapamil in glucose-deprived cells (compare open with grey squares in Fig. 4B).
Fig. 4.

Chloroquine efflux kinetics under ‘reverse varying-trans’ conditions, in glucose-free medium. P. falciparum-infected erythrocytes were pre-loaded with comparable amounts of [3H]-chloroquine, washed and placed in glucose-free medium (replacing glucose by an equal amount of 2-deoxyglucose) containing the following concentrations of cold chloroquine: 0.0 μM (circles), 0.1 μM (squares), 1.0 μM (triangles).
A. CQS parasite HB3.
B. CQR parasite Dd2.
The grey squares (0.1 μM external chloroquine) show the effect of addition of 10 μM verapamil at zero time (dotted line). The means ± SEM of at least three independent determinations are shown.
Table 2.
Apparent initial chloroquine efflux rates from various P. falciparum parasites under ‘reverse varying-trans’ conditions in glucose-rich (Glu) or glucose-free medium (replaced by an equivalent amount of 2-deoxyglucose, 2DG).
| Trans-CQ (μM) | HB3 |
Dd2 |
N3D6 |
|||
|---|---|---|---|---|---|---|
| Glu (min−1) | 2DG (min−1) | Glu (min−1) | 2DG (min−1) | Glu (min−1) | 2DG (min−1) | |
| 0 | 0.09 ± 0.04 | 0.28 ± 0.02 | 0.55 ± 0.06 | 0.23 ± 0.03 | 0.05 ± 0.01 | 0.34 ± 0.08 |
| 0.025 | 0.10 ± 0.07 | n.d. | n.d. | n.d. | n.d. | n.d. |
| 0.1 | 0.47 ± 0.11 | 0.95 ± 0.08 | 1.20 ± 0.06 | 0.97 ± 0.05 | 0.30 ± 0.08 | 1.01 ± 0.12 |
| 1.0 | 1.00 ± 0.03 | 4.40 ± 0.45 | 2.99 ± 0.32 | 4.88 ± 0.48 | 1.14 ± 0.08 | 4.62 ± 0.58 |
Trans-chloroquine (trans-CQ) refers to the concentration of chloroquine in the outside medium. The means ± SEM of at least three independent determinations are shown. n.d., not determined.
Association of chloroquine efflux kinetics with the PfCRT K76T mutation
To assess the contribution of PfCRT polymorphisms to the kinetics of chloroquine efflux, we investigated the previously described parasite clone N3D6 (Lakshmanan et al., 2005). N3D6 is isogenic to Dd2, with the exception that the N3D6 harbours a PfCRT T76K substitution, which was introduced by allelic exchange, leading to the restoration of the wild-type amino acid lysine. Unlike Dd2, N3D6 is susceptible to chloroquine (chloroquine IC50 = 17.0 ± 2.0 nM). In the presence of glucose, preloaded labelled chloroquine was slowly released from N3D6, with a rate of 0.04 ± 0.01 min−1, comparable to HB3 parasites assayed under similar conditions (Fig. 5A closed circles; Table 1; see Fig. 1A for comparison). The addition of 10 μM verapamil slightly increased chloroquine release from N3D6 (compare closed with grey circles in Fig. 5A). In the absence of glucose, chloroquine efflux was rapid and insensitive to 10 μM verapamil with a rate of 0.34 ± 0.07 min−1 (Fig. 5B, compare open with grey circles; Table 1). Extracellular chloroquine (at 0.1 μM, squares, and at 1.0 μM, triangles in Fig. 5A and B) substantially stimulated chloroquine efflux, both in the presence and absence of glucose, again similar to HB3 (Fig. 5A and B; Table 2).
Fig. 5.

Time-courses of chloroquine efflux from the CQS parasite N3D6 under ‘reverse varying-trans’ conditions. Chloroquine efflux experiments were performed under (A) glucose-rich or (B) glucose-deprived conditions. Cells were loaded with labelled chloroquine and placed in the appropriate medium containing the following concentrations of cold chloroquine: 0.0 μM (circles), 0.1 μM (squares), 1.0 μM (triangles). The zero-trans control was repeated in the presence of 10 μM verapamil (grey circles, dotted line). The means ± SEM of three independent determinations are shown.
Trans-chloroquine increased apparent initial rates of chloroquine efflux
To better assess the effect of external chloroquine on chloroquine efflux, we plotted the apparent initial efflux rates as a function of the external chloroquine concentration (Fig. 6). In all cases, a hyperbolic relationship was found, with the efflux rates significantly increasing with each increment of external cold chloroquine added until a plateau was reached, as would be expected for a carrier-mediated process (Levine et al., 1965; Baker and Widdas, 1973; Ribbes et al., 1985; Jarvis, 1986; Stein, 1986; Byers et al., 1990; Zhou et al., 1992; Closs et al., 1993). In the absence of glucose (Fig. 6A), the curves are comparable for HB3 (closed circles), Dd2 (open circles) and N3D6 (closed inverted triangles), suggesting a common mechanism. Only in the presence of metabolic energy do the curves differ, with the CQR parasite Dd2 consistently displaying higher apparent initial efflux rates as compared with the CQS parasites HB3 and N3D6 (Fig. 6B).
Fig. 6.

Apparent initial rates of chloroquine efflux as a function of the external cold chloroquine concentration under ‘reverse varying-trans’ conditions. Apparent initial rates were directly computed from the relevant efflux curves of Figs 3–5, as described in Experimental procedures. CQS parasite HB3, closed circles; CQR parasite Dd2, open circles; CQS parasite N3D6, inverted closed triangles.
A. Glucose-deprived cells.
B. Glucose-supplemented cells.
The lines drawn are best-fits to the three-parameter hyperbolic algorithm using the SigmaPlot software.
Discussion
The key finding of our study is that extracellular chloroquine can stimulate the efflux of pre-loaded chloroquine from both CQS and CQR parasites in the presence and absence of metabolic energy. As parasites deprived of glucose can no longer maintain their intracellular ATP pool (Fig. 2C) (Sherman, 1998) or the pH gradient across the food vacuolar membrane (Fig. 2) (Saliba and Kirk, 1999; Saliba et al., 2003), the stimulation effect cannot be explained by incoming cold chloroquine titrating the intra-food vacuolar protons, which in turn would lead to rapid release of labelled pre-loaded chloroquine. Could stimulated chloroquine efflux result from a displacement effect? In vitro experiments have shown that the addition of cold chloroquine can release labelled chloroquine from parasite-derived cell debris containing haem, hemozoin and other components, such as nucleic acids, membranes and proteins, to which chloroquine can bind at the pH of 7.4 used in the cited study (Bray et al., 1998). In vivo, however, both CQS and CQR parasites have a high chloroquine binding capacity of approximately 30 μmol per litre parasite volume (Bray et al., 1998; Sanchez et al., 2003), which does not seem to be saturated under the experimental conditions used in this study. Pre-equilibrating parasites with 100 nM of cold chloroquine (a trans-chloroquine concentration revealing stimulated efflux, Figs 3–5) followed, after washing, by an incubation with 40 nM of labelled chloroquine (a concentration used for pre-loading in the efflux studies) showed no significant differences in the amount of label taken up by CQS parasites as compared with control cells that had not been pre-equilibrated with unlabelled chloroquine (Sanchez et al., 2003; 2005). In CQR parasites, the accumulation of labelled chloroquine was even increased under these conditions (Sanchez et al., 2003; 2005) (see below for further discussion). On the basis of these results, we do not favour the hypothesis that stimulated efflux is due to incoming cold chloroquine displacing labelled chloroquine from haem binding sites.
The observed increase in the apparent initial efflux rates, with its hyperbolic dependence on the concentration of external chloroquine (Fig. 6), is instead indicative of trans-stimulation (Baker and Widdas, 1973; Ribbes et al., 1985; Jarvis, 1986; Stein, 1986; Byers et al., 1990; Zhou et al., 1992; Closs et al., 1993; Villalobos and Braun, 1998; Yabuuchi et al., 1999; Engel and Wang, 2005). Trans-stimulation is an intrinsic characteristic of a carrier and is generally explained by substrates in trans re-orienting the carrier such that the transport cycle and the cis- to trans-movement of substrate is accelerated (Stein, 1986). On the basis of these data, we propose that both CQS and CQR parasites possess a carrier of chloroquine, but with different transport properties, as will be discussed below.
Chloroquine is a diprotic, amphiphilic weak base that accumulates in the parasite’s food vacuole, driven by acidotropic trapping (Yayon et al., 1984; 1985) and binding to haem (Chou et al., 1980; Bray et al., 1998). Considering a steady-state food vacuolar pH value of approximately 4.9–5.2 (Yayon et al., 1984; Krogstad et al., 1985; Hayward et al., 2006; Kuhn et al., 2007), chloroquine would accumulate up to 20 000-fold, assuming simple passive diffusion of the free base and a membrane impermeable to both mono- and di-protonated chloroquine. In CQS parasites, chloroquine can indeed accumulate to such levels [calculating using a volume of 4 fl and 75 fl for the food vacuole (Sullivan et al., 1996) and the trophozoite-infected erythrocyte (Saliba et al., 1998) respectively, and a cellular accumulation ratio of 1200-fold (Bray et al., 1998; 2006; Sanchez et al., 2003)].
Applying the simple partitioning model, an increased food vacuolar pH value, which once was considered a model of chloroquine resistance (Yayon et al., 1984), could explain the rapid chloroquine efflux associated with CQR parasites (under zero-trans conditions and in the presence of metabolic energy). As less chloroquine is protonated at a higher pH, more chloroquine base is available and will flow out of the food vacuole and the cell by passive diffusion across cellular membranes. However, two independent studies have recently quantified the steady-state pH of the food vacuole and found no significant differences between CQS and CQR parasites (Hayward et al., 2006; Kuhn et al., 2007). Other studies have reported food vacuolar pH values that, paradoxically, are lower in CQR than in CQS parasites (Dzekunov et al., 2000; Bennett et al., 2004). These data are difficult to reconcile with the recent food vacuolar pH measurements (Hayward et al., 2006; Kuhn et al., 2007) and, furthermore, are inconsistent with our efflux studies. According to the simple partitioning model, at a lower pH, more chloroquine is present in its protonated forms and less as free base. This would result in a reduced chloroquine efflux, as compared with CQS parasites, which is contrary to the actual findings (Fig. 1). Thus, altered food vacuolar pH cannot explain the rapid chloroquine efflux observed in CQR parasites.
Alternatively, differences in haem binding kinetics brought about by altered haem bio-mineralization and/or turn over rates (Dzekunov et al., 2000; Ursos et al., 2001; Ursos and Roepe, 2002) or the acquisition of a haem binding protein (Bray et al., 1998) could account for the rapid chloroquine efflux in CQR parasites. If differences in haem binding kinetics existed, one might expect CQR parasites to take up less chloroquine, irrespective of the presence of metabolic energy or a standing trans-food vacuolar pH gradient. However, this is contrary to the experimental findings. In this and other studies, it has been shown that CQR and CQS parasites accumulate comparable amounts of chloroquine in the absence of glucose (Fig. 3) (Krogstad et al., 1992; Sanchez et al., 2003; 2004; Bray et al., 2006) or in the presence of the ionophore FCCP (Bray et al., 2006), which dissipates proton gradients.
Additional evidence argues against altered haem binding or haem bio-mineralization kinetics being responsible for altered chloroquine accumulation and efflux. Naude et al. (2005) have recently transferred the key feature of chloroquine resistance, namely, reduced verapamil-sensitive chloroquine accumulation, to a haem-and hemozoin-free system, by expressing PfCRT in acidic vesicles of the amoeba Dictyostelium discoideum. Vesicles expressing the CQR PfCRT variant accumulated less chloroquine in a verapamil-sensitive manner than untransfected controls or vesicles containing wild-type PfCRT (Naude et al., 2005).
If the differences in chloroquine accumulation and efflux observed between CQS and CQR parasites do not arise from altered haem binding or drug partitioning, an alternative mechanism must be present. Proposed models include a carrier (Krogstad et al., 1987; Fidock et al., 2000; Sanchez et al., 2003; 2004; 2005; Naude et al., 2005) or a channel of chloroquine (Warhurst et al., 2002; Zhang et al., 2004; Bray et al., 2006).
In previous studies, we investigated the effect of trans-chloroquine on chloroquine accumulation and found that low concentrations of pre-loaded cold chloroquine was able to stimulate the chloroquine uptake maximum in CQR parasites (Sanchez et al., 2003; 2004; 2005). Consistent with established theorems in membrane transport, we explained this observation by the presence of a saturable carrier of chloroquine present in these parasites. If labelled chloroquine is being transported out of the food vacuole in the absence of pre-loaded chloroquine, this outward transport can be competed for by unlabelled chloroquine, present at the membrane face from which label is being transported. This evidence in favour of a carrier of chloroquine is corroborated by the finding of trans-stimulated efflux, in which extracellular chloroquine increased the apparent initial rate of chloroquine efflux in CQR parasites (Fig. 6). Trans-stimulated chloroquine efflux responded to verapamil in CQR parasites (Fig. 3B), indicating that the phenomenon is specific and not brought about by an increase in food vacuolar pH due to incoming chloroquine. Thus, transport experiments performed in the two vectorial directions (accumulation and efflux conditions) provide strong evidence for the presence of a carrier for chloroquine in CQR parasites.
Unexpectedly, CQS parasites also showed evidence of a carrier for chloroquine. Like in CQR parasites, extracellular chloroquine stimulated the apparent initial rates of pre-loaded chloroquine efflux in both the presence and absence of metabolic energy (Fig. 6), consistent with trans-stimulation of a carrier. Such trans-stimulation was clearly evident in one vectorial direction, under efflux (Fig. 6), and less obvious in accumulation conditions (Sanchez et al., 2003; 2005). The ‘varying-trans’ (accumulation) and the ‘reverse varying-trans’ (efflux) procedure producing different outcomes is not unusual, and has been demonstrated in many other carrier systems (Sen and Widdas, 1962; Hoare, 1972; Cabantchik and Ginsburg, 1977; Stein, 1986). It can be explained by different affinities of the carrier for the solute at the inner and outer face of the membrane (Sen and Widdas, 1962; Hoare, 1972; Cabantchik and Ginsburg, 1977; Stein, 1986). Circumstantial evidence indeed point towards a low-affinity carrier of chloroquine present in CQS parasites, as suggested by a comparative analysis of the time-courses of cellular chloroquine accumulation in the presence of preloaded chloroquine (Sanchez et al., 2003). For illustrative purposes, these time-courses are reproduced from Sanchez et al. (2003) (Fig. S4A). The time-courses show a rise and fall in both CQS and CQR parasites as the experiment proceeded, with the peaks of labelled chloroquine uptake greatly exceeding the steady-state level of chloroquine accumulation (Fig. S4A). This phenomenon is reminiscent of counter-transport, as originally defined by GLUT1-mediated glucose transport in human erythrocytes (Fig. S4B) (Baker and Widdas, 1973). As the time-courses are only comparable when substantially more chloroquine is pre-loaded in CQS parasites (1.22 ± 0.16 mM versus 0.021 ± 0.001 mM in CQR parasites), this would suggest that the carrier in CQS parasites has a lower affinity for chloroquine than CQR parasites.
The rapid chloroquine efflux revealed by CQR parasites under zero-trans conditions and in the presence of metabolic energy was causatively linked to the K76T polymorphism within PfCRT (Fig. 5). The Dd2 back-mutant N3D6 did not show this rapid efflux. N3D6 differs from Dd2 only in a single amino acid substitution within PfCRT, replacing the mutant threonine at position 76 with the wild-type lysine (Lakshmanan et al., 2005). This identifies PfCRT as a candidate for the chloroquine carrier.
Contrasting with the carrier model, Warhurst et al. (2002) and Bray et al. (2006) have proposed that PfCRT acts as a channel of chloroquine, allowing protonated chloroquine to passively flow down its concentration gradient and out of the food vacuole (Warhurst et al., 2002; Zhang et al., 2004; Bray et al., 2006). According to this model, the K76T mutation within PfCRT, which replaces a positively charged lysine with an uncharged threonine within the transmembrane domain 1, removes an electrostatic charge that prohibits protonated and hence, positively charged chloroquine from entering the channel (Warhurst et al., 2002; Zhang et al., 2004; Bray et al., 2006). Only when the positive charge is removed is the channel accessible to charged chloroquine (Warhurst et al., 2002; Zhang et al., 2004; Bray et al., 2006). This model was evoked to explain why, in the absence of metabolic energy or in the presence of the proton uncoupler FCCP, chloroquine efflux is equally rapid in both CQS and CQR parasites (Bray et al., 2006), as also shown in the present study (Fig. 4; Table 1). But an alternative explanation is possible: as glucose deprivation and the addition of FCCP both break down the food vacuolar pH gradient (Saliba and Kirk, 1999; Saliba et al., 2003), which is responsible for acidotropic trapping of chloroquine (Yayon et al., 1984; 1985), a far larger fraction of chloroquine will be unprotonated at the now neutral pH value. Accordingly, more chloroquine base is able to rapidly flow out of the cell by simple diffusion in both CQS and CQR parasites. Thus, the behaviour of chloroquine movement in the absence of metabolic energy or the presence of FCCP under zero-trans conditions does not differentiate between a carrier and a channel.
A distinguishing feature is the trans-stimulation kinetics that we have presented in this and previous studies (Sanchez et al., 2003; 2004; 2005). Facilitated diffusion through a conventional pore or channel does not demonstrate trans-stimulation, because movements in different directions within a pore or channel block rather than enhance one another (Keynes and Lewis, 1950; Dani and Levitt, 1981; Stein, 1986). On the other hand, trans-stimulation is indicative of a carrier-mediated process (Baker and Widdas, 1973; Ribbes et al., 1985; Jarvis, 1986; Stein, 1986; Byers et al., 1990; Zhou et al., 1992; Closs et al., 1993). As both CQS and CQR parasites revealed trans-stimulated chloroquine efflux, we propose that both parasites possess a carrier of chloroquine. In metabolically starved cells, the apparent initial efflux rates are comparable in both parasites (Fig. 6A), suggesting that the putative carriers have similar properties in the absence of metabolic energy. The carriers are insensitive to verapamil and resemble a simple reversible carrier. Because of distinct kinetic properties, it is unlikely that the proposed chloroquine carrier identifies with the erythrocyte plasma membrane chloroquine carrier described by Yayon and Ginsburg (1982). For example, the zero-trans apparent initial efflux rates differ approximately 20-fold [0.28 min−1 at 37°C (this study) versus 5.19 min−1 at 25°C (Yayon and Ginsburg, 1982)]. We therefore reason that the trans-stimulated chloroquine efflux observed in both CQS and CQR parasites, under glucose deprivation, relates to a carrier of parasite origin.
In the presence of metabolic energy the kinetic properties of the parasite-derived chloroquine carriers fundamentally differ between CQS and CQR parasites, as demonstrated by the differences in the apparent initial efflux rates (Fig. 6B). CQR parasites consistently revealed higher apparent initial efflux rates (Fig. 6B), suggesting a more efficient efflux carrier of chloroquine. Moreover, in CQR parasites, the carrier responds to verapamil in the presence of metabolic energy (Figs 1B and 3B), while the carrier in CQR parasites does not (Figs 1B and 3A).
Our model of a chloroquine carrier is consistent with PfCRT being a member of the drug/metabolite transporter superfamily (Martin and Kirk, 2004; Tran and Saier, 2004), which comprises secondary active co- and counter-transporters. The postulated carrier may transport either protonated chloroquine from the food vacuole’s interior or chloroquine base from the food vacuolar membrane (preemptive transport). The K76T transition in PfCRT may increase the affinity of the carrier for chloroquine (Fig. S4), or, alternatively, couple outward chloroquine transport to the proton-motive force. Verapamil may reverse these effects by substituting for the positively charged lysine when bound to PfCRT. Single amino acid changes can affect the linkage of a transport process to a secondary energy source, as demonstrated by the rabbit proton-peptide co-transporter PepT1 (Meredith, 2004) and the Escherichia coli Na+/proline co-transporter (Quick et al., 1999). Linking chloroquine efflux to the proton-motive force, generated by the trans-food vacuolar proton gradient, would explain the requirement of an energy input to reduce chloroquine accumulation in CQR parasites below levels observed in the absence of metabolic energy (Krogstad et al., 1992; Sanchez et al., 2003; 2004; Bray et al., 2006). This also explains the effect of the ionophore FCCP, which increases the levels of chloroquine accumulation in CQR parasites (Bray et al., 2006), suggesting that a standing pH gradient is required to drive out chloroquine. It is the trapping of charged chloroquine in the acidic food vacuole that we assert is overcome by the active, PfCRT-mediated transport process. Note, in the absence of metabolic energy there is no acidotropic trapping of chloroquine. The equilibrium of the different chloroquine forms is shifted from the membrane impermeable protonated forms to the now membrane permeable free base, which rapidly flows out of the cell. Thus, when comparing efflux rates, the pH of the food vacuole and its effect on the distribution of protonated versus unprotonated chloroquine need to be considered. The twofold increase in the apparent initial efflux rate from 0.23 ± 0.03 min−1 to 0.55 ± 0.06 min−1 in the absence and presence of metabolic energy in Dd2 parasites (Table 2) is consistent with our model. A carrier would require specific interactions with the solute it transports. The recently reported binding of PfCRT to chloroquine (Zhang et al., 2004) and the finding that selection to different antimalarial drugs causes sets of different point mutations within PfCRT (Fidock et al., 2000; Cooper et al., 2002; 2006; Sidhu et al., 2002; Ferdig et al., 2004; Johnson et al., 2004; Lakshmanan et al., 2005) fully accord with this view and our carrier model. In summary, our data provide strong evidence in favour of a PfCRT-mediated carrier of chloroquine being the basis of chloroquine resistance in P. falciparum.
Experimental procedures
Material
[3H]-chloroquine (18.8 Ci mmol−1), [3H]-hypoxanthine (17.9 Ci mmol−1) and NCS-II tissue solubilizer were supplied by Amersham Biosciences. Blasticidin was purchased from InvioGen. Chloroquine, 2-deoxyglucose and verapamil were from Sigma. Media were purchased from Invitrogen. The following media were used: (i) complete RPMI 1640; (ii) bicarbonate-free RPMI 1640; and (iii) glucose- and bicarbonate-free RPMI 1640. All media were supplemented with 25 mM HEPES-Na and 2 mM glutamine.
Parasite culture and characterization
Plasmodium falciparum parasites were cultured as described (Trager and Jensen, 1976) and synchronized using the sorbitol method (Lambros and Vanderberg, 1979). The parasite clone N3D6 was grown in medium supplemented with 2.5 μg ml−1 blasticidin (Lakshmanan et al., 2005). One day preceding the experiment, the drug was removed from the culture media. The genotype of all parasite clones was confirmed using microsatellite analysis of the PfRRM marker (Su et al., 1998).
Reverse varying-trans procedure
Plasmodium falciparum-infected erythrocytes (at the trophozoite stage) were purified using a strong magnet, as described (Sanchez et al., 2003). This yielded 98–100% purified trophozoite-infected erythrocytes, as directly determined by microscopic examination of Giemsa-stained blood smears. Lysis of infected erythrocytes was not observed. Purified infected erythrocytes were resuspended in the appropriate medium at a haematocrit of approximately 25 000 cells μl−1. The exact haematocrit was determined using a Neubauer counting chamber. The ‘reverse varying-trans’ efflux procedure consists of a pre-loading phase during which the P. falciparum parasites HB3, N3D6 and Dd2 were incubated at 37°C for 15 min until equilibrium (Sanchez et al., 2003) in medium containing the appropriate amount of [3H]-chloroquine. The [3H]-chloroquine concentration in the pre-incubation medium varied depending on the parasite used and the condition applied, and had been empirically determined to ensure comparable intracellular drug concentrations at the end of the pre-loading phase (data not shown). In glucose-rich medium, HB3, N3D6 and Dd2 were incubated in medium containing 20 nM (both HB3 and N3D6) and 100 nM (Dd2) chloroquine respectively. Under glucose-deprived conditions, HB3, N3D6 and Dd2 were incubated in glucose-free medium containing 40 nM of [3H]-chloroquine. After pre-loading, cells were washed twice in ice-cold medium (pH adjusted to 7.3 at 4°C) and resuspended in pre-warmed medium containing 0, 0.025 μM, 0.1 μM or 1.0 μM unlabelled chloroquine. The reaction was held at 37°C and the time-course of [3H]-chloroquine efflux was monitored. In cases where bicarbonated RPMI 1640 medium was used, the entire experiment including pre-loading with labelled chloroquine was conducted under controlled atmospheric conditions of 5% CO2 and 5% O2 using a gassed incubation chamber. Duplicate 150 μl aliquots were removed from the reaction at various time points and immediately spun through a layer of a 5:4 mixture of dibutyl phthalate and dioctyl phthalate (15 000 g, 5 s) to separate the cells from the aqueous medium that contained the extracellular [3H]-chloroquine. The cell pellets were recovered by cutting the reaction tubes through the oil layer. The amount of extracellular and intracellular [3H]-chloroquine was determined using a liquid scintillation counter (TRI-CARB 2100 TR, Packard), as described (Sanchez et al., 2003). The intracellular [3H]-chloroquine concentration was calculated from the amount of intracellular label by assuming that the volume of a trophozoite-infected erythrocyte is 75 fl (Saliba et al., 1998), and normalizing the measurements to 1 × 10⁶ infected erythrocytes. Where indicated, verapamil was added to the reaction at the indicated concentration.
Curve fitting
Kinetic data were analysed using a computerized least squares fit method (Sigma Plot 9, Jandel Corporation). For the release kinetics study we used the exponential decay algorithm from Sigma Plot, transformed to calculate the apparent initial rates of release directly, this being equal to a*b in the SigmaPlot exponential curve fit equation. The equation used is: CQremaining = CQ∞ + (Init/b)*exp(−bt), where t is the time during which efflux is occurring, b is the rate constant for efflux and Init is the apparent initial rate of efflux. When t = 0, the CQremaining has the value CQ∞ + Init/b, while the apparent initial rate is given by Init, which is the value of the slope as t tends to zero. At infinite time, CQremaining has the value CQ∞. Rates were derived for the amount of exchangeable label, as defined by extrapolating the efflux curves to infinite time, with the total amount of chloroquine efflux computed using the initial isotopic specific activity.
Statistical tests
Tests of significant differences between derived parameters were performed using Student’s t-test, with significance set at P < 0.05.
Measurement of intracellular ATP
The concentration of ATP within the parasite was measured using the ATP-Assay kit (Calbiochem), as described by the manufacturer. Briefly, 1 × 10⁶ magnet purified infected erythrocytes (at the trophozoite stage) were resuspended in 90 μl of the nucleotide releasing buffer provided by the kit. Ten microlitres of whole cell lysate was diluted in 290 μl of HEPES buffer solution. One hundred microlitres of luciferase reagent was added and the luciferase activity determined using a luminometer (Lumat LB 9507, EG & G Berthold, Germany).
Live cell imaging
Live cell imaging with the acidotropic dye LS Blue (Molecular Probes) was performed as previously described (Wissing et al., 2002; Rohrbach et al., 2005; Sanchez et al., 2005). Briefly, P. falciparum-infected erythrocytes were washed twice with Ringer solution (122.5 mM NaCl, 5.4 mM KCl, 1.2 mM CaCl2, 0.8 mM MgCl2, 11 mM D-glucose, 10 mM HEPES, 1 mM NaH2PO4, pH 7.4) and allowed to settle onto poly-L-lysine-coated coverslips in a microperfusion chamber (Wunsch et al., 1998). Cells were then perfused with Ringer solution containing 1 μM LS Blue. Confocal scanning fluorescence microscopy was performed using a Zeiss LSM510 (Carl Zeiss, Germany) microscope equipped with UV laser lines (351 nm, 364 nm) and an Axiovert 100M microscope. A pinhole of 1 μm was chosen to ensure that fluorescence was from within the food vacuole and not from the regions lying above or below. LS Blue was excited at 364 nm and the emission was detected using an LP 385 nm filter. Image acquisition was optimized to minimize the bleaching of the non-ratiometric dye LS Blue. For quantification of the measurements, a region of interest (ROI) was chosen lying within the food vacuole. The mean fluorescence of LS Blue was determined within the ROIs and plotted.
Short-term tolerance to verapamil
Highly synchronized P. falciparum-infected erythrocytes at the trophozoite stage (parasitaemia of 2–3% and a haematocrit of 5%) were washed using RPMI 1640 medium, resuspended in the same medium and then incubated for 15 min at 37°C with verapamil concentrations ranging from 0 to 100 μM. After incubation, cells were washed twice, returned to culture and a proliferation assay was performed by incubating the cells for 48 h (an entire cell cycle including reinvasion, from the trophozoite stage to the trophozoite stage) in the presence of [3H]-hypoxanthine (Desjardins et al., 1979).
Supplementary Material
Acknowledgments
This work was supported by the Landesstiftung Baden-Württemberg, the SFB 544 entitled ‘Control of tropical infectious diseases’, and the European Commission (M.L.) and the NIH (AI50234, D.A.F.). We thank Elisabeth Wilken and Marina Müller for technical assistance. This paper is dedicated to the memory of William Robert Lieb, a pioneer in the study of membrane transport kinetics and a dear friend, who died in tragic circumstances on 25 January, 2005.
Footnotes
This material is available as part of the online article from http://www.blackwell-synergy.com
Please note: Blackwell Publishing is not responsible for the content or functionality of any supplementary materials supplied by the authors. Any queries (other than missing material) should be directed to the corresponding author for the article.
References
- Baker GF, Widdas WF. The asymmetry of the facilitated transfer system for hexoses in human red cells and the simple kinetics of a two component model. J Physiol. 1973;231:143–165. doi: 10.1113/jphysiol.1973.sp010225. [DOI] [PMC free article] [PubMed] [Google Scholar]
- Bennett TN, Kosar AD, Ursos LM, Dzekunov S, Singh Sidhu AB, Fidock DA, Roepe PD. Drug resistance-associated PfCRT mutations confer decreased Plasmodium falciparum digestive vacuolar pH. Mol Biochem Parasitol. 2004;133:99–114. doi: 10.1016/j.molbiopara.2003.09.008. [DOI] [PubMed] [Google Scholar]
- Bray PG, Mungthin M, Ridley RG, Ward SA. Access to hematin: the basis of chloroquine resistance. Mol Pharmacol. 1998;54:170–179. doi: 10.1124/mol.54.1.170. [DOI] [PubMed] [Google Scholar]
- Bray PG, Mungthin M, Hastings IM, Biagini GA, Saidu DK, Lakshmanan V, et al. PfCRT and the trans-vacuolar proton electrochemical gradient: regulating the access of chloroquine to ferriprotoporphyrin IX. Mol Microbiol. 2006;62:238–251. doi: 10.1111/j.1365-2958.2006.05368.x. [DOI] [PMC free article] [PubMed] [Google Scholar]
- Byers TL, Bitonti AJ, McCann PP. bis (benzyl) polyamine analogues are substrates for a mammalian cell-transport system which is distinct from the polyamine-transport system. Biochem J. 1990;269:35–40. doi: 10.1042/bj2690035. [DOI] [PMC free article] [PubMed] [Google Scholar]
- Cabantchik ZI, Ginsburg H. Transport of uridine in human red blood cells. Demonstration of a simple carrier-mediated process. J Gen Physiol. 1977;69:75–96. doi: 10.1085/jgp.69.1.75. [DOI] [PMC free article] [PubMed] [Google Scholar]
- Carter R, Mendis KN. Evolutionary and historical aspects of the burden of malaria. Clin Microbiol Rev. 2002;15:564–594. doi: 10.1128/CMR.15.4.564-594.2002. [DOI] [PMC free article] [PubMed] [Google Scholar]
- Chou AC, Chevli R, Fitch CD. Ferriprotoporphyrin IX fulfills the criteria for identification as the chloroquine receptor of malaria parasites. Biochemistry. 1980;19:1543–1549. doi: 10.1021/bi00549a600. [DOI] [PubMed] [Google Scholar]
- Closs EI, Lyons CR, Kelly C, Cunningham JM. Characterization of the third member of the MCAT family of cationic amino acid transporters. Identification of a domain that determines the transport properties of the MCAT proteins. J Biol Chem. 1993;268:20796–20800. [PubMed] [Google Scholar]
- Cooper RA, Ferdig MT, Su XZ, Ursos LM, Mu J, Nomura T, et al. Alternative mutations at position 76 of the vacuolar transmembrane protein PfCRT are associated with chloroquine resistance and unique stereospecific quinine and quinidine responses in Plasmodium falciparum. Mol Pharmacol. 2002;61:35–42. doi: 10.1124/mol.61.1.35. [DOI] [PubMed] [Google Scholar]
- Cooper RA, Lane KD, Deng D, Mu J, Patel JJ, Wellems TE, et al. Mutations in transmembrane domains 1, 4 and 9 of the Plasmodium falciparum chloroquine resistance transporter alter susceptibility to chloroquine, quinine and quinidine. Mol Microbiol. 2006;63:270–282. doi: 10.1111/j.1365-2958.2006.05511.x. [DOI] [PubMed] [Google Scholar]
- Dani JA, Levitt DG. Binding constants of Li+, K+, and Tl+ in the gramicidin channel determined from water permeability measurements. Biophys J. 1981;35:485–499. doi: 10.1016/S0006-3495(81)84804-7. [DOI] [PMC free article] [PubMed] [Google Scholar]
- De Dios AC, Tycko R, Ursos LMB, Roepe PD. NMR studies of chloroquine-ferriprotoporphyrin IX complex. J Phys Chem A. 2003;107:5821–5825. [Google Scholar]
- Desjardins RE, Canfield CJ, Haynes JD, Chulay JD. Quantitative assessment of antimalarial activity in vitro by a semiautomated microdilution technique. Antimicrob Agents Chemother. 1979;16:710–718. doi: 10.1128/aac.16.6.710. [DOI] [PMC free article] [PubMed] [Google Scholar]
- Djimde A, Doumbo OK, Cortese JF, Kayentao K, Doumbo S, Diourte Y, et al. A molecular marker for chloroquine-resistant falciparum malaria. N Engl J Med. 2001;344:257–263. doi: 10.1056/NEJM200101253440403. [DOI] [PubMed] [Google Scholar]
- Dorn A, Vippagunta SR, Matile H, Jaquet C, Vennerstrom JL, Ridley RG. An assessment of drug-haematin binding as a mechanism for inhibition of haematin polymerisation by quinoline antimalarials. Biochem Pharmacol. 1998;55:727–736. doi: 10.1016/s0006-2952(97)00510-8. [DOI] [PubMed] [Google Scholar]
- Dzekunov SM, Ursos LM, Roepe PD. Digestive vacuolar pH of intact intraerythrocytic P. falciparum either sensitive or resistant to chloroquine. Mol Biochem Parasitol. 2000;110:107–124. doi: 10.1016/s0166-6851(00)00261-9. [DOI] [PubMed] [Google Scholar]
- Egan TJ, Combrinck JM, Egan J, Hearne GR, Marques HM, Ntenteni S, et al. Fate of haem iron in the malaria parasite Plasmodium falciparum. Biochem J. 2002;365:343–347. doi: 10.1042/BJ20020793. [DOI] [PMC free article] [PubMed] [Google Scholar]
- Engel K, Wang J. Interaction of organic cations with a newly identified plasma membrane monoamine transporter. Mol Pharmacol. 2005;68:1397–1407. doi: 10.1124/mol.105.016832. [DOI] [PubMed] [Google Scholar]
- Ferdig MT, Cooper RA, Mu J, Deng B, Joy DA, Su XZ, Wellems TE. Dissecting the loci of low-level quinine resistance in malaria parasites. Mol Microbiol. 2004;52:985–997. doi: 10.1111/j.1365-2958.2004.04035.x. [DOI] [PubMed] [Google Scholar]
- Fidock DA, Nomura T, Talley AK, Cooper RA, Dzekunov SM, Ferdig MT, et al. Mutations in the P. falciparum digestive vacuole transmembrane protein PfCRT and evidence for their role in chloroquine resistance. Mol Cell. 2000;6:861–871. doi: 10.1016/s1097-2765(05)00077-8. [DOI] [PMC free article] [PubMed] [Google Scholar]
- Fitch CD. Plasmodium falciparum in owl monkeys: drug resistance and chloroquine binding capacity. Science. 1970;169:289–290. doi: 10.1126/science.169.3942.289. [DOI] [PubMed] [Google Scholar]
- Fitch CD. Chloroquine-resistant Plasmodium falciparum: difference in the handling of 14C-amodiaquin and 14C-chloroquine. Antimicrob Agents Chemother. 1973;3:545–548. doi: 10.1128/aac.3.5.545. [DOI] [PMC free article] [PubMed] [Google Scholar]
- Fitch CD. Ferriprotoporphyrin IX, phospholipids, and the antimalarial actions of quinoline drugs. Life Sci. 2004;74:1957–1972. doi: 10.1016/j.lfs.2003.10.003. [DOI] [PubMed] [Google Scholar]
- Fitch CD, Chevli R, Banyal HS, Phillips G, Pfaller MA, Krogstad DJ. Lysis of Plasmodium falciparum by ferriprotoporphyrin IX and a chloroquine-ferriprotoporphyrin IX complex. Antimicrob Agents Chemother. 1982;21:819–822. doi: 10.1128/aac.21.5.819. [DOI] [PMC free article] [PubMed] [Google Scholar]
- Fitch CD, Chevli R, Kanjananggulpan P, Dutta P, Chevli K, Chou AC. Intracellular ferriprotoporphyrin IX is a lytic agent. Blood. 1983;62:1165–1168. [PubMed] [Google Scholar]
- Hayward R, Saliba KJ, Kirk K. The pH of the digestive vacuole of Plasmodium falciparum is not associated with chloroquine resistance. J Cell Sci. 2006;119:1016–1025. doi: 10.1242/jcs.02795. [DOI] [PubMed] [Google Scholar]
- Hoare DG. The transport of 1-leucine in human erythrocytes: a new kinetic analysis. J Physiol. 1972;221:311–329. doi: 10.1113/jphysiol.1972.sp009753. [DOI] [PMC free article] [PubMed] [Google Scholar]
- Jarvis SM. Trans-stimulation and trans-inhibition of uridine efflux from human erythrocytes by permeant nucleosides. Biochem J. 1986;233:295–297. doi: 10.1042/bj2330295. [DOI] [PMC free article] [PubMed] [Google Scholar]
- Johnson DJ, Fidock DA, Mungthin M, Lakshmanan V, Sidhu AB, Bray PG, Ward SA. Evidence for a central role for PfCRT in conferring Plasmodium falciparum resistance to diverse antimalarial agents. Mol Cell. 2004;15:867–877. doi: 10.1016/j.molcel.2004.09.012. [DOI] [PMC free article] [PubMed] [Google Scholar]
- Keynes RD, Lewis PR. Determination of the ionic exchange during nervous activity by activation analysis. Nature. 1950;165:809–810. doi: 10.1038/165809a0. [DOI] [PubMed] [Google Scholar]
- Krogstad DJ, Schlesinger PH, Gluzman IY. Antimalarials increase vesicle pH in Plasmodium falciparum. J Cell Biol. 1985;101:2302–2309. doi: 10.1083/jcb.101.6.2302. [DOI] [PMC free article] [PubMed] [Google Scholar]
- Krogstad DJ, Gluzman IY, Kyle DE, Oduola AM, Martin SK, Milhous WK, Schlesinger PH. Efflux of chloroquine from Plasmodium falciparum: mechanism of chloroquine resistance. Science. 1987;238:1283–1285. doi: 10.1126/science.3317830. [DOI] [PubMed] [Google Scholar]
- Krogstad DJ, Gluzman IY, Herwaldt BL, Schlesinger PH, Wellems TE. Energy dependence of chloroquine accumulation and chloroquine efflux in Plasmodium falciparum. Biochem Pharmacol. 1992;43:57–62. doi: 10.1016/0006-2952(92)90661-2. [DOI] [PubMed] [Google Scholar]
- Kuhn Y, Rohrbach P, Lanzer M. Quantitative pH measurements in Plasmodium falciparum-infected erythrocytes using pHluorin. Cell Microbiol. 2007 doi: 10.1111/j.1462-5822.2006.00847.x. (in press) [DOI] [PubMed] [Google Scholar]
- Lakshmanan V, Bray PG, Verdier-Pinard D, Johnson DJ, Horrocks P, Muhle RA, et al. A critical role for PfCRT K76T in Plasmodium falciparum verapamil-reversible chloroquine resistance. EMBO J. 2005;24:2294–2305. doi: 10.1038/sj.emboj.7600681. [DOI] [PMC free article] [PubMed] [Google Scholar]
- Lambros C, Vanderberg JP. Synchronization of Plasmodium falciparum erythrocytic stages in culture. J Parasitol. 1979;65:418–420. [PubMed] [Google Scholar]
- Leed A, DuBay K, Ursos LM, Sears D, De Dios AC, Roepe PD. Solution structures of antimalarial drug-heme complexes. Biochemistry. 2002;41:10245–10255. doi: 10.1021/bi020195i. [DOI] [PubMed] [Google Scholar]
- Levine M, Oxender DL, Stein WD. The substrate-facilitated transport of the glucose carrier across the human erythrocyte membrane. Biochim Biophys Acta. 1965;109:151–163. doi: 10.1016/0926-6585(65)90099-3. [DOI] [PubMed] [Google Scholar]
- Lew VL, Tiffert T, Ginsburg H. Excess hemoglobin digestion and the osmotic stability of Plasmodium falciparum-infected red blood cells. Blood. 2003;101:4189–4194. doi: 10.1182/blood-2002-08-2654. [DOI] [PubMed] [Google Scholar]
- Martin RE, Kirk K. The malaria parasite’s chloroquine resistance transporter is a member of the drug/metabolite transporter superfamily. Mol Biol Evol. 2004;21:1938–1949. doi: 10.1093/molbev/msh205. [DOI] [PubMed] [Google Scholar]
- Meredith D. Site-directed mutation of arginine 282 to glutamate uncouples the movement of peptides and protons by the rabbit proton-peptide cotransporter PepT1. J Biol Chem. 2004;279:15795–15798. doi: 10.1074/jbc.M313922200. [DOI] [PubMed] [Google Scholar]
- Naude B, Brzostowski JA, Kimmel AR, Wellems TE. Dictyostelium discoideum expresses a malaria chloroquine resistance mechanism upon transfection with mutant, but not wild-type, Plasmodium falciparum transporter PfCRT. J Biol Chem. 2005;280:25596–25603. doi: 10.1074/jbc.M503227200. [DOI] [PMC free article] [PubMed] [Google Scholar]
- Quick M, Stolting S, Jung H. Role of conserved Arg40 and Arg117 in the Na+/proline transporter of Escherichia coli. Biochemistry. 1999;38:13523–13529. doi: 10.1021/bi991256o. [DOI] [PubMed] [Google Scholar]
- Ribbes G, Hamza M, Chap H, Douste-Blazy L. Carrier-mediated choline uptake by Krebs II ascites cells. Biochim Biophys Acta. 1985;818:183–190. doi: 10.1016/0005-2736(85)90560-7. [DOI] [PubMed] [Google Scholar]
- Rohrbach P, Friedrich O, Hentschel J, Plattner H, Fink RH, Lanzer M. Quantitative calcium measurements in subcellular compartments of Plasmodium falciparum-infected erythrocytes. J Biol Chem. 2005;280:27960–27969. doi: 10.1074/jbc.M500777200. [DOI] [PubMed] [Google Scholar]
- Saliba KJ, Kirk K. pH regulation in the intracellular malaria parasite, Plasmodium falciparum. H(+) extrusion via a v-type H(+)-ATPase. J Biol Chem. 1999;274:33213–33219. doi: 10.1074/jbc.274.47.33213. [DOI] [PubMed] [Google Scholar]
- Saliba KJ, Horner HA, Kirk K. Transport and metabolism of the essential vitamin pantothenic acid in human erythrocytes infected with the malaria parasite Plasmodium falciparum. J Biol Chem. 1998;273:10190–10195. doi: 10.1074/jbc.273.17.10190. [DOI] [PubMed] [Google Scholar]
- Saliba KJ, Allen RJ, Zissis S, Bray PG, Ward SA, Kirk K. Acidification of the malaria parasite’s digestive vacuole by a H+-ATPase and a H+-pyrophosphatase. J Biol Chem. 2003;278:5605–5612. doi: 10.1074/jbc.M208648200. [DOI] [PubMed] [Google Scholar]
- Sanchez CP, Stein W, Lanzer M. Trans stimulation provides evidence for a drug efflux carrier as the mechanism of chloroquine resistance in Plasmodium falciparum. Biochemistry. 2003;42:9383–9394. doi: 10.1021/bi034269h. [DOI] [PubMed] [Google Scholar]
- Sanchez CP, McLean JE, Stein W, Lanzer M. Evidence for a substrate specific and inhibitable drug efflux system in chloroquine resistant Plasmodium falciparum strains. Biochemistry. 2004;43:16365–16373. doi: 10.1021/bi048241x. [DOI] [PubMed] [Google Scholar]
- Sanchez CP, McLean JE, Rohrbach P, Fidock DA, Stein WD, Lanzer M. Evidence for a pfcrt-associated chloroquine efflux system in the human malarial parasite Plasmodium falciparum. Biochemistry. 2005;44:9862–9870. doi: 10.1021/bi050061f. [DOI] [PubMed] [Google Scholar]
- Sen AK, Widdas WF. Variations of the parameters of glucose transfer across the human erythrocyte membrane in the presence of inhibitors of transfer. J Physiol. 1962;160:404–416. doi: 10.1113/jphysiol.1962.sp006855. [DOI] [PMC free article] [PubMed] [Google Scholar]
- Sherman IW. Carbohydrate metabolism of asexual stages. In: Sherman IW, editor. Malaria: Parasite Biology, Pathogenesis, and Protection. Washington, DC: American Society for Microbiology Press; 1998. pp. 135–143. [Google Scholar]
- Sidhu AB, Verdier-Pinard D, Fidock DA. Chloroquine resistance in Plasmodium falciparum malaria parasites conferred by pfcrt mutations. Science. 2002;298:210–213. doi: 10.1126/science.1074045. [DOI] [PMC free article] [PubMed] [Google Scholar]
- Snow RW, Guerra CA, Noor AM, Myint HY, Hay SI. The global distribution of clinical episodes of Plasmodium falciparum malaria. Nature. 2005;434:214–217. doi: 10.1038/nature03342. [DOI] [PMC free article] [PubMed] [Google Scholar]
- Stein WD. Transport and Diffusion across Cell Membranes. New York: Academic Press; 1986. [Google Scholar]
- Su XZ, Carucci DJ, Wellems TE. Plasmodium falciparum: parasite typing by using a multicopy microsatellite marker, PfRRM. Exp Parasitol. 1998;89:262–265. doi: 10.1006/expr.1998.4299. [DOI] [PubMed] [Google Scholar]
- Sullivan DJ, Jr, Gluzman IY, Russell DG, Goldberg DE. On the molecular mechanism of chloroquine’s antimalarial action. Proc Natl Acad Sci USA. 1996;93:11865–11870. doi: 10.1073/pnas.93.21.11865. [DOI] [PMC free article] [PubMed] [Google Scholar]
- Tan W, Gou DM, Tai E, Zhao YZ, Chow LM. Functional reconstitution of purified chloroquine resistance membrane transporter expressed in yeast. Arch Biochem Biophys. 2006;452:119–128. doi: 10.1016/j.abb.2006.06.017. [DOI] [PubMed] [Google Scholar]
- Trager W, Jensen JB. Human malaria parasites in continuous culture. Science. 1976;193:673–675. doi: 10.1126/science.781840. [DOI] [PubMed] [Google Scholar]
- Tran CV, Saier MH., Jr The principal chloroquine resistance protein of Plasmodium falciparum is a member of the drug/metabolite transporter superfamily. Microbiology. 2004;150:1–3. doi: 10.1099/mic.0.26818-0. [DOI] [PubMed] [Google Scholar]
- Ursos LM, Roepe PD. Chloroquine resistance in the malarial parasite, Plasmodium falciparum. Med Res Rev. 2002;22:465–491. doi: 10.1002/med.10016. [DOI] [PubMed] [Google Scholar]
- Ursos LM, DuBay KF, Roepe PD. Antimalarial drugs influence the pH dependent solubility of heme via apparent nucleation phenomena. Mol Biochem Parasitol. 2001;112:11–17. doi: 10.1016/s0166-6851(00)00342-x. [DOI] [PubMed] [Google Scholar]
- Villalobos AR, Braun EJ. Substrate specificity of organic cation/H+ exchange in avian renal brush-border membranes. J Pharmacol Exp Ther. 1998;287:944–951. [PubMed] [Google Scholar]
- Warhurst DC, Craig JC, Adagu IS. Lysosomes and drug resistance in malaria. Lancet. 2002;360:1527–1529. doi: 10.1016/S0140-6736(02)11577-7. [DOI] [PubMed] [Google Scholar]
- Wissing F, Sanchez CP, Rohrbach P, Ricken S, Lanzer M. Illumination of the malaria parasite Plasmodium falciparum alters intracellular pH. Implications for live cell imaging. J Biol Chem. 2002;277:37747–37755. doi: 10.1074/jbc.M204845200. [DOI] [PubMed] [Google Scholar]
- Wunsch S, Sanchez CP, Gekle M, Grosse-Wortmann L, Wiesner J, Lanzer M. Differential stimulation of the Na+/H+ exchanger determines chloroquine uptake in Plasmodium falciparum. J Cell Biol. 1998;140:335–345. doi: 10.1083/jcb.140.2.335. [DOI] [PMC free article] [PubMed] [Google Scholar]
- Yabuuchi H, Tamai I, Nezu J, Sakamoto K, Oku A, Shimane M, et al. Novel membrane transporter OCTN1 mediates multispecific, bidirectional, and pH-dependent transport of organic cations. J Pharmacol Exp Ther. 1999;289:768–773. [PubMed] [Google Scholar]
- Yayon A, Ginsburg H. The transport of chloroquine across human erythrocyte membranes is mediated by a simple symmetric carrier. Biochim Biophys Acta. 1982;686:197–203. doi: 10.1016/0005-2736(82)90113-4. [DOI] [PubMed] [Google Scholar]
- Yayon A, Cabantchik ZI, Ginsburg H. Identification of the acidic compartment of Plasmodium falciparum-infected human erythrocytes as the target of the antimalarial drug chloroquine. EMBO J. 1984;3:2695–2700. doi: 10.1002/j.1460-2075.1984.tb02195.x. [DOI] [PMC free article] [PubMed] [Google Scholar]
- Yayon A, Cabantchik ZI, Ginsburg H. Susceptibility of human malaria parasites to chloroquine is pH dependent. Proc Natl Acad Sci USA. 1985;82:2784–2788. doi: 10.1073/pnas.82.9.2784. [DOI] [PMC free article] [PubMed] [Google Scholar]
- Zhang H, Paguio M, Roepe PD. The antimalarial drug resistance protein Plasmodium falciparum chloroquine resistance transporter binds chloroquine. Biochemistry. 2004;43:8290–8296. doi: 10.1021/bi049137i. [DOI] [PubMed] [Google Scholar]
- Zhou Y, Samson M, Francon J, Blondeau JP. Thyroid hormone concentrative uptake in rat erythrocytes. Involvement of the tryptophan transport system T in countertransport of tri-iodothyronine and aromatic amino acids. Biochem J. 1992;281:81–86. doi: 10.1042/bj2810081. [DOI] [PMC free article] [PubMed] [Google Scholar]
Associated Data
This section collects any data citations, data availability statements, or supplementary materials included in this article.