Abstract
To investigate the interaction between peptides and glutamatergic synapses in the dorsal thalamus, we compared the frequency-dependent plasticity of excitatory postsynaptic potentials (EPSPs) in the tectorecipient zone of rodent lateral posterior nucleus (LPN), which is densely innervated by axons that contain the neuromodulator substance P (SP). Immunocytochemistry and confocal and electron microscopy revealed that neurokinin 1 (NK1) receptors are distributed on the dendrites of LPN cells, whereas SP is contained in axons originating from the superior colliculus (SC) and is reduced following SC lesions. In vitro whole cell recordings in parasagittal slices revealed that stimulation of the SC or optic radiations (corticothalamic axons [CTXs]) evoked LPN EPSPs that increased in amplitude with increasing stimulation intensity, suggesting convergence. With 0.5- to 10-Hz stimulus trains, CTX EPSP amplitudes displayed frequency-dependent facilitation, whereas SC EPSP amplitudes were unchanged. High-frequency SC stimulation (100 Hz for 0.5 s), or bath application of SP, resulted in gradual increases in both SC and CTX EPSP amplitudes to twofold or greater above baseline within 15–20 min poststimulation/application. This enhancement correlated with increases in input resistance and both the potentiation and resistance change were abolished in the presence of the NK1 antagonist L-703,606. These results indicate that SP is released when SC-LPN neurons fire at high frequency and SP acts postsynaptically via NK1 receptors to potentiate subsequent LPN responses to both cortical and tectal inputs. We suggest that the SP-mediated potentiation of synaptic responses may serve to amplify responses to threatening objects that move across large regions of the visual field.
INTRODUCTION
The efficacy of sensory information transfer through the dorsal thalamus is subject to state-dependent fluctuations in the membrane properties of thalamic neurons and their synaptic inputs (Sherman 2001). A particularly robust transformation of sensory signals is mediated by the frequency-dependent plasticity of glutamatergic synapses. For example, the amplitudes of retinogeniculate excitatory postsynaptic potentials (EPSPs) remain stable at low stimulation frequencies (<1 Hz), but decrease in amplitude as the stimulation frequency is increased (2–20 Hz; Chen and Regehr 2003; Chen et al. 2002; Turner and Salt 1998). In contrast, the amplitudes of corticogeniculate EPSPs remain stable at low stimulation frequencies, but facilitate with increasing stimulation frequency (Granseth et al. 2002; Lindstrom and Wrobel 1990; Turner and Salt 1998; von Krosigk et al. 1999). Higher frequency stimulation (50–500 Hz) of corticogeniculate fibers activates metabotropic glutamate receptors, resulting in slow EPSPs that can depolarize the membrane potential of geniculate neurons for ≥20 s (McCormick and von Krosigk 1992). Moreover, tetanic stimulation of corticothalamic fibers in the ventrobasal nucleus results in a long-term (≥1 h) potentiation of these synapses (Castro-Alamancos and Calcagnotto 1999).
Further modulation of thalamic transmission is made possible by a rich network of fibers that contain a wide variety of neuropeptides. However, although a number of studies have demonstrated that the membrane properties of thalamic neurons can be significantly altered by the exogenous application of neuropeptides (Brill et al. 2007; Cox et al. 1997; Govindaiah and Cox 2006; Lee and Cox 2006, 2008; Paul and Cox 2010; Sun et al. 2002) or by their release from intrinsic interneurons (Sun et al. 2003), little is known regarding the conditions under which neuropeptides are released by extrinsic inputs to the thalamus or their effects on neuronal responses to conventional neurotransmitters. This is an important avenue of investigation because the ability to manipulate thalamic synaptic efficacy could be used to modify abnormal thalamic activity patterns that occur in conditions such as epilepsy or neuropathic pain.
In other areas of the brain, neuropeptides have been shown to amplify glutamatergic postsynaptic responses. For example, in the spinal cord substance P (SP) release from C fibers is dependent on the frequency of their stimulation and the binding of SP to neurokinin 1 (NK1) receptors results in the amplification of glutamatergic EPSPs (Adelson et al. 2009). To examine conditions that induce thalamic neuropeptide release and subsequent effects on glutamatergic transmission, we examined the frequency dependence of corticothalamic and tectothalamic responses in the rat lateral posterior nucleus (LPN). We previously demonstrated that within the tectorecipient zone of the LPN cortical terminals (which contain the type 1 vesicular glutamate transporter [vGLUT1]) are located distal to tectal terminals (which contain the type 2 vesicular glutamate transporter [vGLUT2]) on the dendrites of projection neurons (Masterson et al. 2009). The LPN is also densely innervated by fibers that contain SP, which likely arise from the superior colliculus (SC; Hutsler and Chalupa 1991). Thus the LPN provides a model system to examine the interactions of peptides and glutamatergic synapses in the thalamus. Our results demonstrate that substance P release from tecto-LPN axons is frequency-dependent and, via binding to NK1 receptors, can provide a sustained potentiation of both tectal and cortical glutamatergic synaptic responses.
METHODS
All procedures conformed to the National Institutes of Health guidelines for the care and use of laboratory animals and were approved by the University of Louisville Animal Care and Use Committee.
Tract tracing and lesions
Two adult Long–Evans (hooded) rats received bilateral injections of biotinylated dextran amine (BDA; Molecular Probes, Carlsbad, CA) in the SC and two rats received unilateral injections of ibotenic acid (Sigma Chemical, St. Louis, MO) in the SC. The rats were anesthetized with intraperitoneal injections of ketamine (initially 75 mg/kg) and xylazine (initially 8 mg/kg), with supplements injected as needed to maintain anesthesia. They were placed in a stereotaxic apparatus and prepared for aseptic surgery. A small craniotomy was made above the SC and BDA (5 μl, 5% in saline) or ibotenic acid (2 μl, 2% in saline; Sigma Chemical) was injected through a glass micropipette (tip diameter: 10 μm) using a PV83 pneumatic picopump (World Precision Instruments [WPI], Sarasota, FL). After a survival time of 1 wk, the rats were transcardially perfused with artificial cerebrospinal fluid (ACSF) followed by a fixative solution of 4% paraformaldehyde in 0.1 M phosphate buffer (PB; pH 7.4). The brain was removed from the skull and a vibratome was used to cut sections in the parasagittal plane to a thickness of 50 μm.
Histochemistry
To examine the distribution of SP and NK1 in the LPN, eight rats were deeply anesthetized and transcardially perfused with ACSF followed by a fixative solution of 4% paraformaldehyde or 4% paraformaldehyde and 0.5% glutaraldehyde in 0.1 M PB (pH 7.4). The brain was removed from the skull and a vibratome was used to cut sections in the parasagittal plane to a thickness of 50 μm. Sections from these rats, as well as sections from rats that received ibotenic acid injections in the SC, were incubated in either a rat-anti-SP antibody (Accurate Chemical, Westbury, NY) diluted 1:500 or a rabbit-anti-NK1 antibody (Chemicon, Billerica, MA) diluted 1:4,000 in 0.01 M PB, 0.9% NaCl (PBS), and 1% normal goat serum. The following day the sections were rinsed in PB and incubated for 1 h in biotinylated goat-anti-rat or biotinylated-goat-anti-rabbit antibodies (Vector Laboratories, Burlingame, CA) diluted 1:100. They were then incubated for 1 h in a solution of 1:100 dilution of avidin and biotinylated-horseradish peroxidase (ABC solution), reacted with nickel-enhanced diaminobenzidine, and mounted on slides or prepared for electron microscopy.
For electron microscopy, sections were postfixed in 2% osmium tetroxide in PB for 1 h and then dehydrated through a graded series of ethyl alcohol (70–100%) and embedded in Durcupan resin (Ted Pella, Redding, CA) between sheets of Aclar plastic (Ladd Industries, Burlington, VT). A light microscope was used to identify areas of interest, which were excised and mounted on resin blocks. A diamond knife was used to cut ultrathin sections, which were placed on Formvar-coated nickel slot grids, air dried, and stained with a 10% solution of uranyl acetate in methanol for 30 min before examination with an electron microscope. SP- or NK1-labeled profiles were digitally captured and categorized based on ultrastructural features.
The size of SP-stained profiles was measured using SigmaScan software (SPSS, Chicago, IL) for statistical comparison with previous data (Masterson et al. 2009). The perimeter of each profile was manually traced and the minor axis was calculated. The following description from the SigmaScan manual best describes this calculation: “The major axis is a straight line connecting the two pixels in the object which have the greatest distance between them. The minor axis is a straight line which is perpendicular to the major axis and connects the two pixels in the object with the greatest distance between them. The pixels used to define these axes are found by sampling the edge pixels of an object.” We chose the minor axis measurement to compare profile sizes because this measure best offsets differences in profile size introduced by different labeling methods. For example, profile measurements of terminals labeled with anterograde tracers may include small lengths of preterminal axons, whereas immunocytochemical labeling is more likely to be restricted to the synaptic terminal. Minor-axis measurements are expressed as means ± SD and compared with previous data sets with unpaired t-test.
To determine whether tectothalamic terminals contain SP, sections from rats that received SC BDA injections were incubated overnight at 4°C in a solution of streptavidin conjugated to Alexa 546 (Molecular Probes) diluted 1:100 and rat-anti-SP antibody (Accurate Chemical) diluted 1:250 in PBS and 1% normal goat serum. The following day the sections were rinsed in PB and incubated for 1 h in a goat-anti-rat antibody conjugated to Alexa 488 diluted 1:100. After being rinsed in PB, the sections were mounted on slides and viewed with a laser scanning confocal microscope (Olympus, Center Valley, PA).
Preparation of LPN slices
Long–Evans (hooded) rats of both sexes (16–45 days old) were anesthetized with carbon dioxide and decapitated. The brains were hemisected and quickly transferred to a cold (4°C) oxygenated cutting solution containing (in mM): sucrose 206; KCl 2.5; CaCl2 1; MgSO4 1; MgCl2 1; NaH2PO4 1.25; NaHCO3 26; and d-glucose 10 at a pH of 7.4. After the tissue was chilled for 3 min, parasagittal slices (400 μm thick) were cut on a vibratome (VT 100E; Leica, Deerfield, IL) and placed back into cutting solution for 20 min. The slices were further trimmed into blocks with a razor blade to include the SC, thalamus, and striatum. The slices were then transferred into oxygenated ACSF containing (in mM): NaCl 124; KCl 2.5; CaCl2 2; MgSO4 1; NaH2PO4 26; and d-glucose 10 (pH = 7.4).
Recording procedures
After 2 h of incubation in oxygenated ACSF at 35°C, the slice was placed in a temperature-controlled recording chamber and maintained in an interface of warmed (35°C) humidified air (95% O2-5% CO2) and ACSF. Bicuculline (10 μM; Tocris Bioscience, Ellisville, MO) and CGP55845 (5 μM; Tocris Bioscience) were routinely included in the ACSF to block γ-aminobutyric acid types A and B (GABAA and GABAB) receptors. In certain experiments, 6-cyano-7-nitroquinoxaline-2,3-dione (CNQX, 20 μM; Sigma Chemical) and/or 2-amino-5-phosphonovaleric acid (APV, 25 μM; Sigma) were added to the ACSF and bath applied to block α-amino-3-hydroxy-5-methyl-4-isoxazolepropionic acid (AMPA)/kainate and N-methyl-d-aspartate (NMDA) receptors, respectively. In other experiments substance P (2 μM; Sigma) and/or the NK1 antagonist L-703,606 (5 μM; Sigma) were added to the ACSF.
Borosilicate glass microelectrodes (tip resistance: 3.5–7.0 MΩ) were pulled horizontally (P97; Sutter Instrument) and filled with a solution containing (in mM): K-gluconate 115; MgCl2 2; ATP 3; GTP 0.3; HEPES 10; KCl 120; and phosphocreatine 10 (pH = 7.3). Blind whole cell patch-clamp recordings were made in current-clamp mode with an Axoclamp 2B amplifier (MDS Analytical Technologies, Sunnyvale, CA). Positive pressure was maintained while penetrating the tissue and, when a neuron was encountered (as indicated by an increase in electrode resistance), a small negative pressure was applied to the pipette to rupture a patch of cellular membrane. Recordings were obtained from cells considered to be relay cells. These cells exhibited a low-threshold calcium conductance and a hyperpolarization-activated mixed cation conductance (Li et al. 2003a). Records were digitized at 10 kHz and stored directly on computer. All membrane potential measurements were junction potential (9 mV) corrected.
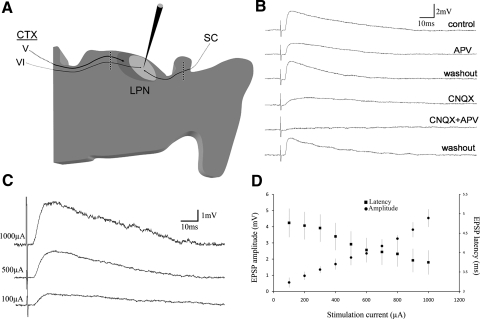
As schematically illustrated in Fig. 3A, to stimulate tectothalamic fibers, a multipolar stimulation electrode (matrix microelectrode; FHC, Bowdoin, ME) was placed in the superficial layers of the SC. Corticothalamic axons (CTXs) were stimulated with a second multipolar electrode placed in the optic radiations. Stimulating electrodes were always ≥1 mm from the recording electrode. The electrode array contained eight tungsten electrodes with a spacing of 115 μm between each electrode. Once a whole cell recording was obtained, SC or CTX stimulation was produced by using any two adjacent electrodes in the arrays. The anode and cathode positions were varied until the best response was achieved.
Fig. 3.
Tecto-LPN inputs are glutamatergic and convergent. A: schematic illustration of the recording and stimulation sites used to examine tectothalamic and corticothalamic excitatory postsynaptic potentials (EPSPs) in the LPN. Parasagittal slices that contained the most lateral regions of the SC were used. An array of 8 electrodes (black dots surrounded by white circles) was placed in the SC to activate the cut axons of tectothalamic cells located in more medial regions of the SC. A second array of 8 electrodes was placed just rostral to the LPN to activate the cut axons of corticothalamic cells (CTXs). Our previous anatomical studies (Li et al. 2003; Masterson et al. 2009) revealed that only the rostral LPN is innervated by large corticothalamic terminals that originate from layer V cells. The caudal tectorecipient region of the LPN (light gray) is innervated only by small corticothalamic terminals that originate from layer VI. B: tectothalamic EPSPs activate both N-methyl-d-aspartate (NMDA) and non-NMDA receptors. In the presence of the NMDA receptor antagonist 2-amino-5-phosphonovaleric acid (APV), or the α-amino-3-hydroxy-5-methyl-4-isoxazolepropionic acid (AMPA)/kainate receptor antagonist 6-cyano-7-nitroquinoxaline-2,3-dione (CNQX), there was a decrease in EPSP amplitude and a shift in the latency of the peak amplitude. Tectothalamic EPSPs were abolished in the presence of both APV and CNQX. C: with increasing stimulation intensity, tectothalamic EPSPs show a graded increase in amplitude and a small decrease in latency. D: graph shows the average tecto-LPN EPSP amplitudes and latencies as a function of stimulation intensity for a sample of 7 cells.
Current pulses of 50 μs were generated with a stimulator (Grass S88; Grass Technologies, West Warwick, RI) that was connected to a stimulus isolation unit (A365; WPI) that controlled current intensity (100–3,000 μA). Stimulus frequency was controlled by computer using pClamp 8.2 software (MDS Analytical Technologies). To measure short-term plasticity, repetitive stimuli were delivered in trains of 20 pulses of variable frequency (0.5–10 Hz). The responses to five trains delivered in 10-s intervals were averaged. To examine long-term plasticity, 100-Hz current pulses were delivered for a period of 0.5 s and then current pulses were delivered after 5, 10, 15, and 20 min (the average of five current pulses in 5-s intervals was recorded for each time point). EPSP amplitudes were measured using pClamp 8.2 software. EPSP amplitudes were calculated as the difference between the membrane voltage 2 ms before the stimulus and the peak of the synaptic response. For the stimulus trains, the amplitudes of each EPSP of the 20-pulse train were quantified relative to the amplitude of the first EPSP of the train. For long-term plasticity experiments, the amplitudes of EPSPs generated after high-frequency stimulation were quantified relative to the amplitudes of EPSPs generated just prior to high-frequency stimulation.
Depolarization of the membrane potential caused by application of SP or 100 Hz SC stimulation was compensated for by current injection to maintain preapplication/stimulation potential levels. Input resistance changes were evaluated by comparing the voltage response to square-wave current pulses prior to and 10 min following SP application of 100-Hz SC stimulation. Voltage responses were also recorded in response to brief (20 ms) application of glutamate (100 μM) from a pipette (tip diameter: 8–12 μm) placed close to the recording electrode. The glutamate was ejected from the pipette using a PV83 pneumatic picopump (WPI), with the pressure adjusted to elicit a stable pre-SP response of >1 mV. Student's t-tests or ANOVA single-factor analyses were used to test for statistical significance. Quantitative data are expressed as means ± SD.
RESULTS
SP is presynaptic and NK1 is postsynaptic in the LPN
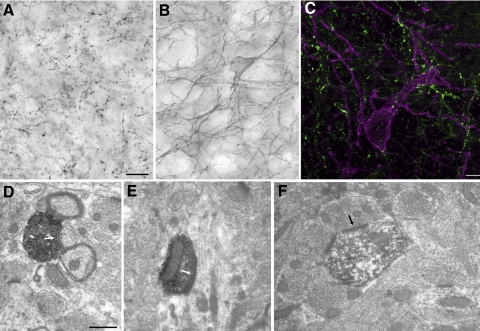
Immunohistochemical staining for both SP and NK1 was densely distributed in the caudal and lateral regions of the LPN, which we previously identified as the tectorecipient zone of the LPN (Masterson et al. 2009). The SP antibody stained boutons (Fig. 1A), whereas the NK1 antibody stained dendrites and occasional somata (Fig. 1B). Double staining with both antibodies revealed that SP-positive boutons were closely associated with NK1-stained cells and SP-positive boutons did not stain for NK1 (Fig. 1C).
Fig. 1.
Substance P (SP) is presynaptic and neurokinin 1 (NK1) is postsynaptic in the lateral posterior nucleus (LPN). A: an antibody against SP stains terminal boutons in the LPN. B: an antibody against NK1 stains dendrites and occasional somata in the LPN. C: a 12 μm thick confocal image of tissue from the caudal LPN stained with NK1 and SP antibodies. An NK1-stained neuron (purple) is surrounded by SP-stained terminals (green). There was no double-labeling of NK1 and SP, indicating that the NK1 receptors are not located on SP terminals. D–F: electron micrographs of the LPN illustrate that SP is located in terminal boutons that synapse (white arrows) with dendrites (D, E) and NK1 receptors are present on postsynaptic dendrites (F). Scale bars: 10 μm in A (applies to B), 10 μm in C, and 0.5 μm in D (applies to E and F).
To confirm that SP is confined to axon terminals and NK1 receptors are located postsynaptically, we prepared SP- and NK1-stained tissue for electron microscopy. An ultrastructural analysis of a sample of 100 profiles stained with the SP antibody revealed that all SP staining was confined to synaptic boutons (identified by the presence of synaptic vesicles; Fig. 1, D and E). In contrast, a sample of 100 profiles stained with the NK1 antibody revealed that the NK1 receptor was expressed by dendrites postsynaptic to unstained terminals (Fig. 1F) and occasional somata. Importantly, no NK1-stained profiles in the LPN contained synaptic vesicles, suggesting that SP activates postsynaptic NK1 receptors in the LPN.
Tecto-LPN terminals contain SP
We measured SP-stained terminals in electron micrographs to compare their sizes to that of cortico-LPN and tecto-LPN terminals labeled by anterograde transport, as well as profiles stained for the type 1 and type 2 vesicular glutamate transporters (vGLUT1 and vGLUT2) analyzed in our previous study (Masterson et al. 2009). The minor axis of 100 SP-stained profiles involved in synapses (0.71 ± 0.24 μm) was not significantly different from the minor axis of tecto-LPN terminals involved in synapses (0.76 ± 0.22 μm) or vGLUT2-stained terminals involved in synapses (0.72 ± 0.24 μm). In contrast, synaptic SP-stained profiles were significantly larger than synaptic cortico-LPN terminals (0.43 ± 0.13 μm; P = 5.5 × 10⁻¹¹) and synaptic vGLUT1-stained terminals (0.43 ± 0.09 μm; P = 1 × 10⁻¹²). This suggests that tecto-LPN terminals contain SP and cortico-LPN terminals do not contain SP.
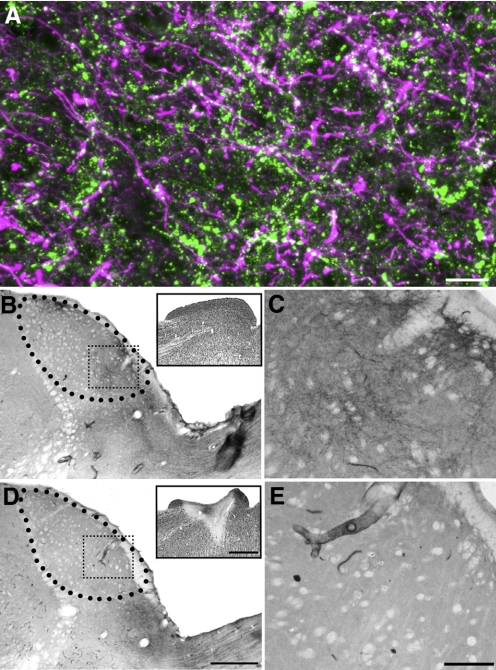
To determine whether tectothalamic axons contain substance P, we stained tissue that contained BDA-labeled tecto-LPN axons for substance P and examined the LPN using a confocal microscope. Individual boutons double-labeled for BDA and SP were identified (Fig. 2A), indicating that at least a subset of tecto-LPN boutons contain substance P. Finally, ibotenic acid lesions of the SC diminished substance P staining in the ipsilateral, but not the contralateral, LPN (Fig. 2, B–E).
Fig. 2.
Tecto-LPN terminals contain SP. A: a large injection of biotinylated dextran amine (BDA) was made in the superficial layers of the superior colliculus (SC) to label axons in the LPN by anterograde transport. LPN tissue was subsequently treated to reveal the tecto-LPN axons and SP. A 10 μm thick confocal image of the caudal LPN illustrates the overlap of tecto-LPN axons (purple) and terminals that contain SP (green). The white areas of the image indicate tecto-LPN terminals that contain SP. B–F: the excitatory neurotoxin ibotenic acid was injected unilaterally into the SC. SP staining in the LPN contralateral to the ibotenic acid injection was densely concentrated in the caudal portion of the nucleus, as in normal rats (B, boxed region shown at higher magnification in C). The inset shows neurons visualized with the NeuN antibody in the SC. SP staining was absent in the LPN ipsilateral to the ibotenic acid injection (D, boxed regions shown at higher magnification in E). The inset shows the lesion in the SC caused by the ibotenic acid injection in a section stained with NeuN. Scale bars: 5 μm in A, 500 μm in D (also applies to B), 1 mm in D, inset (also applies to B, inset), and 25 μm in E (also applies to C).
Stimulation of cortico-LPN and tecto-LPN inputs in slices
As schematically illustrated in Fig. 3A, to compare the synaptic responses of LPN neurons to stimulation of their cortical or tectal inputs, whole cell recordings were obtained from neurons in the caudal/lateral LPN (tectorecipient zone; Masterson et al. 2009) in 400 μm thick parasagittal sections maintained in vitro and EPSPs were recorded following stimulation of the optic radiations (CTX) or SC. All recorded neurons were identified as regular spiking (RS) projection neurons based on their pattern of firing in response to current pulses (Li et al. 2003a). Although our previous anatomical results suggest that projection neurons within the tectorecipient zone receive both tectal input on their proximal dendrites and cortical input on their distal dendrites, not all inputs can be preserved and/or activated within the reduced slice preparation. Nevertheless, tectal or cortical EPSPs could be evoked in over half of the recorded cells (47 of 78, or 60.3%, of cells tested for cortical input and 53 of 96, or 55.2%, of cells tested for tectal input). We attribute this relatively high success rate to the use of the eight electrode arrays that spanned a distance of 1 mm. Although we were not able to move the arrays once a whole cell recording was obtained, stimulation could be produced between any two electrodes in the array and the anode and cathode positions were varied to obtain the best response.
Cortico-LPN and tecto-LPN inputs are glutamatergic and convergent
We previously determined that stimulation of the optic radiations activates both NMDA and AMPA/kainate receptors in the LPN (Li et al. 2003b). To test whether these receptors are also activated by the stimulation of tectothalamic fibers, we stimulated the SC in the presence of the NMDA receptor antagonist APV or the AMPA/kainate receptor antagonist CNQX (Fig. 3B). APV caused a significant decrease in EPSP peak amplitude (39 ± 12%; n = 4, P = 0.040) and shift in the latency of the peak amplitude from 11.3 ± 2.1 to 8.5 ± 1.6 ms (n = 4, P = 8.1 × 10⁻⁴). The AMPA/kainate receptor antagonist CNQX also caused a decrease in EPSP amplitude (60 ± 19%; n = 6, P = 0.016) and a shift in the latency of peak amplitude (10.4 ± 2.3 to 17.8 ± 2.8 ms, n = 6, P = 3.4 × 10⁻⁵).
As previously reported, all CTX EPSP amplitudes in the tectorecipient zone of the LPN increased in a graded manner as the stimulation intensity was increased (Li et al. 2003b). Similarly, SC EPSP amplitudes increased with increasing stimulation current (Fig. 3, C and D, n = 7). In addition, SC EPSP latencies decreased as the stimulation intensity was increased (Fig. 3D), a feature we previously reported for corticothalamic EPSPs in the tectorecipient LPN (Li et al. 2003b). These results suggest that LPN neurons receive multiple convergent cortical and tectal inputs.
Tecto-LPN and cortico-LPN EPSPs display distinct short-term synaptic plasticity
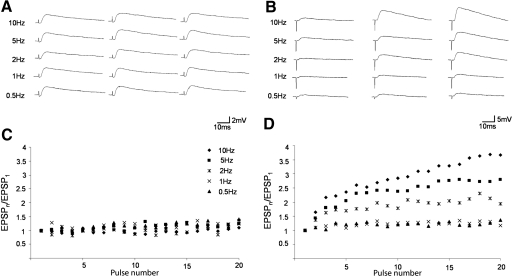
The short-term frequency dependence of tecto-LPN and cortico-LPN EPSPs was tested using stimulation intensities that evoked stable EPSPs, with initial amplitudes of ≥1 mV. Tecto-LPN fibers were stimulated with 20-pulse trains at frequencies of 0.5, 1, 2, 5, and 10 Hz. For each frequency, an ANOVA was performed comparing the amplitudes of EPSPs within the pulse train. Repetitive stimulation of tecto-LPN fibers produced no significant differences between EPSP amplitudes at any frequency (Fig. 4, A and C, n = 40; 10 Hz: P = 0.85; 5 Hz: P = 0.90; 2 Hz: P = 0.90; 1 Hz: P = 0.99; 0.5 Hz: P = 0.51; ANOVA single factor). A similar analysis of cortico-LPN EPSPs revealed no significant differences between EPSP amplitudes at frequencies of 0.5 and 1 Hz. However, stimulation frequencies of 2, 5, and 10 Hz showed significant facilitation within the 20-pulse trains (Fig. 4, B and D, n = 39; 2–10 Hz: P < 0.001; 1 Hz: P = 0.80; 0.5 Hz: P = 1.0; ANOVA single factor).
Fig. 4.
Tecto-LPN and cortico-LPN EPSPs display distinct short-term synaptic plasticity. Stimulation experiments consisted of 20 pulses at 0.5, 1, 2, 5, and 10 Hz. A: EPSPs 1, 10, and 20 from a SC stimulation experiment. Stimulation of tectal fibers produced EPSPs with stable amplitudes. B: EPSPs 1, 10, and 20 from a CTX stimulation experiment. Stimulation of cortical fibers produced EPSPs that showed frequency-dependent facilitation. C and D: each point represents the normalized average of EPSPs evoked in 35 cells by 20 pulses at 0.5, 1, 2, 5, and 10 Hz. The EPSP amplitudes were normalized by dividing the EPSP amplitude evoked by each pulse in the train (EPSPn) by the EPSP amplitude evoked by the first pulse of the train (EPSP1). C: tectothalamic experiments. D: corticothalamic experiments.
SP increases the amplitude of cortico-LPN and tecto-LPN EPSPs
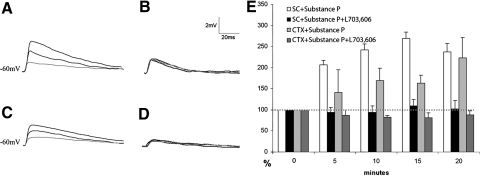
We next tested whether the exogenous application of SP affected CTX or SC responses. Control EPSPs were recorded and then the slice was bathed for 20 min with ACSF that contained 2 μM SP. EPSP amplitudes were recorded at 5, 10, 15, and 20 min after the initial addition of SP to the ACSF. Application of SP increased the SC EPSP amplitudes in 21 of 34 cells tested and CTX EPSP amplitudes in 9 of 17 cells tested. The average increase in EPSP amplitude of the responding cells and the time course of these increases are illustrated in Fig. 5.
Fig. 5.
Substance P increases the amplitude of cortico-LPN and tecto-LPN EPSPs. SP or SP and the NK1 antagonist L-703,606 were bath applied during in vitro whole cell recordings and stimulation of tecto-LPN axons (SC) or cortico-LPN axons (CTX). In A–D the gray trace is the control EPSP (0 min) and the darker traces are EPSPs 10 and 20 min after application of SP or SP and L-703,606. A: EPSPs generated by SC stimulation before and after SP application. B: EPSPs generated by SC stimulation before and after SP and L-703,606 application. C: EPSPs generated by CTX stimulation before and after SP application. D: EPSPs generated by CTX stimulation before and after in the SP and L-703,606. E: the histogram illustrates the potentiation of SC and CTX evoked EPSPs at 5, 10, 15, and 20 min after SP application expressed as a percentage of control values (0 min).
After 5-min exposure to SP, SC responses (white bars in Fig. 5E, n = 21) increased by an average of 2.1-fold after 5 min, 2.4-fold after 10 min, 2.7-fold after 15 min, and 2.4-fold after 20 min. All of these post-SP responses were significantly different from responses recorded before SP application (P < 0.05). In the presence of SP, CTX responses (light gray bars in Fig. 5E, n = 9) increased by an average of 1.4-fold after 5 min, 1.7-fold after 10 min, 1.6-fold after 15 min, and 2.2-fold after 20 min. All of these post-SP responses were significantly different from responses recorded before SP application (P < 0.05).
SP effects are mediated by postsynaptic NK1 receptors
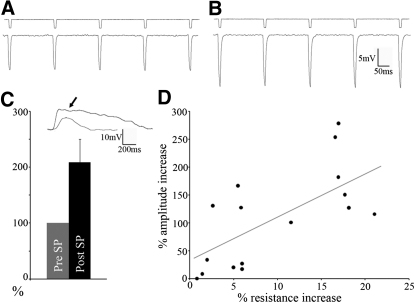
When the NK1 antagonist L-703,606 (5 μM) was added simultaneously with the SP, CTX (n = 5, dark gray bars in Fig. 5) and SC (n = 9, black bars in Fig. 5) EPSP amplitudes were not significantly different from control responses (0 min; P > 0.3 for amplitudes 5, 10, 15, and 20 min post-SP + L-703,606), indicating that the SP effect is mediated through the NK1 receptors that are distributed on LPN cells (Fig. 1). A postsynaptic effect is also supported by the fact that 10 min after SP application the average input resistance of the recorded neurons (122 ± 77 MΩ) increased significantly (235 ± 87 MΩ; n = 21, P < 0.05). This is illustrated in Fig. 6, A and B as an increase in the voltage responses to 10-ms, 50-pA hyperpolarizing current pulses after 10 min of bath application of SP. In addition, the amplitude of voltage responses to the brief (20 ms) application of glutamate from the tip of an adjacent pipette increased significantly after 10 min of SP bath application (Fig. 6C). This increase in the peak amplitude of glutamate responses was correlated with the increase in input resistance (Fig. 6D; n = 16, r = 0.68).
Fig. 6.
SP effects are mediated by postsynaptic NK1 receptors. Voltage responses of LPN neurons (bottom traces) to 10-ms, 50-pA hyperpolarizing current pulses (top traces, A) increase after 10 min of bath application of SP (B). C: the amplitudes of LPN neuron voltage responses to brief (20 ms) application of glutamate (bottom trace) are increased following 10 min of bath application of SP (top trace indicated by arrow). The histogram illustrates the average increase in peak amplitude expressed as a percentage of control amplitudes (n = 16). D: the increase in response to glutamate application is correlated with an increase in input resistance (r = 0.68).
SP is released from tecto-LPN terminals by high-frequency stimulation
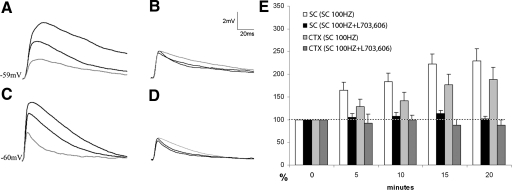
We next tested whether high-frequency stimulation (100 Hz for 0.5 s) of the SC or CTX resulted in EPSP amplitude changes. In 28 of 40 cells tested, high-frequency stimulation of the SC resulted in a gradual increase in tectal EPSP amplitudes, which peaked 20 min poststimulation an average of 2.4-fold above baseline (white bars in Fig. 7 histogram). Analysis of all responding cells (n = 28) revealed that poststimulation amplitudes were significantly larger than prestimulation amplitudes (P = 0.5 × 10⁻⁴ at 5 min, P = 3 × 10⁻⁵ at 10 min, P = 1 × 10⁻⁵ at 15 min, and P = 0.015 at 20 min poststimulation, compared with control). These increases were completely blocked when the NK1 antagonist L-703,606 was applied to the bath during the high-frequency stimulation and for the 20 min following stimulation during which the EPSP amplitude measurements were obtained (n = 10; black bars in Fig. 7E; P = 0.26 at 5 min, P = 0.16 at 10 min, P = 0.16 at 15 min, and P = 0.31 at 20 min poststimulation + L-703,606, compared with control).
Fig. 7.
High-frequency stimulation of tecto-LPN axons increases the amplitude of subsequent tecto- and cortico-LPN EPSPs. In cells that responded to stimulation of both tecto-LPN (SC) and cortico-LPN (CTX) axons, tecto-LPN axons were stimulated at a frequency of 100 Hz for 0.5 s and the amplitudes of subsequent EPSPs evoked by single SC or CTX stimulus pulses were monitored. In A–D the gray trace is the control EPSP and the darker traces are EPSPs 10 and 20 min after 100-Hz SC stimulation. A: EPSPs generated by SC stimulation before and after 100 Hz SC stimulation. B: EPSPs generated by SC stimulation before and after 100-Hz SC stimulation in the presence of the NK1 antagonist L-703,606. C: EPSPs generated by CTX stimulation before and after 100-Hz SC stimulation. D: EPSPs generated by CTX stimulation after 100-Hz SC stimulation in the presence of L-703,606. E: the histogram illustrates the potentiation of SC and CTX evoked EPSPs at 5, 10, 15, and 20 min after 100-Hz SC stimulation expressed as a percentage of control values (0 min).
In our slice preparation, in roughly 20% of the recorded neurons both CTX and SC stimulation electrodes evoked stable EPSPs in the same cell. In these cells we tested whether high-frequency SC stimulation affected CTX EPSP amplitudes. In 10 of 18 cells tested, we found that high-frequency SC stimulation resulted in the subsequent facilitation of CTX responses in the same cell (≤1.9-fold after 20 min, light gray bars in Fig. 7E). Analysis of all responding cells (n = 10) revealed that at 10, 15, and 20 min poststimulation, amplitudes were significantly larger than prestimulation amplitudes (P = 0.079 at 5 min, P = 0.04 at 10 min, P = 0.042 at 15 min, P = 0.031 at 20 min poststimulation, compared with control) and this effect was blocked by the simultaneous application of L-703,606 to the bath (n = 6; dark gray bars in Fig. 7E; P = 0.38 at 5 min, P = 0.48 at 10 min, P = 0.25 at 15 min, and P = 0.052 at 20 min poststimulation + L-703,606, compared with control). The effect of high-frequency SC stimulation on neuron input resistance was similar to that seen following SP application (from 193 ± 86 to 251 ± 98 MΩ; n = 28, P < 0.05).
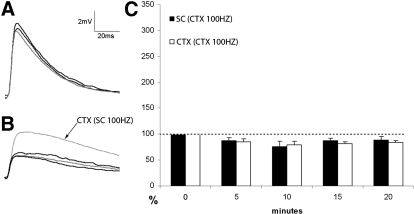
We also tested the effects of high-frequency CTX stimulation on cells that responded to both SC and CTX stimulation (n = 9). As illustrated in Fig. 8, high-frequency CTX stimulation did not increase cortical or tectal EPSP amplitudes of LPN neurons >5 min poststimulation. In fact, CTX and SC EPSP amplitudes were slightly smaller than control (0 min) amplitudes and this was found to be significant (P < 0.05) at all poststimulation time points.
Fig. 8.
High-frequency stimulation of cortico-LPN input does not change the amplitude of subsequent tecto- or cortico-LPN EPSPs. In cells that responded to stimulation of both tecto-LPN (SC) and cortico-LPN (CTX) axons, cortico-LPN axons were stimulated at a frequency of 100 Hz for 0.5 s and the amplitudes of subsequent EPSPs evoked by single SC or CTX stimulus pulses were monitored. In A and B, the gray trace is the control EPSP and the darker traces are EPSPs 10 and 20 min after 100-Hz CTX stimulation. A: EPSPs generated by SC stimulation before and after 100-Hz CTX stimulation. B: EPSPs generated by CTX stimulation before and after 100-Hz CTX stimulation. At the completion of the experiment, the SC was then stimulated at 100 Hz for 0.5 s. The dotted trace (arrow) indicates the subsequent potentiation of the CTX EPSP. C: the histogram illustrates that there was no increase in the amplitudes of SC or CTX evoked EPSPs at 5, 10, 15, and 20 min after 100-Hz CTX stimulation. Amplitudes expressed as a percentage of control values (0 min).
DISCUSSION
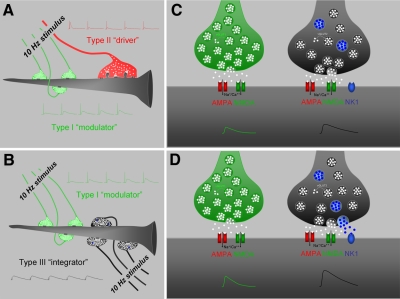
As schematically illustrated in Fig. 9, our results indicate that SC-LPN terminals contain both glutamate and SP. At stimulation frequencies ≤10 Hz, glutamate is released, which activates both NMDA and AMPA receptors on postsynaptic neurons. The resulting glutamatergic SC-LPN EPSPs show little frequency-dependent plasticity. In contrast to CTX-LPN EPSPs, which show frequency-dependent facilitation, there was no significant difference between SC-LPN EPSP amplitudes generated by 1-, 2-, 5-, or 10-Hz stimulus trains. However, after high-frequency (100 Hz) stimulation, SP is released from SC-LPN terminals, which activates NK1 receptors on postsynaptic neurons. The activation of NK1 receptors leads to a subsequent potentiation of both SC- and CTX-evoked responses in the postsynaptic neuron. As discussed in the following text, the unique properties of SC-LPN synaptic terminals may produce amplified responses to threatening visual images.
Fig. 9.
Schematic summary of rat LPN glutamatergic synapses. A: in the rostral LPN, projection cells receive input to their proximal dendrites from a small number of large terminals with round vesicles (RL profiles, red) that originate from cortical layer V and input to their distal dendrites from a large number of small terminals with round vesicles (RS profiles, green) that originate from cortical layer VI (Li et al. 2003c). Stimulation of RL profiles at 10 Hz produces EPSPs that depress (type II responses, red), characteristic of “driver” inputs (Li et al. 2003b; Sherman and Guillery 1998), whereas stimulation of RS profiles at 10 Hz produces facilitating EPSPs (type I responses, green), characteristic of “modulator” inputs (Li et al. 2003b; Sherman and Guillery 1998). B: in the caudal LPN, projection cells receive input to their proximal dendrites from a large number of medium-sized terminals with round vesicles (RM profiles, black) that originate from the SC and input to their distal dendrites from a large number of small terminals with round vesicles (RS profiles, green) that originate from cortical layer VI (Masterson et al. 2009). Stimulation of RM profiles at 10 Hz produces EPSPs that do not depress or facilitate (type III responses, black), characteristic of “integrator” inputs (Smith et al. 2007), whereas stimulation of RS profiles at 10 Hz produces facilitating EPSPs (type I responses, green), characteristic of “modulator” inputs. C: glutamate (white squares) is transported into vesicles within RS (green) and RM (black) profiles by the type I (vGLUT1) and type II (vGLUT2) vesicular glutamate transporters, respectively (Masterson et al. 2009). When stimulated at frequencies ≤10 Hz, glutamate release activates postsynaptic AMPA and NMDA receptors. D: when stimulated at high frequency (100 Hz), RM profiles additionally release SP (blue circles), which activates postsynaptic NK1 receptors and increases the amplitudes of subsequent glutamatergic postsynaptic responses (represented by the green and black traces).
Tectothalamic synapses: a third type of glutamatergic response
Previous studies of the dorsal thalamus have identified two main types of glutamatergic synaptic responses. The majority of inputs to the dorsal thalamus originate from cortical layer VI (type I inputs) (Guillery 1969). In vitro studies of a variety of thalamic nuclei have consistently shown that the EPSPs elicited by stimulation of layer VI corticothalamic inputs increase in a graded manner with increasing stimulation intensity and facilitate at frequencies of ≥2 Hz (Granseth et al. 2002; Turner and Salt 1998). In contrast, EPSPs generated by stimulation of ascending sensory inputs or inputs that originate from cortical layer V (type II inputs) show an all-or-none increase in amplitude with increasing stimulation levels and are depressed at stimulation frequencies of ≥2 Hz (Arsenault and Zhang 2006; Chen and Regehr 2000; Chen et al. 2002; Granseth et al. 2002; Li et al. 2003c; Reichova and Sherman 2004; Turner and Salt 1998).
In the current study, all CTX EPSPs increased in amplitude with increasing stimulation current and showed a robust frequency-dependent facilitation, consistent with all previous studies of layer VI corticothalamic responses. In contrast, the SC EPSPs in the LPN were unlike either type I or type II synaptic responses in that their amplitudes remained relatively constant at stimulation frequencies ≤10 Hz. Very similar responses have been recorded in the paralaminar thalamic nuclei (adjacent to the medial geniculate nucleus) following stimulation of the SC (Smith et al. 2007).
Like type I corticothalamic inputs, SC EPSPs show a graded increase in amplitude with increasing levels of stimulation current. This likely reflects the convergence of multiple tectal axons onto single LPN neurons. Previous studies indicate that the tecto-LPN projection in the rodent is nontopographic (Mooney et al. 1984) and our previous electron microscopic observations indicate that multiple tectal terminals innervate individual dendrites (Masterson et al. 2009). This supports the idea that LPN cells may integrate converging inputs from multiple tecto-LPN cells.
Smith et al. (2007) recently proposed that inputs from the SC and inferior colliculus to the paralaminar neurons be called “integrators” to distinguish them from the type I and type II glutamatergic synaptic responses, which Sherman and Guillery (1998) have defined as “modulating” and “driving” inputs, respectively. Smith et al. (2007) further proposed that it may be the collective activities of multiple convergent integrator inputs that are critical for the formation of the postsynaptic neuron's receptive field. This concept fits well with the known properties of the LPN; receptive fields within the tectorecipient LPN are much larger than those recorded in the superficial layers of the SC where tecto-LPN cells are located (Abramson and Chalupa 1988; Casanova and Molotchnikoff 1990; Chalupa et al. 1983; Hilbig et al. 2000; Hutsler and Chalupa 1991; Ling et al. 1997; Major et al. 2000). In the hamster, Mooney et al. (1984) demonstrated that receptive fields of LPN cells are on average 10-fold larger than those of tecto-LPN cells.
Substance P release in the LPN
We also found that tectothalamic synapses are distinguished from type I and type II glutamatergic synapses in that they release SP when stimulated at high frequencies. This is similar to the frequency-dependent release of SP in the spinal cord (Adelson et al. 2009; Go and Yaksh 1987), substantia nigra (Diez-Guerra et al. 1988), and intestinal tract (Baron et al. 1983). In the LPN, a recent study demonstrated that SP reduces a K+ conductance, likely Kleak, via NK1 receptors (Paul and Cox 2010). The increases in input resistance that we identified following bath application of SP or high-frequency stimulation of the SC are consistent with this action. The net result of SP release from tectothalamic terminals is an increase in the response of postsynaptic neurons to all glutamatergic synaptic inputs.
Our studies suggest that when tectothalamic neurons fire at frequencies ≤10 Hz, glutamate is released and LPN neurons reliably respond to stimulus trains, without facilitation or depression. In contrast, when tectothalamic neurons fire at high frequency, SP is released in addition to glutamate, which amplifies the subsequent postsynaptic LPN neuronal responses to both tectal and cortical inputs. In vivo studies indicate that neurons in the superficial layers of the SC can fire at very high frequencies. In the anesthetized rat, firing rates of ≤120 Hz have been recorded in superficial layers of the SC (Prevost et al. 2007) and, in the awake behaving monkey, firing rates of ≥250 Hz have been recorded in the superficial SC (Wurtz and Mohler 1976). Thus our stimulation parameters are well within the normal firing range of SC neurons.
Functional implications
A variety of studies have concluded that SP is released in response to stressful stimuli and SP antagonists have been suggested to be an important therapeutic target for depression and/or anxiety (e.g., Ebner et al. 2009). We hypothesize that the release of SP from tectothalamic terminals may similarly function to increase reactions to threatening visual stimuli.
We recently studied the tectal projections to the dorsal (Pd) and central pulvinar nucleus (Pc) of the tree shrew (Chomsung et al. 2008). Luppino et al. (1988) first described these projections as “diffuse” and “specific,” respectively. By using a combination of anterograde and retrograde tracing techniques, as well as electron microscopy, we concluded that both the Pd and Pc receive topographic (specific) projections from the SC and the Pd receives additional nontopographic (diffuse) projections, possibly arising from convergent axon collaterals. Because we also found that the Pd (but not the Pc) projects to the amygdala, we suggested that the diffuse tectopulvinar projections are involved in coding the movement of large or threatening objects to initiate escape responses, whereas the specific tectopulvinar projections are involved in coding the precise location of small moving objects to initiate orienting or pursuit responses (Chomsung et al. 2008).
Whether a small portion of the rat LPN receives topographic connections from the SC (comparable to the tree shrew Pc) remains an open question. This is difficult to test because the tectorecipient zone of the rat LPN is quite small compared with the large tectorecipient zones of the tree shrew pulvinar nucleus. However, both anatomical and physiology studies indicate that the majority of the LPN is organized in a nontopographic manner and that LPN neurons have very large receptive fields (Mooney et al. 1984).
Mooney et al. (1984) suggested the LPN neurons respond to visual events, such as the appearance of novel objects, rather than the specific features of visual stimuli. In particular, the majority of LPN neurons that could be antidromically driven from the SC responded best to visual stimuli moving across their receptive fields, similar to the responses of SC-LPN neurons, which have been classified as movement-sensitive wide-field vertical cells (Mooney et al. 1988). Convergent input from multiple wide-field vertical cells likely accounts for the LPN cells' sensitivity to movement across widespread regions of the visual field. This organization makes the LPN well suited to signal the appearance of potential danger.
There also appears to be good overlap between tecto-LPN projections, regions of the LPN that project to the amygdala (Doron and Ledoux 1999, 2000), and regions innervated by terminals that contain SP. Similarly, the paralaminar nuclei, which also receive “integrator” inputs from the SC (Smith et al. 2007), project to the amygdala (Doron and Ledoux 1999, 2000) and are innervated by SP fibers (unpublished data). Thus the tectorecipient zone of the LPN may be part of a complex of nuclei that receive convergent tectal inputs and project to the amygdala. In this context, our results suggest that the SP-mediated potentiation of synaptic inputs may serve to amplify responses to threatening objects that move across large regions of the visual field.
GRANTS
This work was supported by National Institute of Neurological Disorders and Stroke Grants R01-NS-35377 and F31-NS-052012.
DISCLOSURES
No conflicts of interest, financial or otherwise, are declared by the author(s).
ACKNOWLEDGMENTS
We thank A. Slusarczyk for expert technical assistance.
Present address of J. Li: The Scripps Research Institute, Department of Cell Biology, 10550 North Torrey Pines Road, La Jolla, CA 92037.
REFERENCES
- Abramson BP, Chalupa LM. Multiple pathways from the superior colliculus to the extrageniculate visual thalamus of the cat. J Comp Neurol 271: 397– 418, 1988 [DOI] [PubMed] [Google Scholar]
- Adelson D, Lao L, Zhang G, Kim W, Marvizon JC. Substance P release and neurokinin 1 receptor activation in the rat spinal cord increase with the firing frequency of C-fibers. Neuroscience 161: 538– 553, 2009 [DOI] [PMC free article] [PubMed] [Google Scholar]
- Arsenault D, Zhang ZW. Developmental remodelling of the lemniscal synapse in the ventral basal thalamus of the mouse. J Physiol 573: 121– 132, 2006 [DOI] [PMC free article] [PubMed] [Google Scholar]
- Baron SA, Jaffe BM, Gintzler AR. Release of substance P from the enteric nervous system: direct quantitation and characterization. J Pharmacol Exp Ther 227: 365– 368, 1983 [PubMed] [Google Scholar]
- Brill J, Kwakye G, Huguenard JR. NPY signaling through Y1 receptors modulates thalamic oscillations. Peptides 28: 250– 256, 2007 [DOI] [PMC free article] [PubMed] [Google Scholar]
- Casanova C, Molotchnikoff S. Influence of the superior colliculus on visual responses of cells in the rabbit' S lateral posterior nucleus. Exp Brain Res 80: 387– 396, 1990 [DOI] [PubMed] [Google Scholar]
- Castro-Alamancos MA, Calcagnotto ME. Presynaptic long-term potentiation in corticothalamic synapses. J Neurosci 19: 9090– 9097, 1999 [DOI] [PMC free article] [PubMed] [Google Scholar]
- Chalupa LM, Williams RW, Hughes MJ. Visual response properties in the tectorecipient zone of the cat's lateral posterior–pulvinar complex: a comparison with the superior colliculus. J Neurosci 3: 2587– 2596, 1983 [DOI] [PMC free article] [PubMed] [Google Scholar]
- Chen C, Blitz DM, Regehr WG. Contributions of receptor desensitization and saturation to plasticity at the retinogeniculate synapse. Neuron 33: 779– 788, 2002 [DOI] [PubMed] [Google Scholar]
- Chen C, Regehr WG. Developmental remodeling of the retinogeniculate synapse. Neuron 28: 955– 966, 2000 [DOI] [PubMed] [Google Scholar]
- Chen C, Regehr WG. Presynaptic modulation of the retinogeniculate synapse. J Neurosci 23: 3130– 3135, 2003 [DOI] [PMC free article] [PubMed] [Google Scholar]
- Chomsung RD, Petry HM, Bickford ME. Ultrastructural examination of diffuse and specific tectopulvinar projections in the tree shrew. J Comp Neurol 510: 24– 46, 2008 [DOI] [PMC free article] [PubMed] [Google Scholar]
- Cox CL, Huguenard JR, Prince DA. Peptidergic modulation of intrathalamic circuit activity in vitro: actions of cholecystokinin. J Neurosci 17: 70– 82, 1997 [DOI] [PMC free article] [PubMed] [Google Scholar]
- Diez-Guerra FJ, Sirinathsinghji DJ, Emson PC. In vitro and in vivo release of neurokinin A-like immunoreactivity from rat substantia nigra. Neuroscience 27: 527– 536, 1988 [DOI] [PubMed] [Google Scholar]
- Doron NN, Ledoux JE. Organization of projections to the lateral amygdala from auditory and visual areas of the thalamus in the rat. J Comp Neurol 412: 383– 409, 1999 [PubMed] [Google Scholar]
- Doron NN, Ledoux JE. Cells in the posterior thalamus project to both amygdala and temporal cortex: a quantitative retrograde double-labeling study in the rat. J Comp Neurol 425: 257– 274, 2000 [PubMed] [Google Scholar]
- Ebner K, Sartori SB, Singewald N. Tachykinin receptors as therapeutic targets in stress-related disorders. Curr Pharm Des 15: 1647– 1674, 2009 [DOI] [PubMed] [Google Scholar]
- Go VL, Yaksh TL. Release of substance P from the cat spinal cord. J Physiol 391: 141– 167, 1987 [DOI] [PMC free article] [PubMed] [Google Scholar]
- Govindaiah G, Cox CL. Modulation of thalamic neuron excitability by orexins. Neuropharmacology 51: 414– 425, 2006 [DOI] [PubMed] [Google Scholar]
- Granseth B, Ahlstrand E, Lindstrom S. Paired pulse facilitation of corticogeniculate EPSCs in the dorsal lateral geniculate nucleus of the rat investigated in vitro. J Physiol 544: 477– 486, 2002 [DOI] [PMC free article] [PubMed] [Google Scholar]
- Guillery RW. The organization of synaptic interconnections in the laminae of the dorsal lateral geniculate nucleus of the cat. Z Zellforsch Mikrosk Anat 96: 1– 38, 1969 [DOI] [PubMed] [Google Scholar]
- Hilbig H, Bidmon HJ, Ettrich P, Muller A. Projection neurons in the superficial layers of the superior colliculus in the rat: A topographic and quantitative morphometric analysis. Neuroscience 96: 109– 119, 2000 [DOI] [PubMed] [Google Scholar]
- Hutsler JJ, Chalupa LM. Substance P immunoreactivity identifies a projection from the cat's superior colliculus to the principal tectorecipient zone of the lateral posterior nucleus. J Comp Neurol 312: 379– 390, 1991 [DOI] [PubMed] [Google Scholar]
- Lee SH, Cox CL. Excitatory actions of vasoactive intestinal peptide on mouse thalamocortical neurons are mediated by VPAC2 receptors. J Neurophysiol 96: 858– 871, 2006 [DOI] [PubMed] [Google Scholar]
- Lee SH, Cox CL. Excitatory actions of peptide histidine isoleucine on thalamic relay neurons. Neuropharmacology 55: 1329– 1339, 2008 [DOI] [PMC free article] [PubMed] [Google Scholar]
- Li J, Bickford ME, Guido W. Distinct firing properties of higher order thalamic relay neurons. J Neurophysiol 90: 291– 299, 2003a [DOI] [PubMed] [Google Scholar]
- Li J, Guido W, Bickford ME. Two distinct types of corticothalamic EPSPs and their contribution to short-term synaptic plasticity. J Neurophysiol 90: 3429– 3440, 2003b [DOI] [PubMed] [Google Scholar]
- Li J, Wang S, Bickford ME. Comparison of the ultrastructure of cortical and retinal terminals in the rat dorsal lateral geniculate and lateral posterior nuclei. J Comp Neurol 460: 394– 409, 2003c [DOI] [PubMed] [Google Scholar]
- Lindstrom S, Wrobel A. Frequency dependent corticofugal excitation of principal cells in the cat' S dorsal lateral geniculate nucleus. Exp Brain Res 79: 313– 318, 1990 [DOI] [PubMed] [Google Scholar]
- Ling C, Schneider GE, Northmore D, Jhaveri S. Afferents from the colliculus, cortex, and retina have distinct terminal morphologies in the lateral posterior thalamic nucleus. J Comp Neurol 388: 467– 483, 1997 [PubMed] [Google Scholar]
- Luppino G, Matelli M, Carey RG, Fitzpatrick D, Diamond IT. New view of the organization of the pulvinar nucleus in Tupaia as revealed by tectopulvinar and pulvinar-cortical projections. J Comp Neurol 273: 67– 86, 1988 [DOI] [PubMed] [Google Scholar]
- Major DE, Luksch H, Karten HJ. Bottlebrush dendritic endings and large dendritic fields: motion-detecting neurons in the mammalian tectum. J Comp Neurol 423: 243– 260, 2000 [PubMed] [Google Scholar]
- Masterson SP, Li J, Bickford ME. Synaptic organization of the tectorecipient zone of the rat lateral posterior nucleus. J Comp Neurol 515: 647– 663, 2009 [DOI] [PMC free article] [PubMed] [Google Scholar]
- McCormick DA, von Krosigk M. Corticothalamic activation modulates thalamic firing through glutamate “metabotropic” receptors. Proc Natl Acad Sci USA 89: 2774– 2778, 1992 [DOI] [PMC free article] [PubMed] [Google Scholar]
- Mooney RD, Fish SE, Rhoades RW. Anatomical and functional organization of pathway from superior colliculus to lateral posterior nucleus in hamster. J Neurophysiol 51: 407– 431, 1984 [DOI] [PubMed] [Google Scholar]
- Mooney RD, Nikoletseas MM, Ruiz SA, Rhoades RW. Receptive-field properties and morphological characteristics of the superior collicular neurons that project to the lateral posterior and dorsal lateral geniculate nuclei in the hamster. J Neurophysiol 59: 1333– 1351, 1988 [DOI] [PubMed] [Google Scholar]
- Paul K, Cox CL. Excitatory actions of substance P in the rat lateral posterior nucleus. Eur J Neurosci 31: 1– 13, 2010 [DOI] [PubMed] [Google Scholar]
- Prevost F, Lepore F, Guillemot JP. Spatio-temporal receptive field properties of cells in the rat superior colliculus. Brain Res 1142: 80– 91, 2007 [DOI] [PubMed] [Google Scholar]
- Reichova I, Sherman SM. Somatosensory corticothalamic projections: distinguishing drivers from modulators. J Neurophysiol 92: 2185– 2197, 2004 [DOI] [PubMed] [Google Scholar]
- Sherman SM. Thalamic relay functions. Prog Brain Res 134: 51– 69, 2001 [DOI] [PubMed] [Google Scholar]
- Sherman SM, Guillery RW. On the actions that one nerve cell can have on another: distinguishing “drivers” from “modulators.” Proc Natl Acad Sci USA 95: 7121– 7126, 1998 [DOI] [PMC free article] [PubMed] [Google Scholar]
- Smith PH, Bartlett EL, Kowalkowski A. Cortical and collicular inputs to cells in the rat paralaminar thalamic nuclei adjacent to the medial geniculate body. J Neurophysiol 98: 681– 695, 2007 [DOI] [PubMed] [Google Scholar]
- Sun QQ, Baraban SC, Prince DA, Huguenard JR. Target-specific neuropeptide Y-ergic synaptic inhibition and its network consequences within the mammalian thalamus. J Neurosci 23: 9639– 9649, 2003 [DOI] [PMC free article] [PubMed] [Google Scholar]
- Sun QQ, Huguenard JR, Prince DA. Somatostatin inhibits thalamic network oscillations in vitro: actions on the GABAergic neurons of the reticular nucleus. J Neurosci 22: 5374– 5386, 2002 [DOI] [PMC free article] [PubMed] [Google Scholar]
- Turner JP, Salt TE. Characterization of sensory and corticothalamic excitatory inputs to rat thalamocortical neurones in vitro. J Physiol 510: 829– 843, 1998 [DOI] [PMC free article] [PubMed] [Google Scholar]
- von Krosigk M, Monckton JE, Reiner PB, McCormick DA. Dynamic properties of corticothalamic excitatory postsynaptic potentials and thalamic reticular inhibitory postsynaptic potentials in thalamocortical neurons of the guinea-pig dorsal lateral geniculate nucleus. Neuroscience 91: 7– 20, 1999 [DOI] [PubMed] [Google Scholar]
- Wurtz RH, Mohler CW. Organization of monkey superior colliculus: enhanced visual response of superficial layer cells. J Neurophysiol 39: 745– 765, 1976 [DOI] [PubMed] [Google Scholar]


