Abstract
Western lifestyle contributes to body weight dysregulation. Leptin down-regulates food intake by modulating the activity of neural circuits in the hypothalamic arcuate nucleus (ARC), and resistance to this hormone constitutes a permissive condition for obesity. Physical exercise modulates leptin sensitivity in diet-induced obese rats. The role of other lifestyle components in modulating leptin sensitivity remains elusive. Environmentally enriched mice were used to explore the effects of lifestyle change on leptin production/action and other metabolic parameters. We analyzed adult mice exposed to environmental enrichment (EE), which showed decreased leptin, reduced adipose mass, and increased food intake. We also analyzed 50-d-old mice exposed to either EE (YEE) or physical exercise (YW) since birth, both of which showed decreased leptin. YEE mice showed no change in food intake, increased response to leptin administration, increased activation of STAT3 in the ARC. The YW leptin-induced food intake response was intermediate between young mice kept in standard conditions and YEE. YEE exhibited increased and decreased ratios of excitatory/inhibitory synapses onto α-melanocyte-stimulating hormone and agouti-related peptide neurons of the ARC, respectively. We also analyzed animals as described for YEE and then placed in standard cages for 1 mo. They showed no altered leptin production/action but demonstrated changes in excitatory/inhibitory synaptic contacts in the ARC similar to YEE. EE and physical activity resulted in improved insulin sensitivity. In conclusion, EE and physical activity had an impact on feeding behavior, leptin production/action, and insulin sensitivity, and EE affected ARC circuitry. The leptin-hypothalamic axis is maximally enhanced if environmental stimulation is applied during development.
Keywords: environmental enrichment, arcuate nucleus, AgRP, POMC, synaptic plasticity
It is widely accepted that the prevalent lifestyle model of Western societies characterized by limited physical activity, excessive caloric intake, and repetitive behavioral patterns contributes to the dysregulation of the otherwise homeostatic control of body weight (BW) (1). The main player in this system is leptin, a hormone secreted in the periphery by fat cells (2), which signals the status of body energy stores, down-regulates feeding behavior, and promotes energy expenditure by activating signal transduction mediated by the JAK-STAT pathway in the hypothalamic arcuate nucleus (ARC) through its receptor (Ob-Rb). This, in turn, promotes excitation and inhibition of neurons expressing, respectively, POMC, which is a precursor of α-melanocyte-stimulating hormone (MSH), the most potent anorexigenic peptide, and the orexigenic peptides agouti-related peptide (AgRP)/Neuropeptide Y (NPY) (3, 4).
Such a seemingly clear view of the complex regulation of feeding behavior and BW is challenged by the fact that the majority of obese people exhibit high levels of circulating leptin (5), to which they are apparently resistant. Leptin resistance is emerging as a permissive condition for obesity (6), and efforts to enhance leptin sensitivity could be a determinant in the treatment and prevention of this disorder.
Leptin resistance, often reported in standard housed mice (7), especially if obese, was partially rescued by genetic modifications (5) or physical exercise (8). However, mice used in the studies investigating leptin regulation and action are usually reared under standard conditions that allow little physical activity and limited sensorial, emotional, and cognitive stimulation. This certainly impinges on several metabolic functions, as Martin et al. (9) conclude from a metaanalysis of health conditions of standard housed mice vs. physically exercised or diet-restricted mice. What is not as yet clear is whether rearing factors other than diet or locomotor activity may affect metabolism in rodents, as is indicated by some evidence in humans. Indeed, depression, anxiety, solitude, frustration, and boredom are considered important determinants of human emotional eating (10, 11), often leading to metabolic disorders.
In the present study, we asked whether multifaceted modifications of the environment might influence metabolism and leptin sensitivity in WT nonobese animals. To address this issue, we exposed mice to environmental enrichment (EE), a manipulation of the rearing environment that includes enhanced physical activity and sensory, cognitive, and social stimulation (12) and exerts important effects on experience-dependent plasticity, including adult neurogenesis and synaptic connectivity (12). To disentangle the contribution of locomotor activity from the other EE components, the effects of EE were compared with those of voluntary physical exercise alone.
Our findings demonstrate that EE has an effect on glucose tolerance, feeding behavior, and leptin sensitivity; this third aspect is observed only if EE has been applied since birth. In the ARC of young mice, these effects are associated with increased leptin receptor expression, enhanced activation of the STAT3 pathways, and a shift of the excitation/inhibition balance toward the former in α-MSH neurons and toward the latter in AgRP/NPY neurons. Intriguingly, physical activity also had an impact on feeding behavior and leptin production/action and EE affected ARC circuitry.
Results
EE Effects on Metabolism and Feeding Behavior in Adult Mice.
Exposure of male adult mice [postnatal day (P) 50] to EE for 4 wk resulted in no significant difference in BW (Table S1). A significant difference was seen in the weight of the fat depots, with adult mice raised under the EE condition (AEE) showing significantly lower values for this parameter as compared with adult mice reared under standard conditions (AST) (Table S1). No difference was found in the weight of other metabolically active organs, including the liver and brown adipose tissue (BAT) (Table S1).
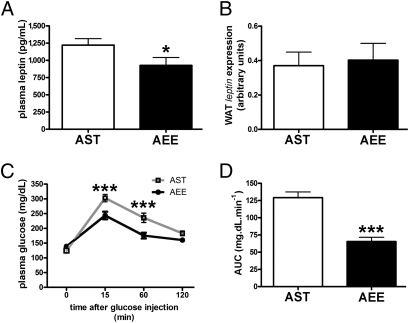
Plasma leptin measured at the end of the EE rearing period was lower in AEE mice as compared with AST mice (Fig. 1A). When the individual leptin levels at 4 wk were normalized for the corresponding weight of the fat pads, no significant difference between the AEE and AST mice could be observed (Table S1), suggesting that the reduction in serum leptin likely results from the decrease in adiposity herein described for the EE mice. When leptin mRNA abundance was assessed in the epididymal white adipose tissue (WAT) of AEE and AST mice, no significant difference was found (Fig. 1B).
Fig. 1.
Effect of EE on leptin expression and glucose tolerance in adult mice. (A) Plasma leptin at the end of EE in AST (n = 16) and AEE (n = 14) mice (t test, *P < 0.05). (B) WAT leptin gene expression in AST (n = 11) and AEE (n = 10) mice. (C) IpGTT results at the end of EE in AST (n = 11) and AEE (n = 10) mice (two-way ANOVA: rearing effect, P < 0.001; time effect, P < 0.001. Bonferroni post hoc test in AST vs. AEE mice, ***P < 0.001). (D) AUC values (mg·dL·min−1 over a 120-min test) for the glycemic responses of AST and AEE mice shown in C (t test, ***P < 0.001).
Lowering the levels of circulating leptin may result in increased food intake. Indeed, average food intake was significantly higher (Table S1) in the AEE mice, as expected in an animal exposed to a higher level of physical activity.
AEE mice showed similar insulin levels and moderately decreased levels of fasting glucose as compared with AST mice (Table S1). When an i.p. glucose tolerance test (IpGTT) was performed (Fig. 1C), a significant increase in insulin sensitivity was observed (Fig. 1D).
Taken together, these data indicate that EE improves glucose tolerance, reduces adipose mass, increases food intake, and down-regulates leptin production in the adult mouse.
EE Effects on Metabolism and Feeding Behavior in Young Mice.
To evaluate the effects of EE during development on metabolism and leptin production/action, we monitored a group of young mice born under the EE condition (YEE) and killed at P50. Young control mice were kept in standard conditions (YST). The BW and weight of the liver and BAT were identical in YEE and YST mice. No difference was seen in the weight of the gonadal fat pad (Table S2).
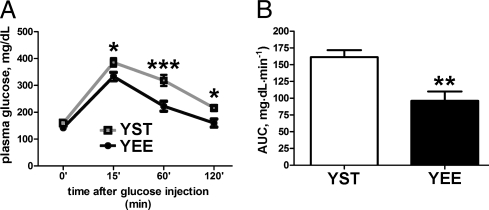
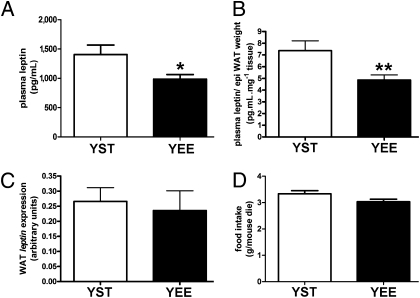
YEE mice showed a similar plasma insulin level and a slightly lower level of fasting glucose (Table S2) and performed better during the IpGTT (Fig. 2 A and B). Plasma leptin was lower in YEE mice than in YST mice, even when normalized to the weight of fat pads (Fig. 3 A and B and Table S2). The abundance of WAT leptin mRNA was then assessed by real-time PCR in WAT of YEE and YST mice, but no statistically significant difference was found (Fig. 3C). Other posttranscriptional mechanisms could explain the different leptin levels in YEE mice. For instance, Ceccarini et al. (13) reported that leptin uptake by megalin in the kidney and its binding to red bone marrow importantly accounts for its biodistribution and may contribute to explain variation in its plasma levels. The diminished level of circulating leptin observed in YEE mice was not associated with an increase in food intake (Fig. 3D).
Fig. 2.
Improved glucose tolerance in young mice at the end of EE. (A) IpGTT results at the end of EE in YST (n = 19) and YEE (n = 15) mice (two-way ANOVA: rearing effect, P < 0.001; time effect, P < 0.001. Bonferroni post hoc test in YST vs. YEE mice, *P < 0.05; ***P < 0.001). (B) AUC values (mg·dL·min−1 over a 120-min test) for the glycemic responses of YST and YEE mice shown in A (t test, **P < 0.002).
Fig. 3.
Effect of EE on metabolic parameters in young mice. (A) Plasma leptin is decreased in YEE (n = 37) compared with YST (n = 34) mice (t test, *P < 0.05). (B) Plasma leptin/epididymal (epi) fat weight (pg·mL·mg−1) for YST and YEE mice (t test, **P < 0.01). (C) Leptin gene expression in epididymal WAT of YST (n = 19) and YEE (n = 17) mice. (D) Average food intake in YST and YEE mice.
These data indicate that EE has a positive effect on glucose tolerance, no effect on adipose mass or food intake, and reduces leptin production during development.
EE Effects on Leptin Response and Hypothalamic Gene Expression in Young Mice.
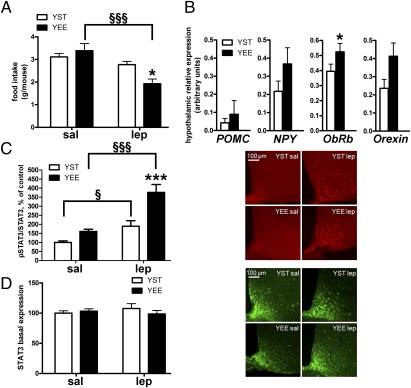
We then analyzed the effect of leptin administration on food consumption. Food intake assessed 14 h after injection of leptin or vehicle was reduced by 38% in YEE mice and by 13% in YST mice (as compared with corresponding vehicle-treated animals) (Fig. 4A). The relatively small reduction of food intake measured in YST mice should not be surprising, given that leptin effects in WT animals on food intake are often cumulative and become significant only after 2–3 d of chronic treatment (14). The effect of EE was then investigated on the hypothalamic expression of genes directly implicated in eating behavior. These included the long-isoform leptin receptor (Ob-Rb), the orexigenic peptide NPY, the α-MSH precursor POMC, and orexin. Real-time PCR revealed no significant difference in the abundance of POMC and NPY transcripts between YEE and YST mice, although Ob-Rb and orexin expression was up-regulated in YEE mice (Fig. 4B).
Fig. 4.
EE enhances response to exogenous leptin administration in young mice. (A) Food intake assessed 14 h after i.p. leptin injection in YST and YEE mice [two-way ANOVA: treatment effect, P < 0.01; interaction, P < 0.05. Bonferroni post hoc test in YST vs. YEE mice, *P < 0.05; in saline (sal) vs. leptin (lep), §§§P < 0.001]. (B) Hypothalamic gene expression in YST (n = 15) and YEE (n = 13) mice (t test, *P < 0.05). (C) (Left) Histogram showing the ratio of pSTAT3-positive cells to the total number of STAT3-positive neurons 45 min after leptin or saline injection in the ARC of YST (saline, n = 8; leptin, n = 6) and YEE (saline, n = 7; leptin, n = 6) mice (two-way ANOVA: rearing effect, P < 0.001; treatment effect, P < 0.001; interaction, P = 0.037. Bonferroni post hoc tests in YST vs. YEE mice, ***P < 0.001; in leptin vs. saline, §P < 0.05; §§§P < 0.001). (Right) Representative immunofluorescence showing pSTAT3 activation in the ARC after saline or leptin injection. (Scale bar: 100 μm.) (D) (Left) Total number of STAT3-positive neurons in the ARC of YEE and YST mice after saline or leptin injection (two-way ANOVA, NS, not significant). (Right) Representative immunofluorescence showing STAT3 expression in the ARC of YEE and YST mice. (Scale bar: 100 μm.)
Next, we asked whether the activation state of molecules involved in leptin signaling might differ between the two groups. On leptin injection, the number of phospho-STAT3 (pSTAT3)-positive neurons in the ARC was strongly up-regulated by EE (Fig. 4C). In particular, leptin stimulation resulted in STAT3 phosphorylation in 72% of STAT3-positive cells in YEE mice (234% of saline-treated mice), whereas pSTAT3 was activated in only 38% of STAT3-positive neurons in YST mice (190% of saline-treated mice). No significant difference was found in the number of neurons expressing STAT3 in YEE and YST mice (Fig. 4D).
These data are consistent with the above-stated hypothesis that EE increases leptin sensitivity in young mice.
EE Effects on ARC Synaptic Connectivity in Young Mice.
Considering that fasting and genetic leptin deficiency also affect energy balance by significantly interfering with the synaptic plasticity of the ARC (4, 15, 16), we analyzed whether EE has an impact on ARC synaptic organization.
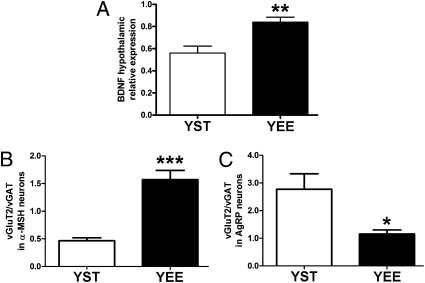
In the cerebral cortex and hippocampus (17), EE modifies synaptic organization of neural circuits and enhances the expression of BDNF (18), a neurotrophin important for synaptic plasticity. When hypothalamic BDNF expression was assessed, we found a significantly increased level in YEE mice as compared with YST mice (Fig. 5A).
Fig. 5.
BDNF expression and excitation/inhibition ratio on α-MSH and AgRP neurons of YST and YEE mice. (A) BDNF hypothalamic expression in YST (n = 12) and YEE (n = 7) mice (t test, **P < 0.01). (B) Histogram of the ratio between excitatory and inhibitory synapses on α-MSH neurons in the ARC of YEE (n = 11) and YST (n = 9) mice (t test, ***P < 0.001). (C) Histogram of the ratio between excitatory and inhibitory synapses on AgRP neurons in the ARC of YEE (n = 7) and YST (n = 6) mice (t test, *P < 0.05).
We then searched for modifications in the neural circuitry of the ARC. To this end, we assessed the number of excitatory and inhibitory synapses in YEE and YST mice by immunofluorescence, counting the puncta labeled with the specific markers vGluT2 and vGAT, corresponding to excitatory and inhibitory synaptic terminals, respectively. We found that in the ARC of YEE mice, the number of excitatory synaptic terminals is significantly higher than in YST mice and the number of inhibitory synaptic terminals is reduced (Fig. S1 A and B), thus lowering the ratio between excitatory and inhibitory synapses (Fig. S1C).
We next asked whether excitatory and inhibitory synapses on neurons expressing α-MSH and AgRP were differently affected by EE by double-immunolabeling for α-MSH or AgRP and vGluT2 or vGAT. As shown in Fig. 5B, the ratio of vGluT2/vGAT-positive puncta is significantly higher on α-MSH-positive neurons of YEE mice as compared with YST mice. On the other hand, YEE mice exhibit a significantly lower ratio of vGluT2/vGAT-positive puncta on AgRP neurons (Fig. 5C). The YEE effects observed with the ratio are recapitulated by the absolute numbers of immunoreactive puncta in each of the four double-immunofluorescence experiments shown in Fig. S2.
These data establish that on EE in young mice, the ARC undergoes a change in its overall synaptic connectivity and a cell-specific alteration in neurons that are key in the regulation of energy homeostasis.
How EE Experienced During Development Affects Metabolism and Feeding Behavior in the Adult Mouse.
We next asked whether EE effects could persist once animals are removed from this condition. Mice enriched since birth were transferred to a standard cage at P50 and monitored until P80 (EE/ST). A group of control mice (ST/ST) was kept in standard cages during the whole period.
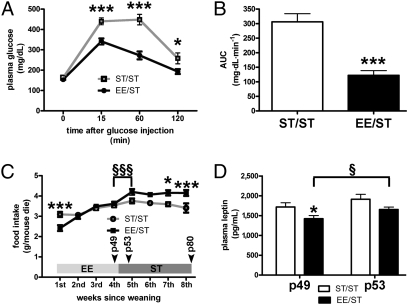
Despite displaying a similar BW at P50, the two groups diverged afterward in that EE/ST mice showed a greater weight gain between P50 and P80, ending up with a significantly greater weight as compared with ST/ST mice (Table S3). No difference was observed in the weight of the epigonadal fat, BAT, or liver (Table S3). ST/ST and ST/EE mice showed similar levels of fasting glucose and insulin (Table S3). IpGTT results and area under the curve (AUC) calculations revealed significantly improved glucose tolerance in EE/ST mice as compared with ST/ST mice (Fig. 6 A and B).
Fig. 6.
How EE experienced in youth affects food intake and metabolic parameters in adulthood. (A) IpGTT results in ST/ST (n = 13) and EE/ST (n = 19) mice (two-way ANOVA: rearing effect, P < 0.0001; time effect, P < 0.0001; interaction, P < 0.0001. Bonferroni post hoc test in ST/ST vs. EE/ST, *P < 0.05; ***P < 0.001). (B) AUC values (mg·dL·min−1 over a 120-min test) for the glycemic responses of ST/ST and EE/ST mice shown in A (t test, ***P < 0.001). (C) Weekly food intake of ST/ST and EE/ST mice over the 8 wk postweaning. The bar indicates the rearing condition over time (two-way ANOVA: rearing effect, P < 0.01; time effect, P < 0.0001; interaction, P < 0.0001. Bonferroni post hoc tests for ST/ST vs. EE/ST mice, *P < 0.05; ***P < 0.001. Bonferroni post hoc test applied to time course comparison for EE/ST, §§§P < 0.001). (D) Plasma leptin at the end of the EE condition (P49) and 3 d after moving to standard conditions (P53) in EE/ST and ST/ST mice (two-way ANOVA: time effect, P < 0.05; rearing effect, P < 0.01. Bonferroni post hoc test in EE/ST vs. ST/ST mice, *P < 0.05. Bonferroni post hoc test applied to P49 vs. P53, §P < 0.05).
The increased BW observed in EE/ST mice can be explained, considering that they ate significantly more between P50 and P80 (Fig. 6C). Interestingly, food intake increased abruptly after animal transfer to standard rearing. This sharp change in food consumption was associated with a concomitant rise in leptin levels that increased 3 d after the transition from the EE condition to standard conditions (P53) with respect to the levels observed 1 d before the end of the EE condition (P49) (Fig. 6D). ST/ST mice did not show significantly increased leptin over this time window. At P80, there was no difference in the plasma leptin level between EE/ST and ST/ST mice (Table S3).
Taken together, these data indicate that EE experienced during developmental age leaves a metabolic imprint on the adult mouse, which shows enhanced glucose tolerance.
How EE Experienced During Development Affects Leptin Response in the Adult Mouse.
Food intake measured 14 h following leptin injection was not significantly different in P80 EE/ST and ST/ST mice (Fig. S3A). The assessment of leptin sensitivity in terms of STAT3 activation following leptin injection mirrored this scenario: EE/ST and ST/ST mice did not exhibit a significant difference in the percentage of STAT3-positive neurons showing staining for pSTAT3 (Fig. S3B). No significant difference was found in the number of neurons expressing STAT3 in EE/ST and ST/ST mice (Fig. S3C).
Our data show that the effects of EE on leptin sensitivity observed in developing young animals do not persist through adulthood on standard rearing conditions.
How EE Experienced During Development Affects ARC Synaptic Connectivity in the Adult Mouse.
EE/ST mice showed a significantly lower number of inhibitory terminals (vGAT-positive) in the ARC with respect to the ST/ST condition (Fig. S4B). No difference was found in the number of excitatory synaptic terminals (vGluT2-positive) (Fig. S4A). The ratio between excitatory and inhibitory puncta was significantly higher in EE/ST mice as compared with ST/ST mice (Fig. S4C).
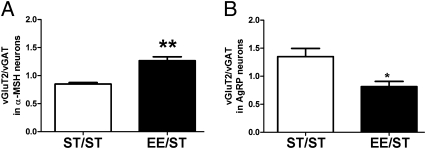
When neuron-specific investigations were performed, we found that only the reduction in vGAT puncta on α-MSH neurons and the increase in vGluT2 puncta on AgRP-positive neurons were significant in EE/ST mice as compared with ST/ST mice (Fig. S5 A–D). Nonetheless, the excitation/inhibition ratio for EE/ST mice was respectively higher in α-MSH neurons (Fig. 7A) and lower in AgRP neurons (Fig. 7B). Hypothalamic BDNF gene expression was similar in EE/ST and ST/ST mice (0.63 ± 0.14 and 0.55 ± 0.05 arbitrary units, respectively).
Fig. 7.
Excitation/inhibition ratio on α-MSH and AgRP neurons of ST/ST and EE/ST mice. (A) Histogram showing the increase in the ratio between excitatory and inhibitory synapses on α-MSH neurons in the ARC of EE/ST (n = 4) and ST/ST (n = 4) mice (t test, **P < 0.01). (B) Histogram showing the decrease in the ratio between excitatory and inhibitory synapses on AgRP neurons in the ARC of EE/ST (t test, *P < 0.05).
These results indicate that ARC circuits retain a persistent, although attenuated, trace of the rearing condition experienced during development consisting of an altered ratio between excitatory and inhibitory synaptic density affecting both α-MSH and AgRP neurons.
Comparison Between Physical Exercise and EE.
To assess whether the effects of EE on feeding behavior, leptin production and responsiveness, glucose tolerance, and synaptic organization of the ARC in young mice were simply attributable to enhanced physical activity, we studied how voluntary physical exercise (free access to a running wheel) by itself could influence these parameters.
Young physically exercised (YW) mice did not show a significantly altered BW as compared with YEE or to YST mice, despite a trend toward increased food intake (Fig. S6A). Their adiposity (weight of epididymal fat pad/BW) was lower than that observed in both YST and YEE mice (Fig. S6B). Results of the IpGTT revealed that, similar to YEE mice, YW mice displayed better glucose tolerance as compared with YST mice (Fig. S6 D and E).
YW mice showed a lower leptin concentration than YST mice (Fig. S6C). Leptin sensitivity, assessed as food intake following leptin injection, was intermediate between that of YST mice and that of YEE mice. If we assume that the leptin-induced change in food intake in YST mice is 100%, a 200% change was observed in YW mice and a 300% change was observed in YEE mice (Fig. S6F). Following leptin injection, the ratio between pSTAT3 and STAT3-positive neurons in YW mice was similar to that in YST mice and lower than that in YEE mice. However, if the fold change from saline to leptin treatment is considered, this parameter underwent a 2.55-fold change in YW mice, which is, respectively, similar to and higher than that observed in YEE (2.34) and YST (1.9) mice (Fig. S6G).
Different from what was observed with EE, no effect of voluntary physical exercise was observed on the total number of excitatory and inhibitory synapses in the ARC (Fig. S6H).
Taken together, these data suggest that physical exercise by itself quantitatively accounts for only some of the changes in metabolism and leptin sensitivity observed on EE.
Discussion
Our results revealed that exposing mice to EE has an impact on their feeding behavior, leptin production/action, and insulin sensitivity. The former two outcomes depend on the age at which EE is experienced, because EE in adulthood does not seem to affect the leptin system, whereas EE since birth results in an enhanced response to exogenous leptin superior to that found in physically exercised mice.
The ARC of young EE mice also exhibits important changes in synaptic connectivity, with an increased excitation/inhibition ratio in α-MSH neurons and a decreased excitation/inhibition ratio in AgRP neurons.
Response to EE in Adult Mice.
Although food intake is known to be regulated by numerous factors and molecular pathways, the response of adult mice to EE is largely predictable using the leptin controller system as a paradigm. Indeed, this condition resulted in a reduction of fat mass, a consequent reduction of leptin production, and increased food intake. The observed scenario mirrors the introduction of a more dynamic lifestyle in sedentary individuals: Despite an augmented appetite, BW is maintained well, with a beneficial effect on insulin sensitivity.
EE Since Birth Affects Leptin Action/Production.
When compared with YST mice, YEE mice exhibited similar fat depots, reduced plasma leptin, and similar food intake, thus suggesting that the leptin controller system had been adjusted to a different set point with augmented sensitivity. Indeed, leptin response in YEE mice in terms of food intake was more pronounced than in YST mice. Consistently, YEE showed increased Ob-Rb hypothalamic expression and an enhanced response to leptin injection as assessed by ARC STAT3 phosphorylation and food intake reduction. Increased expression of leptin receptor may well explain the empowered leptin signaling, and STAT3 is considered the main effector of leptin signaling in the ARC (6, 19). YEE mice also showed increased hypothalamic expression of orexin. Despite the positive effect on food intake described for this peptide, orexin-deficient mice exhibit obesity, indicating that orexin may exert an overall catabolic influence over energy balance (20).
Mice reared in EE since birth thus constitute a nongenetic and nonpathological model of enhanced leptin sensitivity. Genetic models with enhanced leptin sensitivity/response include, among others, mice deficient for the cytokine signaling 3 (SOCS3) gene (14, 21) and mice in which the orexin-OXR2 receptor signaling is enhanced (22).
Comparison Between EE and Physical Exercise Effects on Metabolic and Leptin Action/Production Outcomes.
Patterson et al. (8) recently reported that leptin resistance is reduced in diet-induced obese rats exposed to postweaning voluntary exercise as compared with control sedentary rats, thus attenuating the development of obesity typical of this model. These data are in line with our findings, although obtained in a pathological model genetically predisposed to become obese and characterized by leptin resistance (23). Indeed, the increase in leptin sensitivity herein obtained for YEE mice indicates the possibility of manipulating this parameter even in physiological conditions, as long as this manipulation is applied early in life. In addition, our data underscore three important differences between the effects of EE and voluntary physical exercise. First, the effects of locomotor activity on leptin sensitivity were less pronounced than those observed in YEE mice. Second, some of the features in the YW mice (reduced adiposity and increased food intake) totally differed from what found in YEE mice and cannot be interpreted following the intermediate phenotype paradigm, thus suggesting that physical exercise outcomes are not totally contained within the EE condition and vice versa. Third, physical exercise did not modify the overall density of excitatory or inhibitory synaptic contacts in the ARC, whereas EE increases the former and reduces the latter. Thus, components of EE other than physical exercise could play a role in regulating feeding behavior and the related mechanisms in developing mice. If we picture this concept as a Venn diagram, we could say that the two conditions share an intersection but maintain distinct areas of effect. In this regard, evidence exists that EE and voluntary exercise affect different phases of the neurogenic process in the hippocampus (24).
Trace Left by EE on the Leptin System on Treatment Discontinuation.
When animals were removed from EE and kept in a standard cage for 1 mo, the enhancement in leptin sensitivity disappeared but the hypothalamic structural modifications persisted to some extent and could represent a long-lasting trace of a rearing condition experienced during development.
Interestingly, food intake in EE/ST mice increased significantly when they were placed in a standard cage, and a concomitant rise in leptin was determined. These results suggest that the improved leptin sensitivity observed in the YEE mice suddenly dropped on environmental change; consequently, the hypothalamus sensed leptin concentrations as abnormally low and animals were induced to compensate for an imbalance in their leptin controller system by eating more.
It is tempting to speculate about the existence of a leptin inhibitory signal promoted by EE and rapidly down-regulated on its discontinuation. Leptin can be considered the ideal afferent signal that informs the center (hypothalamus) about the status of the energy stores (WAT). This putative leptin modulator would complement leptin action and inform the periphery (WAT) about the status of the central nervous system, the privileged target of EE and the integration center of body functions. The nature of this signal, which we can imagine as a circulating factor or nervous input, has yet to be established. Of note, recent data (25) indicate clear anatomical connections between POMC neurons in the ARC and WAT.
Differential Effects of EE on Synaptic Connectivity Impinging on α-MSH and AgRP Neurons.
In young mice, EE modified the excitatory/inhibitory synaptic connectivity in the ARC overall. Specifically, α-MSH and AgRP neurons, respectively, displayed an enhancement and decrease of the excitation/inhibition ratio. ARC synaptic plasticity and changes in feeding behavior/energy homeostasis were first linked by Pinto et al. (4), who found changes in the excitation/inhibition of POMC and NPY cells of the ob/ob mouse, consistent with the typical overfeeding behavior of this model. They demonstrated that leptin treatment was able to rescue the ob/ob ARC phenotype and that treatment of WT animals with the orexigenic peptide ghrelin led to enhanced inhibition of POMC neurons. Nutritional state has also been implicated in the rapid reorganization of ARC synaptic connectivity. Studies in nonhuman primates (26) indicate that fasting results in an altered synaptic balance favoring the activity of NPY and orexin neurons. Further, the strength of the excitatory input from the ventromedial hypothalamic area to ARC POMC neurons was reduced by fasting in mice (16). In female mice, estradiol (E2) triggers a robust increase in the number of excitatory inputs to POMC neurons in the ARC that is independent of leptin (27). All changes so far described resulted from a real (fasting) or perceived state of starvation (ob/ob mouse) or following hormonal treatment.
Our studies provide a demonstration that a change in rearing conditions and “lifestyle” may interfere with the neural circuitry that underlies energy homeostasis. Indeed, EE has an overall action on ARC synaptic connectivity that leads to the opposite functional outcome seen on ghrelin treatment, starvation, and leptin deficiency. The enhanced leptin sensitivity herein observed in EE mice could mediate the effects of EE on ARC synaptology; however, we cannot exclude the possibility that the observed changes are independent of leptin but dependent on STAT3, as previously demonstrated for E2 (27). In fact, enhanced basal activation of STAT3 was observed in YEE mice as compared with YST mice.
Our results are in agreement with the observation that the effect of EE on visual cortex plasticity involves a modulation of the excitation/inhibition balance (18).
Overall, these findings indicate that diet-independent changes in lifestyle occurring early in life are able to modulate leptin sensitivity and leave metabolic and synaptic imprints. This may have important implications for the use of leptin and behavioral therapy in treatment, and especially for the prevention of obesity.
Materials and Methods
Detailed protocols are presented in SI Materials and Methods.
Animals.
C57/BL6 male mice were reared under the following conditions: (i) mice born in the EE condition and killed at P50, (ii) mice reared in the EE condition since birth and then transferred to a standard cage at P50 and monitored until P80, (iii) adult mice moved to the EE condition at P50 and killed at P80, and (iv) mice reared since birth with free access to a running wheel and killed at P50. Age-matched mice reared under standard conditions were used as controls. Experimental protocols followed the Principles of Laboratory Animal Care (authorization no. 129/2000-A from the Italian Ministry of Health).
Plasma Assays.
Commercial ELISA kits were used to assess plasma levels of insulin (Linco Research) and leptin (R&D Systems). Plasma glucose was measured with a One-Touch Ultra glucometer (LifeScan).
IpGTT and AUC Parameters.
IpGTTs were performed as described by Funicello et al. (28). The total AUC was calculated using the trapezoid model.
Acute Leptin Injection.
Animals were injected i.p. with saline or murine leptin (3 mg/kg; Sigma) after a 1-h fast at dark onset. Food intake of the individually caged animals was monitored 14 h after injection.
Isolation of Total RNA and Real-Time PCR.
Total RNA isolation, first-strand cDNA synthesis, and Taq-Man quantitative PCR were performed as described (28). The relative abundance of mRNAs for ObRb, NPY, POMC, orexin, and BDNF was calculated with TATA binding protein mRNA as an invariant control.
Immunofluorescence.
After blocking, free-floating, 40-μm-thick, fixed-tissue coronal sections were incubated with 1:1,000 rabbit anti-vGAT or -vGluT2, 1:250 rabbit anti-STAT3 or -pSTAT3, 1:1,000 guinea pig anti-AgRP, and 1:2,500 anti-α-MSH antibodies. Sections were revealed with secondary antibodies conjugated to Alexa-568 and Alexa-488.
Quantitative Analysis of Immunolabeled Cells and Puncta.
Images were acquired with a confocal laser-scanning microscope. For pSTAT3, STAT3, and double-immunofluorescence images, the number of immunoreactive cells and synaptic puncta was manually counted using MetaMorph software (Universal Imaging Corp.). For pSTAT3 and STAT3 quantification, cell counts were normalized to the ARC area in each section. For vGAT and vGluT-2 analysis, the images were processed using Imaris software (Bitplane).
Statistical Analysis.
The number of mice in each experimental group is indicated in the figure legends. All values are expressed as the mean ± SEM, and a two-tailed Student's t test was used for pairwise comparisons. One-way and two-way ANOVA, followed by a Bonferroni post hoc test, was used to compare more than two groups. Statistical evaluation was performed using GraphPad Prism 3 (GraphPad Software).
Supplementary Material
Acknowledgments
We thank Cesare Cocuzza for technical help in metabolic studies. M. Maffei is an Associate Telethon Scientist. This work was supported by Telethon Foundation Grants TCP99016 (to M. Maffei) and GGP05236 (to T.P.), by Compagnia di San Paolo (Grant 2006-2008 to Dulbecco Telethon Institute) and by the Italian Ministry of Health.
Footnotes
The authors declare no conflict of interest.
*This Direct Submission article had a prearranged editor.
This article contains supporting information online at www.pnas.org/lookup/suppl/doi:10.1073/pnas.0911832107/-/DCSupplemental.
References
- 1.Coppari R, Ramadori G, Elmquist JK. The role of transcriptional regulators in central control of appetite and body weight. Nat Clin Pract Endocrinol Metab. 2009;5:160–166. doi: 10.1038/ncpendmet1070. [DOI] [PMC free article] [PubMed] [Google Scholar]
- 2.Zhang Y, et al. Positional cloning of the mouse obese gene and its human homologue. Nature. 1994;372:425–432. doi: 10.1038/372425a0. [DOI] [PubMed] [Google Scholar]
- 3.Elmquist JK, Flier JS. Neuroscience. The fat-brain axis enters a new dimension. Science. 2004;304:63–64. doi: 10.1126/science.1096746. [DOI] [PubMed] [Google Scholar]
- 4.Pinto S, et al. Rapid rewiring of arcuate nucleus feeding circuits by leptin. Science. 2004;304:110–115. doi: 10.1126/science.1089459. [DOI] [PubMed] [Google Scholar]
- 5.Maffei M, et al. Increased expression in adipocytes of ob RNA in mice with lesions of the hypothalamus and with mutations at the db locus. Proc Natl Acad Sci USA. 1995;92:6957–6960. doi: 10.1073/pnas.92.15.6957. [DOI] [PMC free article] [PubMed] [Google Scholar]
- 6.Friedman JM. Leptin at 14 y of age: An ongoing story. Am J Clin Nutr. 2009;89(Suppl):973S–979S. doi: 10.3945/ajcn.2008.26788B. [DOI] [PMC free article] [PubMed] [Google Scholar]
- 7.Scarpace PJ, Zhang Y. Leptin resistance: A predisposing factor for diet-induced obesity. Am J Physiol Regul Integr Comp Physiol. 2009;296:R493–R500. doi: 10.1152/ajpregu.90669.2008. [DOI] [PMC free article] [PubMed] [Google Scholar]
- 8.Patterson CM, Bouret SG, Dunn-Meynell AA, Levin BE. Three weeks of postweaning exercise in DIO rats produces prolonged increases in central leptin sensitivity and signaling. Am J Physiol Regul Integr Comp Physiol. 2009;296:R537–R548. doi: 10.1152/ajpregu.90859.2008. [DOI] [PMC free article] [PubMed] [Google Scholar]
- 9.Martin B, Ji S, Maudsley S, Mattson MP. “Control” laboratory rodents are metabolically morbid: Why it matters. Proc Natl Acad Sci USA. 2010;107:6127–6133. doi: 10.1073/pnas.0912955107. [DOI] [PMC free article] [PubMed] [Google Scholar]
- 10.Luppino FS, et al. Overweight, obesity, and depression: A systematic review and meta-analysis of longitudinal studies. Arch Gen Psychiatry. 2010;67:220–229. doi: 10.1001/archgenpsychiatry.2010.2. [DOI] [PubMed] [Google Scholar]
- 11.van der Merwe MT. Psychological correlates of obesity in women. Int J Obes (Lond) 2007;31(Suppl 2):S14–S18. doi: 10.1038/sj.ijo.0803731. discussion S31–32. [DOI] [PubMed] [Google Scholar]
- 12.van Praag H, Kempermann G, Gage FH. Neural consequences of environmental enrichment. Nat Rev Neurosci. 2000;1:191–198. doi: 10.1038/35044558. [DOI] [PubMed] [Google Scholar]
- 13.Ceccarini G, et al. PET imaging of leptin biodistribution and metabolism in rodents and primates. Cell Metab. 2009;10:148–159. doi: 10.1016/j.cmet.2009.07.001. [DOI] [PMC free article] [PubMed] [Google Scholar]
- 14.Zhang R, et al. Selective inactivation of Socs3 in SF1 neurons improves glucose homeostasis without affecting body weight. Endocrinology. 2008;149:5654–5661. doi: 10.1210/en.2008-0805. [DOI] [PMC free article] [PubMed] [Google Scholar]
- 15.Bouret SG, Draper SJ, Simerly RB. Trophic action of leptin on hypothalamic neurons that regulate feeding. Science. 2004;304:108–110. doi: 10.1126/science.1095004. [DOI] [PubMed] [Google Scholar]
- 16.Sternson SM, Shepherd GM, Friedman JM. Topographic mapping of VMH → arcuate nucleus microcircuits and their reorganization by fasting. Nat Neurosci. 2005;8:1356–1363. doi: 10.1038/nn1550. [DOI] [PubMed] [Google Scholar]
- 17.Mora F, Segovia G, del Arco A. Aging, plasticity and environmental enrichment: Structural changes and neurotransmitter dynamics in several areas of the brain. Brain Res Brain Res Rev. 2007;55:78–88. doi: 10.1016/j.brainresrev.2007.03.011. [DOI] [PubMed] [Google Scholar]
- 18.Sale A, Berardi N, Maffei L. Enrich the environment to empower the brain. Trends Neurosci. 2009;32:233–239. doi: 10.1016/j.tins.2008.12.004. [DOI] [PubMed] [Google Scholar]
- 19.Vaisse C, et al. Leptin activation of Stat3 in the hypothalamus of wild-type and ob/ob mice but not db/db mice. Nat Genet. 1996;14:95–97. doi: 10.1038/ng0996-95. [DOI] [PubMed] [Google Scholar]
- 20.Hara J, et al. Genetic ablation of orexin neurons in mice results in narcolepsy, hypophagia, and obesity. Neuron. 2001;30:345–354. doi: 10.1016/s0896-6273(01)00293-8. [DOI] [PubMed] [Google Scholar]
- 21.Mori H, et al. Socs3 deficiency in the brain elevates leptin sensitivity and confers resistance to diet-induced obesity. Nat Med. 2004;10:739–743. doi: 10.1038/nm1071. [DOI] [PubMed] [Google Scholar]
- 22.Funato H, et al. Enhanced orexin receptor-2 signaling prevents diet-induced obesity and improves leptin sensitivity. Cell Metab. 2009;9:64–76. doi: 10.1016/j.cmet.2008.10.010. [DOI] [PMC free article] [PubMed] [Google Scholar]
- 23.Levin BE, Dunn-Meynell AA, Balkan B, Keesey RE. Selective breeding for diet-induced obesity and resistance in Sprague-Dawley rats. Am J Physiol. 1997;273:R725–R730. doi: 10.1152/ajpregu.1997.273.2.R725. [DOI] [PubMed] [Google Scholar]
- 24.Olson AK, Eadie BD, Ernst C, Christie BR. Environmental enrichment and voluntary exercise massively increase neurogenesis in the adult hippocampus via dissociable pathways. Hippocampus. 2006;16:250–260. doi: 10.1002/hipo.20157. [DOI] [PubMed] [Google Scholar]
- 25.Stanley S, et al. Identification of neuronal subpopulations that project from hypothalamus to both liver and adipose tissue polysynaptically. Proc Natl Acad Sci USA. 2010;107:7024–7029. doi: 10.1073/pnas.1002790107. [DOI] [PMC free article] [PubMed] [Google Scholar]
- 26.Horvath TL. Synaptic plasticity in energy balance regulation. Obesity (Silver Spring) 2006;14(Suppl 5):228S–233S. doi: 10.1038/oby.2006.314. [DOI] [PubMed] [Google Scholar]
- 27.Gao Q, et al. Anorectic estrogen mimics leptin's effect on the rewiring of melanocortin cells and Stat3 signaling in obese animals. Nat Med. 2007;13:89–94. doi: 10.1038/nm1525. [DOI] [PubMed] [Google Scholar]
- 28.Funicello M, et al. Cathepsin K null mice show reduced adiposity during the rapid accumulation of fat stores. PLoS ONE. 2007;2:e683. doi: 10.1371/journal.pone.0000683. [DOI] [PMC free article] [PubMed] [Google Scholar]
Associated Data
This section collects any data citations, data availability statements, or supplementary materials included in this article.


