

Abstract
Although the vast majority of research in evolutionary biology is focused on adaption, a general theory for the population-genetic mechanisms by which complex adaptations are acquired remains to be developed. The issue explored here is the procurement of novel traits that specifically require multiple mutations to achieve a fitness advantage. By highlighting the roles played by the forces of mutation, recombination, and random genetic drift, and drawing from observations on the joint constraints on these factors, the ways in which rates of acquisition of specific types of adaptations scale with population size are explored. These general results provide insight into a number of ongoing controversies regarding the molecular basis of adaptation, including the adaptive utility of recombination and the role of drift in the passage through adaptive valleys.
Keywords: adaptive evolution, complex traits, evolutionary rate, molecular evolution, recombination
Recent empirical observations imply that approximate scaling laws exist for several fundamental evolutionary forces (1–3). First, across the full domain of life, there is an inverse relationship between population density and organism size. This relationship bears importantly on the power of random genetic drift, which is expected to scale negatively (although not necessarily linearly) with total population size (4). Second, the recombination rate per physical distance on chromosomes scales inversely with genome size. This feature is a simple consequence of an apparent structural constraint across all sexually reproducing eukaryotes—the occurrence of approximately one crossover event per chromosome arm per meiosis, and the fact that most variation in genome size is associated with variation in chromosome size rather than chromosome number. Finally, the mutation rate per nucleotide site per generation scales negatively with the genetic effective size of a population, possibly because lineages more vulnerable to random genetic drift are less efficient at maintaining high-fidelity replication/repair machinery (3, 5). The fact that all three of these nonadaptive forces of evolution influence the efficiency of selection raises the question as to whether general scaling laws also exist for the exploitation of various pathways to adaptive evolution.
The development of theory in this area is rendered difficult by the multidimensional nature of the problem. One strategy has been to ignore all deleterious mutations and to assume that selection is strong enough and mutation weak enough relative to the power of random genetic drift and recombination that evolution always proceeds by the sequential fixation of single mutations (e.g., refs. 6–11). Such an approach provides a useful entree into the evolutionary dynamics of rare adaptive mutations with large effects. Under these conditions, the expectations are clear—with larger numbers of mutational targets and a reduced power of random genetic drift, the rate of adaptation will increase with population size, although more slowly than expected under the assumption of sequential fixation (12, 13). The motivation for these models, which are specifically focused on total organismal fitness, derives from case studies of adaptations with apparently simple genetic bases, e.g., some aspects of insecticide resistance (14), skin pigmentation (15), and skeletal morphology in vertebrates (16).
Nevertheless, a broad subset of adaptations cannot be accommodated by the sequential model, most notably those in which multiple mutations must be acquired to confer a benefit. Such traits, here referred to as complex adaptations, include the origin of new protein functions involving multiresidue interactions, the emergence of multimeric enzymes, the assembly of molecular machines, the colonization and refinement of introns, and the establishment of interactions between transcription factors and their binding sites, etc. The routes by which such evolutionary novelties can be procured include sojourns through one or more deleterious intermediate states. Because such intermediate haplotypes are expected to be kept at low frequencies by selection, evolutionary progress would be impeded in large populations were sequential fixation the only path to adaptation. However, in all but very small populations, complex adaptations appear to be achieved by the fortuitous appearance of combinations of mutations within single individuals before fixation of any intermediate steps at the population level (e.g., refs. 17–26).
The goals of the following work are twofold. First, although most theory on the evolution of complex adaptations has been focused on nonrecombining systems, because recombination can serve as a creative force in evolution (27, 28), prior results might greatly underestimate the rate of emergence of novel adaptations. It is shown here, however, that recombination often plays a fairly minor role in the rate of acquisition of complex adaptations, except in a narrow range of chromosomal positions, and in some cases is inhibitory. Second, to understand the implications of the general theoretical results, there is a need to confine the analyses to the known parameter space of the key underlying factors. Here, the use of the empirically determined relationship between the mutation rate and the power of drift is used to explore how the lability of alternative molecular paths to adaptation scales with aspects of the population-genetic environment.
Model and Results
Recombination and the Rate of Emergence of Complex Adaptations.
Consider the situation in which two specific mutations must be acquired to achieve the novel adaptive state. Starting from state ab, the first step involves the production of aB or Ab intermediates. Initially, recombination will have no impact on the evolutionary dynamics, as heterozygotes carrying intermediate-state and ancestral ab haplotypes will yield no new daughter products. However, if both types of intermediate haplotypes simultaneously rise to moderate frequencies, recombination between them can produce the adaptive AB combination. The effective size of a population (Ne) determines the likelihood of such cooccurrence.
If Ne is sufficiently small that the waiting times for new mutations are long compared with the fixation times, the Ab and aB haplotypes will essentially never encounter each other, and the only route to the final adaptation will be the sequential fixation of the A and B mutations. Letting u be the rate of mutation at each site, this sequential mode of evolution predominates only if  a fairly restrictive domain given that u > 10−10 for all of cellular life (1, 3). At larger population sizes, recombination within aB/Ab individuals will often create AB gametes at rates beyond those expected by secondary mutation, as the recombination rate per nucleotide site is typically on the order of the mutation rate (2). However, in the initial stages of this process, because the ab gamete still has high frequency, newly arisen AB haplotypes will also be subject to recombinational loss. If the intermediate haploid states are neutral, mutation pressure can eventually drive the aB and Ab types to high enough frequencies that recombinational production of the AB haplotype outpaces the rate of loss. However, if the intermediate states are deleterious, selection can permanently maintain the Ab and aB haplotypes at low enough frequencies to prevent progression through a sufficiently strong recombination barrier. This inhibitory condition occurs when the rate of promotion of the AB type by selection (s denoting the selective advantage) is exceeded by the rate of loss by recombination.
These verbal arguments are now developed in a more formal fashion by evaluating the mean time to establishment of the AB haplotype (mutational origin plus fixation,  ). Diploidy is assumed throughout, although the general expressions still pertain to haploids with a sexual phase, provided Ne is substituted for 2Ne. The rate of recombination between sites per generation is denoted as c.
Neutral Intermediates.
In the low recombination domain (0 ≤ c < s), the mean number of generations until establishment of the double mutant can be approximated as the reciprocal of the sum of arrival rates of adaptive alleles destined to fixation by three different pathways,
 |
where rs is the rate of establishment by sequential fixation (i.e., fixation of the Ab or aB state followed by mutation to AB), rt is the rate of stochastic tunneling without recombination (i.e., creation of a successful AB haplotype by secondary mutation before fixation of an intermediate state), and rr is the rate of establishment initiated by recombination events. This approximation follows from the behavior of independent, exponentially distributed random variables, although the three paths are not entirely independent. The additional time to fixation of the final adaptive allele is ignored, as this time is generally negligible relative to the arrival times of fixation-destined mutations. Expanding from prior work, under conditions of intermediate-state neutrality,  and
and  where
where  is the probability of fixation of a newly arisen AB haplotype, with N being the absolute population size (26).
The rate of establishment of the AB haplotype by recombinational production (rr) can be approximated by using a branching-process approach. Imagine a newly arisen neutral first-step mutation of type Ab. Conditional on survival to generation t, the probability of which is ∼2/t (ref. 29, Chap. 5), such a haplotype will have reached an average number of t/2 copies (because the expected number is always 1.0). Having arisen to such a level, it will then take an average t generations to drift to zero in the absence of any advantageous secondary mutations. Thus, with an average t/4 copies over this time span of 2t generations, with the alternative aB first-step mutation having an expected frequency of ∼ut at time t (as a result of cumulative mutation pressure), and with recombination between aB and Ab haplotypes creating AB alleles at rate c/2, the rate of establishment of the adaptive allele by the recombinational path is expected to be proportional to (1 − e4Nu)(cuϕf/4)1/3, where the first term in parentheses denotes the probability of arrival of at least one intermediate-state allele per generation.
This scaling of rr with the cube root of c is consistent with earlier work on the arrival time of the first recombinant (30). However, these authors did not consider the additional matter of fixation and after applying several approximations concluded that the arrival rate for first recombinants scales with (cNeu2)1/3 in contrast to the overall behavior suggested above. It is shown below that these two results are reconciled quite closely with the single formula,
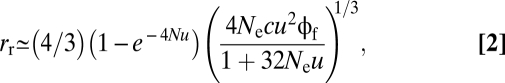 |
with a shift in behavior from that suggested by Christiansen et al. (30) to that suggested above as 4Neu progresses beyond 1/8.
The overall influence of recombination on  is a function of the two opposing ways in which the AB haplotype is influenced—the rate of origin of AB gametes by recombination within doubly heterozygous (aB/Ab) parents is proportional to c, whereas the net selective advantage of the resultant AB haplotypes is discounted to s − c by subsequent recombinational breakdown (whereas ab haplotypes still predominate). Thus, because the product c(s − c) is maximized at c = s/2, two-site adaptations with neutral intermediate steps are expected to emerge most rapidly in chromosomal settings where the recombination rate is half the selective advantage of the final adaptation.
The maximum benefit of recombination can be determined by comparing (rt + rr) when c = s/2 with the rate of tunneling in the absence of recombination at the large population-size limit, the ratio of which is  Assuming Ne = N, with a microbial mutation rate on the order of u = 10−10, this ratio becomes 4.9, 6.9, and 9.8 for s = 0.0001, 0.001, and 0.01, whereas with a mutation rate more typical of a multicellular eukaryote, ∼10−8, the ratios are 2.7, 3.6, and 4.9. Actual population sizes are generally much greater than effective population sizes (2, 4), but the preceding values would be inflated only by a factor of 3 if N/Ne were as large as 1,000. Thus, as these calculations give the extreme when c = s/2, the influence of recombination on the rate of establishment of a two-site adaptation with neutral intermediates will usually be much less than an order-of-magnitude effect.
For the high-recombination domain (c > s), the gamete frequencies will be maintained near linkage equilibrium (except for the influence of drift), in which case selection will operate on each component in an effectively additive manner (31). In this case, for sufficiently small population sizes (4Nu < 1),  is adequately expressed by Eq. 1 with rr = 0 and
  . For the limiting case in which the population is large enough to be treated in a deterministic fashion (with the population-wide rate of introduction of first-step alleles 4Nu > 1), the mean time to establishment can be shown to be
 |
generations. This time reduces to  provided
  , which will generally be the case for the types of adaptation under consideration. Under the same conditions, but in the absence of recombination,
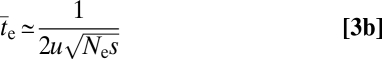 |
(26). Thus, as the ratio of the times given by Eqs. 3a and Eqs. 3b is  recombination slows the rate of establishment of a two-site adaptation via neutral intermediates by a factor <1.57 × the square root of the effective number of intermediate-state alleles arising per generation. The transition to the high-recombination behavior defined by Eq. 3b is almost immediate and nearly independent of the recombination rate once c exceeds s (Fig. S1).
Deleterious Intermediates.
Provided the power of drift (1/2Ne) is sufficiently weaker than the selective disadvantage of intermediate Ab and aB haplotypes (δ), prior to positive selection for a double mutant, deleterious first-step alleles will be maintained by selection–mutation balance at expected frequencies ∼u/δ. These maladapted haplotypes will then serve as launching pads for second-step adaptive mutations. Iwasa et al. (32) derived an iterative branching-process expression for the probability of first arrival of an AB combination in the absence of recombination, which, after incorporating the fixation probability, yields a closed-form approximation for the rate of stochastic tunneling,
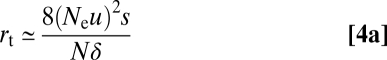 |
(26). With the rate of establishment by sequential fixation (typically of negligible importance when 4Neδ > 1) being given by equation 4a in ref. 26, the mean time to establishment when rr = 0 can again be estimated by applying Eq. 4a to Eq. 1.
The role of recombination can be included by noting that for populations with sufficiently large Ne to maintain the two intermediate-state alleles at stable selection–mutation balance, the expected frequency of double heterozygotes is 2(u/δ)2. With each such individual producing an average of two successful gametes, a fraction c/2 of which are AB, the effective rate of recombinational production of the novel AB allele is then 2Nec(u/δ)2 per generation. Assuming s > c, with the fixation probability of AB alleles being ≈2(s − c)(Ne/N) at large Ne, the total rate of establishment becomes
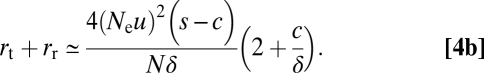 |
The ratio of rates of establishment with and without recombination in large populations is ∼(s − c)[2 + (c/δ)]/(2s), and provided s > c, we can again anticipate that the rate of advancement of the adaptive combination will be maximized when  in which case the ratio of rates reduces to 0.5[1 + (s/4δ)]. Thus, unless
  the effect of recombination is expected to be small. These results are inconsistent with the conclusion obtained under the assumption of an infinite population size, where recombination always prevents fixation of the double mutant (33).
To obtain the behavior of  over the full range of population sizes, it must be recognized that at sufficiently small Ne recombination will be so uncommon as to make a negligible contribution to adaptational advance or inhibition. However, because at intermediate population sizes some stochastic paths to establishment will involve recombination and others will not, an approximation for the overall rate of establishment is
where rT,0 and rT,r are the total expected rates in the absence and the presence of recombination (given by Eq. 4a and Eq. 4b). The exponential term kNu, which is proportional to the expected number of gametes carrying intermediate-state alleles at selection–mutation equilibrium, must exceed 0.1 for recombination to play a significant role. However, the exact definition of k has not been forthcoming, and in the following section, its numerical value is simply obtained by inspection of the rate of transition between the nonrecombination (c = 0) and recombination (0 < c < s) regimes of behavior in computer simulations.
Finally, in contrast to the situation in which s > c, if the rate of recombination exceeds the selective advantage of the AB haplotype, recombinational breakdown to deleterious intermediates will present an extremely strong barrier to establishment of the AB type. This result is because almost all recombinational events involving a newly arisen AB haplotype will have an ab participant, generating the maladaptive Ab and aB products. Only if the power of drift substantially exceeds the selective disadvantage of the intermediate haplotypes, 4Neδ < 1, will the intermediate-state haplotypes ever drift to high enough frequencies,  , for a newly emergent AB allele to overcome the recombinational barrier. The probability that a newly arisen underdominant haplotype proceeds to fixation is
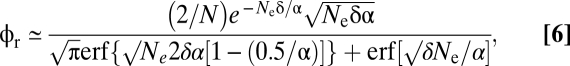 |
where erf(x) is the error function evaluated at x, and α = (s + 2δ)/(2δ) (34). Noting that both the A and B alleles must elevate to high frequency for the AB adaptation to take hold, the rate of establishment under effectively free recombination in large populations becomes
which accounts for the fact that one-step mutations arise at rate 4Nu per generation and are retained for an average of 1/δ generations of exposure to potential alleles at the alternative locus. The mean time to establishment is then ≈1/(rs + rr).
Scaling of the Time to Establishment with the Effective Population Size.
Although the preceding results provide general guidance as to how mutation, recombination, and random genetic drift influence  , any attempt to derive a biologically meaningful theory for the ability of populations to exploit various routes to adaptation ought to account for the fact that these three parameters are not independently distributed. Most notably, per-generation mutation rates increase with the power of random genetic drift. The base-substitution mutation rate per nucleotide site (in units of 10−9 per generation) scales as 6.12Ne−0.60 (with Ne in units of 106 individuals) (3). Using this relationship, the mutation rate will now be treated as a dependent variable in evaluating how the times to establishment of novel adaptations are likely to scale with Ne in natural populations. To determine the precision of the preceding analytical approximations, comparisons are made with simulation results for a Wright–Fisher diploid population (with Ne = N), using previously developed computational machinery (26).
For the situation in which the intermediate steps to adaptation are neutral, the theory developed above generally provides a close fit to the simulated data (Fig. S1). Due to the partially compensating effects of the increased mutation rate with the decline in population size, the mean time to establishment of a novel two-step allele is expected to be nearly independent of the effective population size (scaling as Ne−0.1, provided 4Nes > 1) (Fig. 1). This result follows by noting for the neutral-intermediate two-site model that the rate of tunneling in the absence of recombination is proportional to  and substituting u ∝ Ne−0.6. Such weak scaling is a strong departure from the view that would be obtained if the mutation rate were treated as a constant, in which case
  scales as Ne−1.0 provided 4Neu < 1.
Fig. 1.

Relationship between the mean times to establishment of an adaptive two-step allele with neutral intermediate states, with the mutation rate scaling negatively with the effective population size as defined in the text (and with the resultant values of Neu given along the upper horizontal axis). Results are given for a selective advantage of s = 0.01 (solid lines and circles) and s = 0.0001 (dotted lines and inverted triangles). For each s, the upper and lower solid lines, associated with sets of solid and open data points, respectively, are the results obtained by using Eq. 1 and Eq. 2 with c = 0 and c = s/2 (the optimal recombination rate), whereas the lines connecting open data points directly map the results for free recombination (c = 0.5). The data were obtained as averages of 100–400 stochastic simulations of a Wright–Fisher population starting with a situation in which the zero-state ab is fixed.
As anticipated from the results described above, recombination rates equal to ∼s/2 can result in a severalfold increase in the rate of adaptation when s is large and δ = 0, although the effect asymptotically approaches zero in small populations due to the rarity of simultaneously segregating polymorphisms (Fig. 1). Provided c < s, recombination does not greatly alter the scaling of  with Ne, as Eq. 2 shows that in this case the scaling of the recombinational contribution to
  is ∝Ne−0.2. In very large populations, the rate of establishment is moderately impeded when c > s.
The models developed above also fit the simulated data with deleterious intermediates quite well (Fig. S2). In this case, in contrast to the situation with neutral intermediates,  increases with Ne, although not strongly so, scaling as ∼Ne0.2 under most conditions when c < s (Fig. 2). Again, recombination rates in the neighborhood of s/2 can magnify the rate of adaptation up to severalfold, with the quantitative effect being diminished when δ is large. Also, as anticipated from the preceding theory, recombination rates in excess of the selective advantage of the final adaptation present a powerful barrier to establishment of the AB combination unless the effective population size is <1/δ.
Fig. 2.

Relationship between the mean times to establishment of an adaptive two-step allele with selective advantage s = 0.01 when the intermediate-state alleles have a selective disadvantage δ, with the mutation rate scaling negatively with the effective population size as defined in the text. Results are given for δ = 0.0001 (solid lines) and δ = 0.001 (dashed lines). Lines mapping the solid points were obtained by using equations 3b, 4a, and 4b from ref. 26, which assume no recombination. The strongly upwardly bowed curve for δ = 0.0001 denotes the theoretical results for freely recombining sites, obtained with Eq. 6; this curve is off the graph scale for δ = 0.001. For each δ, the lower sets of data refer to the situation in which recombination is expected to maximally benefit the time to establishment (c = s/2), with the theoretical results (curved lines) being obtained from Eq. 4b and Eqs. 5, with k = 100 when δ = 0.0001 and k = 1,000 when δ = 0.001. Data points denote averages obtained from 50–400 stochastic simulations of a Wright–Fisher population starting with a situation in which the derived alleles (A and B) had zero frequencies.
The analysis is necessarily more complicated when more than two alterations are required to achieve the final adaptive state, although informative theoretical results can be obtained for a few limiting cases with neutral intermediates. For highly recombining populations (c > s) large enough to be treated in a deterministic fashion ( ), the time to establishment of an adaptive allele via d − 1 intermediate states can be shown to be
 |
generations, which contrasts with the approximate result for complete linkage,
 |
(26). Here, the ratio of times to establishment with and without recombination is [d/(d − 1)](4Neu)1/d, which for Neu = 1 is ≤1.5 for d > 2. Thus, the inhibitory effect of recombination on the acquisition of an adaptive allele in large populations is expected to be small when more than two intermediate neutral steps are involved, and in fact, within the range of Neu estimates from empirical data, there is no domain of inhibition (Fig. 3).
Fig. 3.

Relationship between the mean times to establishment of an adaptive three-step allele with neutral intermediate states, with the mutation rate scaling negatively with the effective population size as defined in the text (and with the resultant values of Neu given along the upper horizontal axis). Results are given for a selective advantage of s = 0.01 (solid lines and circles) for several different rates of recombination (c, assumed to be equal between each adjacent pair of sites). The theoretical expectations for the case of no recombination are obtained from equations 5a–5d in ref. 26, with the results for two, four, and five sites given by dotted lines for reference.
With d > 2, one can also anticipate a reduction in the optimal rate of recombination. For example, with d = 3, the rate of creation of novel ABC alleles remains proportional to c, whereas the net selective advantage of such alleles is reduced to s − 2c (because there are two potential regions of recombination between the three selected sites). This result leads to an optimal c = s/3, which is in rough accord with the observations from simulated populations (Fig. 3).
Although the response of  to Ne when d > 2 is not as flat as in the case of the two-site model, it is still quite shallow. For example, with two neutral intermediate steps (d = 3), there is only a 10-fold increase in
  over a six order-of-magnitude gradient of Ne, with the response becoming progressively flatter at large Ne, especially when the recombination rate is near optimal (Fig. 3). Even when d = 4 or 5,
  scales with less than the square root of Ne in the absence of recombination (Fig. 3).
Conversion to the Absolute Timescale.
Before proceeding with a summary of the implications of the theoretical results, one final scaling issue needs to be addressed. The predicted mean times of establishment of complex adaptations have been given above in units of generations, whereas generation length (γ) varies dramatically among organisms. To determine the scaling of various forms of adaptive potential on an absolute timescale, such variation must be taken into account. Drawing from observations outlined in SI Text, it is assumed below that γ is proportional to Ne−0.8. This assumption means that the scalings for  given in the preceding section must be multiplied by Ne−0.8 to convert to absolute time, although the exponent in this conversion could be off by up to 20% in either direction.
As an example of the implications of this generation-length scaling for Ne-related patterns, consider the classical situation with single-site modifications involving no epistatic effects. Each generation, 2Nu mutations arise at the site, each of which has a fixation probability of ∼2s(Ne/N) provided 4Nes > 1. The rate of adaptation is then 4Neus per generation, which with u scaling as Ne−0.6 further implies a rate scaling with Ne0.4. Taking the reciprocal of this quantity and multiplying by Ne−0.8, the mean absolute time to establishment of a one-site adaptation then scales as ∼Ne−1.2.
Now consider the situation in which the intermediate steps to a two-site adaptation are neutral. Recall from Fig. 1 that for a given level of recombination,  in generations is nearly independent of Ne, scaling as ∼Ne−0.1, which implies ∼Ne−0.9 scaling in absolute time. One caveat is that this result assumes that Ne scales linearly with the absolute population size, which may not be the case. If a power-law relationship exists, such that Ne ∝ Nβ, because the mean number of generations to establishment by tunneling is
  the scaling of
  (in generations) becomes ∝Ne0.4 − [1/(2β)]. For the case in which β = 0.5, the scaling would then be
  in generations, implying
  on the absolute timescale.
Thus, although a value of β as low as 0.5 might be unlikely, it remains clear that the absolute time to acquire a two-site adaptation is greatly reduced in populations with high Ne despite their lower per-capita mutation rates. With a Ne−1.4 scaling, for fixed s and a specific molecular challenge, the expected rate of establishment would be ∼400,000 times higher (in absolute time units) in a population with Ne = 109 (e.g., a microbe) than in one with Ne = 105 (e.g., a large vertebrate), but even if the less extreme Ne−0.9 scaling is closer to the truth, there would still be a 4,000-fold disparity in rates.
For the situation in which the intermediate states leading to a two-site adaptation are deleterious (Fig. 2), the theory developed above implies that  in generations scales with ∼N/(Neu)2 in the absence of recombination. Again letting u ∝ Ne−0.6 and N ∝ Ne1/β, the expected scaling of
  in absolute time is then ∝Ne(1/β)−1.6. Here, however, there is more uncertainty about the population-size dependency of the rate of adaptation. If Ne is a linear function of the absolute population size,
  (in absolute time) scales as Ne−0.6; i.e., larger populations are expected to acquire such adaptations much more rapidly, as in the case of neutral intermediates. However, if Ne scales as N0.5, the opposite is expected, as
  is then ∝ Ne0.4.
Thus, provided β > 0.62, even though mildly deleterious intermediate-state alleles are much less likely to drift to high frequency in large populations, and mutation rates are depressed, the larger number of mutational targets results in an overall elevation in the rate of progression toward adaptation by stochastic tunneling. Such scaling is inconsistent with the classical view that populations must be small and/or fragmented to progress from one adaptive peak to another (35, 36), which ignores the fact that stochastic tunneling of secondary mutations allows populations to navigate adaptive valleys with only negligible decline in mean population fitness.
Discussion
To achieve a general understanding of the mechanisms by which complex adaptations emerge, it is essential to determine whether lineages endowed with different strengths of mutation, recombination, and random genetic drift are more or less open to specific evolutionary pathways. Although it can be theoretically informative to treat each of these variables in an independent manner, the strong interdependencies found in natural populations may influence adaptive processes in unanticipated ways. For example, higher mutation rates in multicellular species magnify the rate of input of potentially exploitable genetic variation per capita on a per-generation basis, whereas the enhanced power of random genetic drift facilitates the fixation of mildly deleterious intermediate-state alleles. On the other hand, the greater number of individuals in microbial populations more than compensates for the lower per-capita mutation rate, but reduces the probability of fixing deleterious intermediate-state alleles, while facilitating progression to novel adaptive combinations via stochastic tunneling. The preceding results suggest ways in which these complexities collectively interact to define the relationship between Ne and the rate of acquisition of various forms of adaptation.
Although the scaling of  with population size is relatively insensitive to the rate of recombination, the absolute values of
  can be affected, although usually only moderately. Two of the simplest results can be arrived at in a fairly intuitive manner. First, if the recombination rate between selected sites exceeds the selective advantage of the final adaptation, recombinational breakdown will impose a strong barrier to establishment of the adaptation unless the intermediate states are effectively neutral, in which case mutation pressure can eventually lead to fixation. Second, for lower recombination rates (c < s), the rate of establishment of a multisite adaptation is maximized at the point where the product of the rate of recombination and the adaptive haplotype's net selective advantage is maximized, c = s/2 with two sites and apparently 0 ≤ c < s/2 with three or more sites. Thus, the role that recombination plays in the origin of specific adaptations cannot be reduced to a simple generalization—it depends on both the selective advantage of the final product and the physical distance between the genomic sites of the underlying sites of mutation. Only a narrow range of combinations of these parameters is compatible with a significant advantage of recombination from the standpoint of complex adaptations.
Several attempts have been made to understand the degree to which global modifiers of the recombination rate are likely to evolve in different population-genetic contexts, such as the burden of recurrent deleterious mutation (e.g., refs. 37–39). Because of the physical constraints on the meiotic process, genome-wide modifications of the recombination rate appear to be more attainable through alterations in the frequency of sexual reproduction rather than changes in crossover rates per chromosome. However, regardless of the mechanisms responsible for interspecific variation in the recombination rate, it remains that a level of recombination that enhances the rate of acquisition of some types of adaptations will inhibit the establishment of others.
Further quantitative insight into the effects of recombination on the mutational establishment of complex adaptations can be acquired by considering the situation in various phylogenetic lineages. For sexually reproducing organisms, there is a strong negative scaling between the average recombination rate per physical distance and genome size (2). Such rates are generally in the range of 10−7–10−6 per nucleotide site per meiotic event in unicellular eukaryotes, 10−8–10−7 in invertebrates, and 10−9–10−7 in vertebrates and land plants. Although prokaryotes do not engage in meiosis, they are generally recombinogenic, with ratios of the rates of recombination and mutation per site averaging to ∼3.3 (2), which, given the mutation rates in prokaryotes (3), implies average per-site recombination rates on the order of 10−9.
Now consider a two-site adaptation with a strong selective advantage of s = 0.02, in which case the optimal recombination rate for evolutionary progress is 0.01 under the two-site model. For per-site recombination rates of 10−9, 10−8, 10−7, and 10−6, the optimal c will then be achieved for sites separated by physical distances of 107, 106, 105, and 104 nucleotides, respectively. These critical distances will be 10-fold smaller for adaptive combinations with s = 0.002. Because of the inclusion of introns, many pairs of coding nucleotides in the genes of multicellular eukaryotes are separated by as many as 104–105 nucleotides, more so in the bloated genomes of vertebrates and land plants. Consequently, the recombinational environment of such species appears to be adequate to sometimes elevate the rate of procurement of complex adaptations involving sufficiently spaced sites at the within-gene level. On the other hand, the rate of acquisition of adaptations involving the joint changes at pairs of noncontiguous genes will generally be affected only minimally by recombination unless c > s (genes on different chromosomes), in which case recombination will strongly impede the rate of adaptation if the intermediate states are deleterious. In contrast, because prokaryotic genomes generally contain <107 nucleotide sites, we can expect almost all complex adaptations with >1% selective advantage (involving both within- and among-locus changes) to be procured at rates similar to those predicted in the absence of recombination.
In summary, the preceding results suggest that some general scaling properties may exist for the rapidity with which various types of adaptations can be assimilated in different population-genetic contexts. In particular, prokaryotes appear to be much more efficient than eukaryotes at promoting simple to moderately complex molecular adaptations, and substantially so for those involving joint changes at different genetic loci. In contrast, adaptations requiring three or more novel mutations may arise more frequently in small populations, regardless of the level of recombination between selected sites. In the absence of comprehensive information on the molecular basis of adaptation in multiple lineages (i.e., the typical number of sites involved and their degree of epistatic interactions), these general predictions are currently difficult to test. Nevertheless, the ideas presented herein are likely to bear significantly on a number of ongoing controversies regarding the nature of adaptation, including the barriers imposed by adaptive valleys in a fitness landscape (22, 40), the role of compensatory mutation in evolution (41), and the relative rates of incorporation of adaptive and nonadaptive mutations in various lineages (42–44).
Supplementary Material
Acknowledgments
I am very grateful to M. Hahn, R. Neher, A. Orr, B. Shraiman, and D. Weinreich for critical comments and to the Kavli Institute of Theoretical Physics for supporting my short visit during which this project was completed. This work was supported by National Institutes of Health Grant R01 GM036827 and National Science Foundation Grant EF-0827411 (to M.L.).
Footnotes
The author declares no conflict of interest.
This article contains supporting information online at www.pnas.org/lookup/suppl/doi:10.1073/pnas.1010836107/-/DCSupplemental.
References
- 1.Lynch M. The origins of eukaryotic gene structure. Mol Biol Evol. 2006;23:450–468. doi: 10.1093/molbev/msj050. [DOI] [PubMed] [Google Scholar]
- 2.Lynch M. The Origins of Genome Architecture. Sunderland, MA: Sinauer; 2007. [Google Scholar]
- 3.Lynch M. Evolution of the mutation rate. Trends Genet. 2010;26:345–352. doi: 10.1016/j.tig.2010.05.003. [DOI] [PMC free article] [PubMed] [Google Scholar]
- 4.Charlesworth B. Fundamental concepts in genetics: Effective population size and patterns of molecular evolution and variation. Nat Rev Genet. 2009;10:195–205. doi: 10.1038/nrg2526. [DOI] [PubMed] [Google Scholar]
- 5.Lynch M. The cellular, developmental and population-genetic determinants of mutation-rate evolution. Genetics. 2008;180:933–943. doi: 10.1534/genetics.108.090456. [DOI] [PMC free article] [PubMed] [Google Scholar]
- 6.Smith JM. Natural selection and the concept of a protein space. Nature. 1970;225:563–564. doi: 10.1038/225563a0. [DOI] [PubMed] [Google Scholar]
- 7.Gillespie JH. A simple stochastic gene substitution model. Theor Popul Biol. 1983;23:202–215. doi: 10.1016/0040-5809(83)90014-x. [DOI] [PubMed] [Google Scholar]
- 8.Orr HA. Adaptation and the cost of complexity. Evolution. 2000;54:13–20. doi: 10.1111/j.0014-3820.2000.tb00002.x. [DOI] [PubMed] [Google Scholar]
- 9.Orr HA. The population genetics of adaptation: The adaptation of DNA sequences. Evolution. 2002;56:1317–1330. doi: 10.1111/j.0014-3820.2002.tb01446.x. [DOI] [PubMed] [Google Scholar]
- 10.Rokyta DR, Beisel CJ, Joyce P. Properties of adaptive walks on uncorrelated landscapes under strong selection and weak mutation. J Theor Biol. 2006;243:114–120. doi: 10.1016/j.jtbi.2006.06.008. [DOI] [PubMed] [Google Scholar]
- 11.Martin G, Lenormand T. The distribution of beneficial and fixed mutation fitness effects close to an optimum. Genetics. 2008;179:907–916. doi: 10.1534/genetics.108.087122. [DOI] [PMC free article] [PubMed] [Google Scholar]
- 12.Desai MM, Fisher DS. Beneficial mutation selection balance and the effect of linkage on positive selection. Genetics. 2007;176:1759–1798. doi: 10.1534/genetics.106.067678. [DOI] [PMC free article] [PubMed] [Google Scholar]
- 13.Neher RA, Shraiman BI, Fisher DS. Rate of adaptation in large sexual populations. Genetics. 2010;184:467–481. doi: 10.1534/genetics.109.109009. [DOI] [PMC free article] [PubMed] [Google Scholar]
- 14.Ffrench-Constant RH, Daborn PJ, Le Goff G. The genetics and genomics of insecticide resistance. Trends Genet. 2004;20:163–170. doi: 10.1016/j.tig.2004.01.003. [DOI] [PubMed] [Google Scholar]
- 15.Hubbard JK, Uy JA, Hauber ME, Hoekstra HE, Safran RJ. Vertebrate pigmentation: From underlying genes to adaptive function. Trends Genet. 2010;26:231–239. doi: 10.1016/j.tig.2010.02.002. [DOI] [PubMed] [Google Scholar]
- 16.Chan YF, et al. Adaptive evolution of pelvic reduction in sticklebacks by recurrent deletion of a Pitx1 enhancer. Science. 2010;327:302–305. doi: 10.1126/science.1182213. [DOI] [PMC free article] [PubMed] [Google Scholar]
- 17.Gillespie JH. Molecular evolution over the mutational landscape. Evolution. 1984;38:1116–1129. doi: 10.1111/j.1558-5646.1984.tb00380.x. [DOI] [PubMed] [Google Scholar]
- 18.Higgs PG. Compensatory neutral mutations and the evolution of RNA. Genetica. 1998;102–103:91–101. [PubMed] [Google Scholar]
- 19.Carter AJR, Wagner GP. Evolution of functionally conserved enhancers can be accelerated in large populations: A population-genetic model. Proc Biol Sci. 2002;269:953–960. doi: 10.1098/rspb.2002.1968. [DOI] [PMC free article] [PubMed] [Google Scholar]
- 20.Komarova NL, Sengupta A, Nowak MA. Mutation-selection networks of cancer initiation: Tumor suppressor genes and chromosomal instability. J Theor Biol. 2003;223:433–450. doi: 10.1016/s0022-5193(03)00120-6. [DOI] [PubMed] [Google Scholar]
- 21.Iwasa Y, Michor F, Nowak MA. Stochastic tunnels in evolutionary dynamics. Genetics. 2004;166:1571–1579. doi: 10.1534/genetics.166.3.1571. [DOI] [PMC free article] [PubMed] [Google Scholar]
- 22.Weinreich DM, Chao L. Rapid evolutionary escape by large populations from local fitness peaks is likely in nature. Evolution. 2005;59:1175–1182. [PubMed] [Google Scholar]
- 23.Durrett R, Schmidt D. Waiting for two mutations: With applications to regulatory sequence evolution and the limits of Darwinian evolution. Genetics. 2008;180:1501–1509. doi: 10.1534/genetics.107.082610. [DOI] [PMC free article] [PubMed] [Google Scholar]
- 24.Schweinsberg J. The waiting time for m mutations. Electron J Probab. 2008;13:1442–1478. [Google Scholar]
- 25.Weissman DB, Desai MM, Fisher DS, Feldman MW. The rate at which asexual populations cross fitness valleys. Theor Popul Biol. 2009;75:286–300. doi: 10.1016/j.tpb.2009.02.006. [DOI] [PMC free article] [PubMed] [Google Scholar]
- 26.Lynch M, Abegg A. The rate of establishment of complex adaptations. Mol Biol Evol. 2010;27:1404–1414. doi: 10.1093/molbev/msq020. [DOI] [PMC free article] [PubMed] [Google Scholar]
- 27.Fisher RA. The Genetical Theory of Natural Selection. Oxford: Oxford Univ Press; 1930. [Google Scholar]
- 28.Muller HJ. Some genetic aspects of sex. Am Nat. 1932;66:118–138. [Google Scholar]
- 29.Moran PAP. The Statistical Processes of Evolutionary Theory. Oxford: Clarendon; 1962. [Google Scholar]
- 30.Christiansen FB, Otto SP, Bergman A, Feldman MW. Waiting with and without recombination: The time to production of a double mutant. Theor Popul Biol. 1998;53:199–215. doi: 10.1006/tpbi.1997.1358. [DOI] [PubMed] [Google Scholar]
- 31.Neher RA, Shraiman BI. Competition between recombination and epistasis can cause a transition from allele to genotype selection. Proc Natl Acad Sci USA. 2009;106:6866–6871. doi: 10.1073/pnas.0812560106. [DOI] [PMC free article] [PubMed] [Google Scholar]
- 32.Iwasa Y, Michor F, Komarova NL, Nowak MA. Population genetics of tumor suppressor genes. J Theor Biol. 2005;233:15–23. doi: 10.1016/j.jtbi.2004.09.001. [DOI] [PubMed] [Google Scholar]
- 33.Eshel I, Feldman MW. On the evolutionary effect of recombination. Theor Popul Biol. 1970;1:88–100. doi: 10.1016/0040-5809(70)90043-2. [DOI] [PubMed] [Google Scholar]
- 34.Walsh JB. Rate of accumulation of reproductive isolation by chromosome rearrangements. Am Nat. 1982;120:510–532. [Google Scholar]
- 35.Provine WB, editor. Evolution: Selected Papers of Sewall Wright. Chicago: Univ Chicago Press; 1986. [Google Scholar]
- 36.Goodnight CJ. Peak shifts in large populations. Heredity. 2006;96:5–6. doi: 10.1038/sj.hdy.6800746. [DOI] [PubMed] [Google Scholar]
- 37.Barton NH, Otto SP. Evolution of recombination due to random drift. Genetics. 2005;169:2353–2370. doi: 10.1534/genetics.104.032821. [DOI] [PMC free article] [PubMed] [Google Scholar]
- 38.Keightley PD, Otto SP. Interference among deleterious mutations favours sex and recombination in finite populations. Nature. 2006;443:89–92. doi: 10.1038/nature05049. [DOI] [PubMed] [Google Scholar]
- 39.Hartfield M, Otto SP, Keightley PD. The role of advantageous mutations in enhancing the evolution of a recombination modifier. Genetics. 2010;184:1153–1164. doi: 10.1534/genetics.109.112920. [DOI] [PMC free article] [PubMed] [Google Scholar]
- 40.Wade MJ, Goodnight CJ. The theories of Fisher and Wright in the context of metapopulations: When nature does many small experiments. Evolution. 1998;52:1537–1553. doi: 10.1111/j.1558-5646.1998.tb02235.x. [DOI] [PubMed] [Google Scholar]
- 41.Meer MV, Kondrashov AS, Artzy-Randrup Y, Kondrashov FA. Compensatory evolution in mitochondrial tRNAs navigates valleys of low fitness. Nature. 2010;464:279–282. doi: 10.1038/nature08691. [DOI] [PubMed] [Google Scholar]
- 42.Eyre-Walker A. The genomic rate of adaptive evolution. Trends Ecol Evol. 2006;21:569–575. doi: 10.1016/j.tree.2006.06.015. [DOI] [PubMed] [Google Scholar]
- 43.Hahn MW. Toward a selection theory of molecular evolution. Evolution. 2008;62:255–265. doi: 10.1111/j.1558-5646.2007.00308.x. [DOI] [PubMed] [Google Scholar]
- 44.Sella G, Petrov DA, Przeworski M, Andolfatto P. Pervasive natural selection in the Drosophila genome? PLoS Genet. 2009;5:e1000495. doi: 10.1371/journal.pgen.1000495. [DOI] [PMC free article] [PubMed] [Google Scholar]
Associated Data
This section collects any data citations, data availability statements, or supplementary materials included in this article.