

Abstract
Background
Clinical decision rules can aid in referral decisions for ultrasonography in patients suspected of having deep venous thrombosis (DVT), but physicians are not always convinced of their usefulness and rely on their own judgement.
Aim
To compare the performance of a clinical decision rule with the probability of DVT presence as estimated by GPs.
Design of study
Cross-sectional survey.
Setting
Primary care practices in The Netherlands.
Method
GPs (n = 300) estimated the probability of the presence of DVT (range 0–100%) and calculated the score for the clinical decision rule in 1028 consecutive patients with suspected DVT. The clinical decision rule uses a threshold of three points and so, for the GP estimates, thresholds were introduced at 10% and 20%. If scores were below these estimates, it was not considered necessary to refer patients for further examination. Differences between the clinical decision rule and the GP estimates were calculated; this is discrimination (c-statistic) and classification of patients.
Results
Data of 1002 patients were eligible for analysis. DVT was observed in 136 (14%) patients. Both the clinical decision rule and GP estimates had good discriminative power (c-statistic of 0.80 and 0.82 respectively). Fewer patients were referred when using the clinical decision rule compared with a referral decision based on GP estimates: 51% versus 79% and 65% (thresholds at 10% and 20% respectively). Both strategies missed a similar and low proportion of patients who did have DVT (range 1.4–2.0%).
Conclusion
In patients suspected of DVT both GP estimates and a clinical decision rule can safely discriminate in patients with and without DVT. However, fewer patients are referred for ultrasonography when GPs rely on a clinical decision rule to guide their decision making.
Keywords: clinical decision rules; clinical gestalt; decision support systems, clinical; deep venous thrombosis; primary care; probability estimations
INTRODUCTION
In diagnostic research, the development and validation of clinical decision rules has become increasingly popular.1-5 Diagnostic clinical decision rules often combine signs, symptoms, and additional laboratory or imaging test results to estimate the probability of presence (or absence) of a certain disease or to estimate a score that is subsequently related to this disease probability. In order to enhance decision making, a threshold in the probability, or score, is sometimes introduced to categorise patients into groups of, for example, low, moderate, or high risk of having the disease.
Diagnostic clinical decision rules are developed for physicians to objectivate and guide their decision making and reduce unnecessary patient burden and costs.6 Well-known examples are the Ottawa ankle rules,7 and rules for the diagnosis of deep venous thrombosis (DVT)8,9 and pulmonary embolism.10,11 For example, the use of the Ottawa ankle rules to decide on further diagnostic management leads to a relative reduction in ankle radiography of around 25%.12 The Wells rule for excluding DVT can safely reduce the number of referrals for further testing by 30–50% in a secondary-care setting.13
Despite these positive results, a number of obstacles can impede the use of clinical decision rules in daily practice. Several authors have described barriers for effective use of them, varying from a physician's disdain for ‘cookbook medicine’ or the unpractical use of the decision rule instrument itself in busy daily clinical practice.4,14,15 One of the important barriers is ‘the conviction that clinical judgement is superior to the decision rule'.4 Indeed, some studies report superiority of physicians’ judgement above a formal clinical decision rule.1"9 However, subjective estimation by physicians can also be inaccurate, resulting in both systematic overestimation and underestimation.20,21 In addition, physicians in daily practice, who are provided with risk-calculation tools, sometimes use them inappropriately.22
Although many clinical decision rules have been developed to diagnose DVT, there are almost no studies that compare the performance of physicians’ estimates or empirical assessment with that of a formal clinical decision rule. Current studies available showed that, although both empirical assessment of physicians and assessment of a clinical decision rule had similar overall accuracy in diagnosing DVT, concordance between both methods was poor.23,24 For physicians working in primary care, however, either strategy — empirical assessment or a formal clinical decision rule — will be used to guide patient management.
It is important to identify patients at low risk of developing DVT so it can be excluded without referral for imaging tests. This is particularly pertinent as most patients suspected of having DVT are not diagnosed and accessibility of imaging tests is often poor in primary care. Discrepancies between both strategies regarding the possibility of excluding DVT without imaging are currently not known. Perhaps, as a consequence, many physicians in daily practice tend to trust their own clinical judgement instead of a formal clinical decision rule when they have to decide whether or not to refer those patients suspected of having DVT for imaging tests.
This study was carried out to learn more about these discrepancies between physicians’ probability estimates and estimations by a formal clinical decision rule. The DVT probability classification of patients suspected of having DVT by a clinical decision rule9,25,26 was compared with the GPs’ probability estimates in primary care. Consequently, the aim was to provide guidance for physicians working in daily practice on which approach is better to safely and efficiently exclude DVT (without referral for imaging tests) in patients suspected of having it.
METHOD
Patients, setting, and scoring tool
The present study was a secondary analysis of a recently conducted study among 1086 primary care patients suspected of having DVT. Written informed consent was obtained from all patients and the study was approved by the local ethic review boards. The design and main results of the study have been published elsewhere.25
Briefly, the aim of the main study was to quantify the safety and accuracy of a diagnostic clinical decision rule to exclude DVT when used by GPs. This clinical decision rule — the Oudega rule — was specifically derived and validated to determine the presence versus absence of DVT in primary care patients suspected of having DVT,9,25,26as the Wells rule (commonly used in a hospital setting) cannot safely exclude DVT in primary care.27 The Oudega rule includes predictors from patient history, physical examination, and the D-dimertest result (Table 1).9
Table 1.
Variables of the Oudega rule.
| Variable | Points | Regression coefficienta |
|---|---|---|
| Male sex | 1 | 0.59 |
| Oral contraceptive use | 1 | 0.75 |
| Presence of active malignancy (within last 6 months) | 1 | 0.42 |
| Major surgery (last 3 months) | 1 | 0.38 |
| Absence of leg trauma | 1 | 0.60 |
| Vein distension | 1 | 0.48 |
| Calf swelling ≥3cm | 2 | 1.13 |
| Abnormal D-dimer result | 6 | 3.01 |
The score could range from 0 to 14: ≤3 = not referred for compression ultrasonography, ≥4 = directly referred for compression ultrasonography.
The score was derived from the following original logistic model: probability DVT = 1/(1+exp (-5.47+0.59*male sex + 0.75*oral contraceptive use + 0.42*presence of active malignancy + 0.38*major surgery + 0.60*absence of leg trauma + 0.48*vein distension + 1.13*calf swelling ≥3 cm + 3.01*abnormal D-dimer result). DVT= deep venous thrombosis.
Subjects were selected from 300 GPs in The Netherlands. Suspicion of DVT was based on the presence of at least one of the following symptoms: swelling, redness, or pain of the lower extremity. Patients were excluded if they were <18 years of age; received anticoagulant treatment (that is, vitamin K antagonists or low molecular weight heparin) at presentation; were pregnant; or were unwilling to participate.
Scoring the Oudega rule
Participating GPs systematically documented the eight predictors of the Oudega rule, and calculated the score for an individual patient according to the variables outlined in Table 1. D-dimer testing was performed using a point-of-care D-dimer assay (Clearview® Simplify D-dimer assay, Inverness Medical, Bedford, UK). The score could range from 0 to 14.
Physicians’ probability estimates of DVT presence
The GPs were also asked to estimate the probability of the presence of DVT on a visual analogue scale ranging from 0% to 100%. They could use the same variables as incorporated in the Oudega rule (including D-dimer testing) and were, therefore, not explicitly blinded to the result of the clinical decision rule.
Reference standard
For the main study, patients with a score of >4 on the Oudega rule were referred for compression ultrasonography; for those with a score of <3, no compression ultrasonography was performed and patients remained under the surveillance of their GP. All patients returned to their GP after 1 week for evaluation of their symptoms. If suspicion of DVT remained, a compression ultrasonography was performed after all. During 90 days of follow-up, symptomatic thromboembolic events — fatal pulmonary embolism, non-fatal pulmonary embolism, and DVT — were recorded for all patients, as assigned by an independent adjudication committee. Positive outcomes were DVT as diagnosed by compression ultrasonography, venous thromboembolic complications, or death due to a possible thrombo-embolic event during the 90-day follow-up period. Negative outcomes were the absence of these events during the study period.
Comparison of the Oudega rule and GPs’ probability estimates
The Oudega rule and GPs’ probability estimates were compared using various methods. To start, the overall ability to discriminate between patients with and without DVT was estimated for both tools using the area under the receiver operating characteristic (ROC) curve. A ROC area of 0.5 reflects no discriminative ability, while a perfect diagnostic tool has a ROC area of 1.0.28
Both strategies were then compared on their diagnostic classification, as the overall discrimination does not directly reflect a diagnostic's clinical value, in terms of guiding patient management. For this purpose, the Oudega rule and the GP probability estimates were compared first on their ability to classify a group of patients as low risk. In this low-risk group, DVT is considered excluded and physicians can subsequently refrain from referring the patient for imaging. For the Oudega rule the previously developed and validated threshold of three points9,25,26 was used to classify patients into such a low-risk group. With regard to GP probability estimates, no such validated threshold exists so the probability estimates (0–10%, 10–20%, and >20%) were first trichotomised and, subsequently, thresholds at 10% and 20% (below which patients were considered low risk) were introduced.
Finaly, a classification table was constructed in which differences in classification (for patients with and without DVT) between each strategy could be quantified.29,30
All statistical analyses were performed in SPSS (version 15.0 for Windows; SPSS, Chicago, US).
RESULTS
A total of 1086 patients with clinically suspected DVT entered the study, of whom 58 met one or more of the exclusion criteria. For 26 patients, management was not completed according to protocol, so data of 1002 patients (97%) were available for analysis of their characteristics (Table 2). The mean age was 58 years and 37% were males. Most common complaints were leg pain (87%) and leg swelling (78%). The overall prevalence of DVT confirmed by objective testing was 14% (136/1002 patients).
Table 2.
Characteristics of study population (n = 1002a)
| Characteristic | Value |
|---|---|
| Age, years, mean (SD) | 57.7 (17.1) |
| Male sex | 375 (37%) |
| Leg complaints | |
| Pain | 874 (87%) |
| Swelling | 784 (78%) |
| Redness | 371 (37%) |
| Absence of leg trauma | 737 (74%) |
| Varicose veins/venous insufficiency | 337 (34%) |
| Distension of collateral veins | 151 (15%) |
| Difference in calf circumference >3cm | 304 (30%) |
| Duration of complaints, days, median | (IQR) |
| Previous episode of DVT | 159(16%) |
| Previous episode of PE | 51 (5%) |
| Paresis | 13(1%) |
| Recent surgery in previous month | 81 (8%) |
| Recent immobilisation | 75 (7%) |
| Bed rest >3 days | 72 (7%) |
| Active malignancy in past 6 months | 54 (5%) |
| Malignancy not treated in the past 6 months | 64 (6%) |
| Use of hormonal contraceptives | 107(11%) |
| Travel (car/bus/plane) >4 hours | 90 (9%) |
The full sample totals 1028 patients but data on 26 were excluded as their management was not completed according to protocol. DVT = deep venous thrombosis. IQR = interquartile range. PE = pulmonary embolism. SD = standard deviation.
ROC analysis
As Figure 1 shows, the Oudega rule and the GP probability estimates both had good and similar overall discriminative ability in diagnosing DVT. The area under the ROC curve was 0.80 (95% confidence interval [CI] = 0.77 to 0.84) and 0.82 (95% CI = 0.78 to 0.86), respectively.
Figure 1.
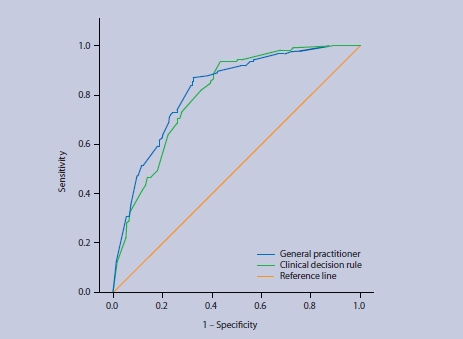
Receiver operating characteristic (ROC) curve of the Oudega rule and the GPs' probability estimates in patients suspected of having DVT.
Comparison of classification
If the decision to refer a patient suspected of having DVT for imaging was based on the Oudega rule (using the threshold of three points) 51% of suspected patients were referred for imaging (Table 3). If this decision was based only on the GP's probability estimate, the vast majority of patients suspected of having DVT were referred for imaging: 79% when using a cut off of 10% and 65% when using a cut off of 20%. In addition, the proportion of negative ultrasounds was higher when using a GP's probability estimate, compared with using the Oudega rule. Consequently, this results in a lower yield of ultrasonographies when using only a GP's probability estimate.
Table 3.
Diagnostic classification of referral decisions for the Oudega rule and GPs' probability estimates.
| Oudega rulea | GP estimate (cutoff 10%)b | GP estimate (cut off 20%)b | |
|---|---|---|---|
| Total referrals, n % of al patients suspected of having DVT (95% CI) | 502 51 (48 to 54) | 788 79 (76 to 81) | 648 65 (62 to 68) |
| Ultrasound negative referrals, n % of total referrals (95% CI) | 373 74 (70 to 78) | 655 83 (80 to 86) | 519 80 (77 to 83) |
| Total non-referrals, n % of al patients suspected of having DVT (95% CI) | 500 49 (47 to 53) | 214 21 (19 to 24) | 354 35 (32 to 38) |
| DVT failures in non-referrals, nc % of total non-referrals (95% CI) | 7 1.4 (0.4 to 2.4) | 3 1.4 (0.0 to 3.0) | 7 2.0 (0.5 to 3.4) |
The Oudega rule uses a threshold of 3 points: patients with a score ≤3 were not referred for imaging (see Table 1).
In this scenario, patients with a GP probability estimate below 10% or 20% were considered not referred for imaging
No fatal or near-fatal thrombo-embolic events occurred in any of these DVT failures in non referrals. DVT = deep venous thrombosis.
Both diagnostic strategies (the Oudega rule and GP probability estimates) resulted in a similar and low number of missed DVT cases in patients not referred (range of missed DVT cases in patients not referred 1.4—2.0% [Table 3]). In six of the seven patients missed by the Oudega rule, the GPs estimated a high probability (>20%) of DVT presence (Table 4). Using a threshold of 10% or 20% for the GP probability estimates, three and seven patients were missed respectively; the Oudega rule assigned a high score to two and six of these patients respectively (Table 4).
Table 4.
Comparing GPs' probability estimates with the Oudega rule.
| Oudega | Oudega | |
|---|---|---|
| score ≤3 | score ≥4 | |
| Patients with DVT | ||
| GP estimate <10% | 1 | 2 |
| GP estimate 10-20% | 0 | 4 |
| GP estimate >20% | 6 | 123 |
| Patients without DVT | ||
| GP estimate <10% | 186 | 25 |
| GP estimate 10-20% | 113 | 23 |
| GP estimate >20% | 194 | 325 |
DVT = deep venous thrombosis.
In patients without DVT (n = 866), more patients were correctly classified as low risk (score <3) by the Oudega rule (n = 493) than by a GP probability estimate (n = 186 using a cut off of 10% and n = 299 using a cut off of 20%). In patients correctly classified as low risk by the Oudega rule (n = 493), GPs estimated an intermediate (10–20%, n = 113) or high (>20%, n = 194) probability of DVT presence.
DISCUSSION
Summary of the main findings
The diagnostic classification of a previously developed and validated clinical decision rule (the Oudega rule) for DVT9,25,26 was compared with GP probability estimates in 1002 patients suspected of having DVT. Both the GP estimates and the Oudega rule had good overall discriminative ability and performed equally. If the decision to refer a patient was based on the Oudega rule, fewer patients were referred for imaging.
As previously described25 (using the Oudega rule) GPs can safely refrain from referring a patient in nearly half of all cases where DVT is suspected (n = 500), missing only seven patients with DVT (that is, 1.4%). Six of the seven patients in the current study whose DVT was missed were identified by the GP as having a high estimated probability (>20%) of DVT presence. However, using only the GP probability estimate also resulted in a similar number of missed DVT cases (three and seven patients, depending on the chosen threshold for the estimate). Of these patients, most had a high score on the Oudega rule. Furthermore, GPs assigned scores indicating intermediate or high probability of DVT presence to a large group of patients, despite the vast majority of subjects not having DVT (Table 4); hence, it is possible that GPs may be uncertain of adequately differentiating between patients at low versus intermediate or high risk of DVT. Given the potential risk of fatal pulmonary embolism, GPs seem to prefer to assign an intermediate or high probability to most patients and refer them for subsequent testing.
Strengths and limitations of the study
To appreciate these results a few issues need to be discussed. Although both the GP estimates and the Oudega rule are able to discriminate between patients with and without DVT, it is of higher clinical relevance to compare the classification of both approaches using thresholds that are frequently used in practice to decide on further patient management. The threshold used was previously determined following the generally accepted proportion of 2% missed cases by compression ultrasonography, which is the current reference standard.31,32 Hence, using any diagnostic strategy for DVT that misses <2% of DVT cases is considered safe.
Although the decision threshold for the Oudega rule is based on previous validation studies and a generally acceptable failure percentage of <2%, no such validated threshold(s) exist for GP probability estimates. Therefore, the GPs’ estimates were trichotomised using cut-off points at 10% and 20%. As in risk stratification, physicians often consider three groups of patients: those who probably have the disease, those who probably do not have the disease, and those with persisting doubts.33 This study's thresholds were arbitrarily chosen and different thresholds result in a different number of patients categorised as low risk. For example, increasing the threshold to 30% for the GP probability estimates will yield a similar number of patients in the low-risk category as compared with the clinical decision rule (50% for both tools, data not shown). However, this will subsequently result in more missed DVT cases as compared with the clinical decision rule (2.4% versus 1.4% respectively). Hence, based on this study, a clinical decision rule seems a better tool to safely exclude DVT in primary care, regardless of the chosen threshold for GP probability estimates.
As the Oudega rule scores and probability estimates were recorded simultaneously, it cannot be completely ruled out that the knowledge of the clinical items of the Oudega rule, as wel as the result of a D-dimer test, may have influenced the GP probability estimates; this is incorporation bias. Such incorporation bias may lead to a dilution of the difference between two diagnostic tests: the accuracy of the GP probability estimates and the Oudega rule become more alike. However, the study design does reflect clinical practice where patient characteristics and, often, also the result of a (point-of-care) D-dimer assay are known before physicians apply any risk stratification and decide on further patient management. Moreover, at the time of the study, the Oudega rule had already been included in the current guidelines for GPs in The Netherlands; therefore, avoidance of any incorporation bias, by for example blinding the GPs to the result of the clinical decision rule, was almost impossible.
Knowing how incorporation bias usually works, it was expected that this bias would have improved the GP probability estimates; that is, lower estimates in patients who did not have DVT and higher estimates in those who did have DVT. However, the GPs systematically overestimated the actual DVT risk in all patients. As such, it is believed that the influence of this incorporation bias was less than expected a priori. It would likely not have influenced the main inference of this study; that is, that more patients would be referred for imaging and additional work up if the referral decision was based only on a GP's probability estimate.
Finally, in contrast to a clinical decision rule, clinical judgement alone is very contextual and may change over time depending on a GP's professional learning and feedback. Hence, a comparison between both tools may be different in different groups of GPs who have varying levels of experience. This may reduce the generalisability of the results. However, this study was conducted in three different regions in The Netherlands and included 300 different GPs with different levels of experience. Accordingly, it is possible that this large group of GPs can be regarded as a representative sample of (Dutch) GPs, thus making these results, — in the authors’ view — generalisable for primary care physicians in The Netherlands. As many countries share similar vocational training programmes for GPs (including the UK) these results may be also applicable for GPs in these countries.34
Comparison with existing literature
Although previous studies have demonstrated that concordance between a clinical decision rule and physicians’ probability estimates is poor,23,24 to the best of the authors’ knowledge this study is the first to compare GP probability estimates with a formal clinical decision rule (in the domain of primary care) in terms of discrimination and classification of patients. Therefore, results can not be easily compared with existing literature.
Knowledge about the performance of a formal clinical decision rule, compared with physicians’ judgements is important because physicians often feel reluctant to use clinical decision rules for a number of reasons. One of these is the conviction that their own clinical judgement is at least as good as, or even superior to, a decision rule.4 Indeed, a recent survey demonstrated that, although >90% of physicians were aware of the existence of clinical decision rules for assessing patients suspected of pulmonary embolism, only 44% reported using them in daily practice.35 The same may well apply to GPs’ management of patients suspected of having DVT.
The authors and Campbell et al,36 believe that implementation of a clinical decision rule in formal guidelines can improve quality of care for patients suspected of having DVT. Making GPs aware of the patients for whom there is added value of using such a rule improves their implementation and, as such, the quality of care of patients in whom DVT is suspected to be present.
Implications for clinical practice
The present study yielded various clinical implications. The Oudega rule is a safe diagnostic instrument that can be used in patients suspected of DVT as it misses an acceptably small proportion (<2%) of DVT cases. In addition, clinical judgement alone often leads to GPs overestimating the actual DVT risk and, subsequently, results in more unnecessary referrals for compression ultrasonography in a large group of patients. Taking this into account, physicians should carefully weigh the patient burden and costs involved with these unnecessary referrals or use the Oudega rule.
Acknowledgments
We gratefully acknowledge the enthusiastic participation of GPs and other healthcare professionals who contributed to the study. The steering and writing committee of the AMUSE study group: Academic Medical Center Amsterdam, the Netherlands: Harry R Büller PhD, MD, Eit F van der Velde MD, Henk CPM van Weert MD; Maastricht University Medical Center, the Netherlands: Arina J ten Cate-Hoek PhD, MD, Manuela A Joore PhD, Martin H Prins PhD, MD, Henri EJH Stoffers PhD, MD; University Medical Center Utrecht, the Netherlands: Arno W Hoes PhD, MD, Karel GM Moons PhD, Ruud Oudega PhD, MD, Diane B Toll PhD.
Funding body
The study was funded by the Netherlands Organization for Scientific Research (945-04-009) and the Netherlands Heart Foundation (2006B237). These funding sources had no role in the design, conduct, or reporting of the study, or in the decision to submit the manuscript for publication.
Ethical approval
This study was approved by the Medical Ethical Committee of the Maastricht University Medical Center, The Netherlands.
Competing interests
The authors have stated that there are none.
Discuss this article
Contribute and read comments about this article on the Discussion Forum: http://www.rcgp.org.uk/bjgp-discuss
REFERENCES
- 1.Laupacis A, Sekar N, Stiell IG. Clinical prediction rules. A review and suggested modifications of methodological standards. JAMA. 1997;277(6):488–94. [PubMed] [Google Scholar]
- 2.Moons KG, Grobbee DE. Diagnostic studies as multivariable, prediction research. J Epidemiol Community Health. 2002;56(5):337–338. doi: 10.1136/jech.56.5.337. [DOI] [PMC free article] [PubMed] [Google Scholar]
- 3.Moons KG, Biesheuvel CJ, Grobbee DE. Test research versus diagnostic research. Clin Chem. 2004;50(3):473–76. doi: 10.1373/clinchem.2003.024752. [DOI] [PubMed] [Google Scholar]
- 4.Reilly BM, Evans AT. Translating clinical research into clinical practice: impact of using prediction rules to make decisions. Ann Intern Med. 2006;144(3):201–209. doi: 10.7326/0003-4819-144-3-200602070-00009. [DOI] [PubMed] [Google Scholar]
- 5.Toll DB, Janssen KJ, Vergouwe Y, Moons KG. Validation, updating and impact of clinical prediction rules: a review. J Clin Epidemiol. 2008;61(11):1085–1094. doi: 10.1016/j.jclinepi.2008.04.008. [DOI] [PubMed] [Google Scholar]
- 6.Moons KG, Royston P, Vergouwe Y, et al. Prognosis and prognostic research: what, why, and how? BMJ. 2009;338:b375. doi: 10.1136/bmj.b375. [DOI] [PubMed] [Google Scholar]
- 7.Stiell IG, Greenberg GH, McKnight RD, et al. Decision rules for the use of radiography in acute ankle injuries. Refinement and prospective validation. JAMA. 1993;269(9):1127–1132. doi: 10.1001/jama.269.9.1127. [DOI] [PubMed] [Google Scholar]
- 8.Wells PS, Anderson DR, Rodger M, et al. Evaluation of D-dimer in the diagnosis of suspected deep-vein thrombosis. N Engl J Med. 2003;349(13):1227–1235. doi: 10.1056/NEJMoa023153. [DOI] [PubMed] [Google Scholar]
- 9.Oudega R, Moons KG, Hoes AW. Ruling out deep venous thrombosis in primary care. A simple diagnostic algorithm including D-dimer testing. Thromb Haemost. 2005;94(1):200–205. doi: 10.1160/TH04-12-0829. [DOI] [PubMed] [Google Scholar]
- 10.Le Gal G, Righini M, Roy PM, et al. Prediction of pulmonary embolism in the emergency department: the revised Geneva score. Ann Intern Med. 2006;144(3):165–171. doi: 10.7326/0003-4819-144-3-200602070-00004. [DOI] [PubMed] [Google Scholar]
- 11.Wells PS, Anderson DR, Rodger M, et al. Excluding pulmonary embolism at the bedside without diagnostic imaging: management of patients with suspected pulmonary embolism presenting to the emergency department by using a simple clinical model and d-dimer. Ann Intern Med. 2001;135(2):98–107. doi: 10.7326/0003-4819-135-2-200107170-00010. [DOI] [PubMed] [Google Scholar]
- 12.Perry JJ, Stiell IG. Impact of clinical decision rules on clinical care of traumatic injuries to the foot and ankle, knee, cervical spine, and head. Injury. 2006;37(12):1157–1165. doi: 10.1016/j.injury.2006.07.028. [DOI] [PubMed] [Google Scholar]
- 13.Ten Cate-Hoek AJ, Prins MH. Management studies using a combination of D-dimer test result and clinical probability to rule out venous thromboembolism: a systematic review. J Thromb Haemost. 2005;3(11):2465–2470. doi: 10.1111/j.1538-7836.2005.01556.x. [DOI] [PubMed] [Google Scholar]
- 14.Kawamoto K, Houlihan CA, Balas EA, Lobach DF. Improving clinical practice using clinical decision support systems: a systematic review of trials to identify features critical to success. BMJ. 2005;330(7494):765. doi: 10.1136/bmj.38398.500764.8F. [DOI] [PMC free article] [PubMed] [Google Scholar]
- 15.Moons KG, Altman DG, Vergouwe Y, Royston P. Prognosis and prognostic research: application and impact of prognostic models in clinical practice. BMJ. 2009;338:b606. doi: 10.1136/bmj.b606. [DOI] [PubMed] [Google Scholar]
- 16.Cameron C, Naylor CD. No impact from active dissemination of the Ottawa Ankle Rules: further evidence of the need for local implementation of practice guidelines. CMAJ. 1999;160(8):1165–1168. [PMC free article] [PubMed] [Google Scholar]
- 17.Glas AS, Pijnenburg BA, Lijmer JG, et al. Comparison of diagnostic decision rules and structured data collection in assessment of acute ankle injury. CMAJ. 2002;166(6):727–733. [PMC free article] [PubMed] [Google Scholar]
- 18.Goldman L, Cook EF, Johnson PA, et al. Prediction of the need for intensive care in patients who come to the emergency departments with acute chest pain. N Engl J Med. 1996;334(23):1498–1504. doi: 10.1056/NEJM199606063342303. [DOI] [PubMed] [Google Scholar]
- 19.Tierney WM, Fitzgerald J, McHenry R, et al. Physicians’ estimates of the probability of myocardial infarction in emergency room patients with chest pain. Med Decis Making. 1986;6(1):12–17. doi: 10.1177/0272989X8600600103. [DOI] [PubMed] [Google Scholar]
- 20.Grover SA, Lowensteyn I, Esrey KL, et al. Do doctors accurately assess coronary risk in their patients? Preliminary results of the coronary health assessment study. BMJ. 1995;310(6985):975–978. doi: 10.1136/bmj.310.6985.975. [DOI] [PMC free article] [PubMed] [Google Scholar]
- 21.Montgomery AA, Fahey T, MacKintosh C, et al. Estimation of cardiovascular risk in hypertensive patients in primary care. BrJ Gen Pract. 2000;50(451):127–128. [PMC free article] [PubMed] [Google Scholar]
- 22.McManus RJ, Mant J, Meulendijks CF, et al. Comparison of estimates and calculations of risk of coronary heart disease by doctors and nurses using different calculation tools in general practice: cross sectional study. BMJ. 2002;324(7335):459–464. doi: 10.1136/bmj.324.7335.459. [DOI] [PMC free article] [PubMed] [Google Scholar]
- 23.Miron MJ, Perrier A, Bounameaux H. Clinical assessment of suspected deep vein thrombosis: comparison between a score and empirical assessment. J Intern Med. 2000;247(2):249–254. doi: 10.1046/j.1365-2796.2000.00605.x. [DOI] [PubMed] [Google Scholar]
- 24.Wells PS, Hirsh J, Anderson DR, et al. simple clinical model for the diagnosis of deep-vein thrombosis combined with impedance plethysmography: potential for an improvement in the diagnostic process. J Intern Med. 1998;243(1):15–23. doi: 10.1046/j.1365-2796.1998.00249.x. [DOI] [PubMed] [Google Scholar]
- 25.Büller HR, Ten Cate-Hoek AJ, Hoes AW, et al. Safely ruling out deep venous thrombosis in primary care. Ann Intern Med. 2009;150(4):229–235. [PubMed] [Google Scholar]
- 26.Toll DB, Oudega R, Bulten RJ, et al. Excluding deep vein thrombosis safely in primary care. JFam Pract. 2006;55(7):613–618. [PubMed] [Google Scholar]
- 27.Oudega R, Hoes AW, Moons KG. The Wells rule does not adequately rule out deep venous thrombosis in primary care patients. Ann Intern Med. 2005;143(2):100–107. doi: 10.7326/0003-4819-143-2-200507190-00008. [DOI] [PubMed] [Google Scholar]
- 28.Van der Schouw YT, Verbeek AL, Ruijs JH. ROC curves for the initial assessment of new diagnostic tests. Fam Pract. 1992;9(4):506–511. doi: 10.1093/fampra/9.4.506. [DOI] [PubMed] [Google Scholar]
- 29.Cook NR, Ridker PM. Advances in measuring the effect of individual predictors of cardiovascular risk: the role of reclassification measures. Ann Intern Med. 2009;150(11):795–802. doi: 10.7326/0003-4819-150-11-200906020-00007. [DOI] [PMC free article] [PubMed] [Google Scholar]
- 30.Pencina MJ, D'Agostino RB, Sr, D'Agostino RB, Jr, Vasan RS. Evaluating the added predictive ability of a new marker: from area under the ROC curve to reclassification and beyond. Stat Med. 2008;27(2):157–172. doi: 10.1002/sim.2929. [DOI] [PubMed] [Google Scholar]
- 31.Goodacre S, Sampson F, Thomas S, et al. Systematic review and meta- analysis of the diagnostic accuracy of ultrasonography for deep vein thrombosis. BMC Med Imaging. 2005;5:6. doi: 10.1186/1471-2342-5-6. [DOI] [PMC free article] [PubMed] [Google Scholar]
- 32.Wells PS, Owen C, Doucette S, et al. Does this patient have deep vein thrombosis? JAMA. 2006;295(2):199–207. doi: 10.1001/jama.295.2.199. [DOI] [PubMed] [Google Scholar]
- 33.Yan AT, Yan RT, Huynh T, et al. Understanding physicians’ risk stratification of acute coronary syndromes: insights from the Canadian ACS 2 Registry. Arch Intern Med. 2009;169(4):372–378. doi: 10.1001/archinternmed.2008.563. [DOI] [PubMed] [Google Scholar]
- 34.Jones R, Britten N, Culpepper L, et al., editors. Oxford textbook of primary medical care. Oxford: Oxford University Press; 2005. [Google Scholar]
- 35.Weiss CR, Haponik EF, Diette GB, et al. Pretest risk assessment in suspected acute pulmonary embolism. Acad Radiol. 2008;15(1):3–14. doi: 10.1016/j.acra.2007.07.019. [DOI] [PubMed] [Google Scholar]
- 36.Campbell S, MacDonald M, Carr B, et al. Bridging the gap between primary and secondary care: use of a clinical pathway for the investigation and management of deep vein thrombosis. J Health Serv Res Policy. 2008;13(Suppl 1):15–19. doi: 10.1258/jhsrp.2007.007015. [DOI] [PubMed] [Google Scholar]