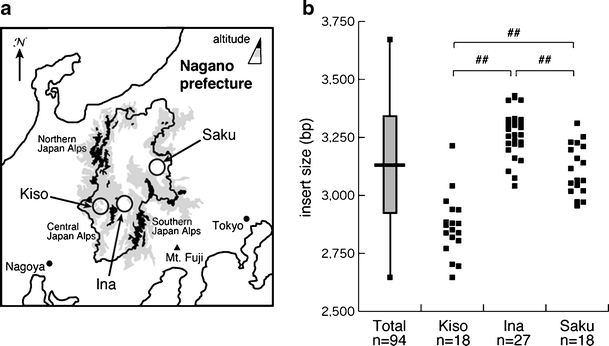
Fig. 2.

Distribution of the insertion size in endemic foci in Nagano. The location of the three endemic foci (Kiso, Ina, and Saku) in Nagano prefecture is indicated (a). The distribution of the size of insertions in the three endemic foci is shown (b). The distribution (vertical bar), the average size (horizontal bar), and the standard deviation of the size of insertion (shaded square) in all the patients (n = 94) are shown in left. ## p < 0.01
