

Abstract
Remote monitoring of physical activity using body-worn sensors provides an alternative to assessment of functional independence by subjective, paper-based questionnaires. This study investigated the classification accuracy of a combined surface electromyographic (sEMG) and accelerometer (ACC) sensor system for monitoring activities of daily living in patients with stroke. sEMG and ACC data (eight channels each) were recorded from 10 hemiparetic patients while they carried out a sequence of 11 activities of daily living (identification tasks), and 10 activities used to evaluate misclassification errors (nonidentification tasks). The sEMG and ACC sensor data were analyzed using a multilayered neural network and an adaptive neuro-fuzzy inference system to identify the minimal sensor configuration needed to accurately classify the identification tasks, with a minimal number of misclassifications from the nonidentification tasks. The results demonstrated that the highest sensitivity and specificity for the identification tasks was achieved using a subset of four ACC sensors and adjacent sEMG sensors located on both upper arms, one forearm, and one thigh, respectively. This configuration resulted in a mean sensitivity of 95.0%, and a mean specificity of 99.7% for the identification tasks, and a mean misclassification error of <10% for the nonidentification tasks. The findings support the feasibility of a hybrid sEMG and ACC wearable sensor system for automatic recognition of motor tasks used to assess functional independence in patients with stroke.
Index Terms: Accelerometry, activity monitor, adaptive neuro-fuzzy inference system, artificial neural network, electromyography, stroke, wearable sensors
I. Introduction
Stroke can result in a profound restriction of physical functioning, which may negatively impact the quality of life for stroke survivors and their care givers. Stroke is the leading cause of serious, long-term disability in the United States [1]. Approximately 4.8 million Americans are currently diagnosed with stroke and more than a million are reported to have residual difficulties in carrying out activities of daily living (ADL) [2]. The psychological and financial advantages of returning these patients to their home following acute care must be weighed against the increased health risks for falls and other catastrophic injuries that can result when discharge plans are implemented prematurely or with insufficient home-based support. Falls in the home are the leading cause of injury-related deaths among people ages 65 and older in the U.S. and represent a public health burden in health care costs that is on par with that of stroke [2].
Decisions about home-readiness in these patients rely heavily on comprehensive assessments of mobility and physical functioning. Most of the clinical assessment tools currently in use are based on either self-report or observer-rated measures. Self-report measures, although simple to acquire, can be vague or inaccurate due to poor patient memory, unsound perceptions of performance, or misjudgments of actual capability [3], [4]. Observer-rated surveys by caregivers are often time-consuming, involve limited opportunity for repeated observations, and rarely capture changes in functional status that may fluctuate throughout the day [4].
Instrumented devices that automatically and continuously monitor physical activity and functioning provide an alternative to subjective assessment tools. The objectivity and comprehensiveness of a patient’s physical performance record could be improved by a system that automatically identifies the activities carried out by the individual throughout the day, particularly in remote locations such as the patient’s home or community. Sensor-based activity monitors currently in use provide general measures of physical activity or energy expenditure based on data from accelerometer (ACC), gyroscope, or EKG sensors. ACCs are the most common sensors found in current activity monitors because of their versatility and relative ease of use. When placed on the body, ACC sensors provide kinematic information based on measurements of acceleration and position with respect to gravity. ACC signal features have been processed using neural networks to successfully differentiate sedentary activities, such as sitting or lying down, from more physically demanding activities, such as walking or running [5]–[10]. These features have also been effective in monitoring movement disorders such as tremor [11] and dyskinesia [12] in patients with Parkinson’s disease. However, ACC sensors have inherent limitations in differentiating between an active versus passive performance of a movement, or a loaded versus unloaded performance of an activity. In contrast, surface electromyographic (sEMG) sensors have an inherent advantage in distinguishing between active versus passive movements or degrees of loading because the amplitude of the sEMG signal is monotonically related to muscle torque [13]. These sensors have been used for deriving kinematic information based on the timing, frequency, and amplitude of muscle activity [14]. sEMG-based activity monitors are a rarity, however, with the majority of such devices limited to classification of gait disorders [15] or movement disorders such as tremor [16].
The work described in this paper evolved from earlier work in evaluating the feasibility of using sEMG sensors to monitor 11 specific ADL activities among a healthy control population [17]. That study achieved a sensitivity of 90% for a complement of eight sensors, and 82% for combinations of 4–6 sensors using an adaptive neuro-fuzzy inference system (ANFIS). Subsequent work [18], [19] also with normal healthy subjects, analyzed a similar set of ADL activities and demonstrated that accelerometer data combined with EMG data could significantly improve the classification performance compared to a system limited to EMG sensors. More recent attempts at classifying these ADL activities in a patient population with stroke using only sEMG sensors resulted in unacceptably low classification results of 80% sensitivity [20]–[22].
The purpose of this study was to investigate the relative merits of combining sEMG and ACC sensor data for automatic recognition of these ADL activities in a stroke patient population. The feasibility of this approach among a target patient population rather than among healthy controls is considered a critical step in the evolution of this work towards clinical use. The general approach taken in this study was to adapt the analysis procedures from these earlier investigations to this investigation and optimize the classification algorithms to a minimal set of sensor data starting from a relatively large number of EMG and ACC sensors. Developing a device with as few sensors as possible is a desirable aim in minimizing the cost and maximizing the usability of a wearable sensor system. If a combined sensor approach provides increased sensitivity and specificity of ADL task recognition, then hybrid sensors that detect sEMG and ACC signals from a single sensor encapsulation might reduce the overall number of sensors needed for functional activity monitoring among these patients.
II. Method
A. Subjects
Ten subjects (five females and five males) with a verifiable history of stroke by CAT and/or MRI scan provided written informed consent prior to their participation in this study. The age of the subjects ranged from 33 to 67 years (mean age 51.7± 11.4 years) and the average duration since the onset of their stroke was 7.5 ± 6.0 years. The subjects were within Brunnstrom’s Stage III–V rating of recovery from hemiplegia (i.e., they all had clinical signs of increased muscle tone, spasticity, and synergistic movements). Functionally, they were able to walk independently for at least 30 m with or without an assistive device, and were independent in most, but not all, daily activities. A comprehensive battery for assessing functional ability was administered prior to their participation in the study using the Fugl–Meyer assessment questionnaire [23]. Fugl–Meyer scores for these subjects confirmed that they had mild to moderate functional deficits. Further details regarding the subject population are summarized in Table I. All subjects read and signed an informed consent form approved by an Institutional Review Board.
TABLE I.
Physical Characteristics of Subjects
| Sub # | Age (years) | Sex | Height (cm) | Weight (kg) | Onset (years) | Hemi-paresis | Hand Dominance | Preferred Use | Fugl-Meyer |
|---|---|---|---|---|---|---|---|---|---|
| 1 | 43 | F | 173 | 68.0 | 13.7 | L | L | R | 194 |
| 2 | 55 | M | 158 | 63.5 | 6.5 | L | R | R | 202 |
| 3 | 55 | M | 185 | 83.9 | 1.6 | L | R | R | 221 |
| 4 | 50 | F | 168 | 90.7 | 5.9 | L | L | R | 173 |
| 5 | 65 | M | 170 | 70.3 | 4.2 | L | R | R | 190 |
| 6 | 67 | F | 152 | 104.3 | 2.8 | R | R | R | 217 |
| 7 | 37 | M | 178 | 65.8 | 15.9 | R | L | L | 173 |
| 8 | 51 | F | 170 | 54.4 | 17.8 | R | R | L | 179 |
| 9 | 61 | M | 173 | 88.0 | 4.1 | R | R | L | 176 |
| 10 | 33 | F | 168 | 59.0 | 2.2 | R | R | L | 161 |
| MEAN (SD) | 51.7 (11.4) | 169.4 (9.4) | 74.8 (16.1) | 7.5 (6.0) | 188.6 (19.9) | ||||
Onset: Time since the onset of stroke
Hemi-paresis: Side of hemiparesis
Preferred Use: Preferred upper extremity side when doing an ADL task
Fugl-Meyer: Total score
B. Data Acquisition
Signals were recorded from pairs of sEMG and ACC sensors which were placed adjacent to one another at eight anatomical sites (Fig. 1), corresponding to bilateral Anterior Deltoid, Flexor Digitorum Superficialis, Erector Spinae (L1 spinal level), and unilaterally from the Vastus Lateralis (hemiparetic side), and Rectus Abdominus (nonhemiparetic side) muscles. Selection of these sites was based on a preliminary study among healthy control subjects where data from these locations identified a similar set of motor tasks with an accuracy of 90% [17]. The sEMG signals were acquired using eight active electrodes (Model DE-2.1 DelSys, Inc.) and a Bagnoli-16 (DelSys, Inc.) system that provided a total gain of 3000, a bandwidth of 20–450 Hz (12 dB/oct roll-off), and a baseline noise < 1.25 μV (rms). A reference electrode was attached to the skin at the elbow bony prominence. The ACC signals were acquired from eight miniature uni-axial accelerometers (Analog Devices ADXL105JQC) which were preamplified to provide signals with a dynamic range of ±5 g, a maximum resolution of 10 mV (40 milligravities), and a bandwidth of dc-30 Hz. Both sEMG and ACC signals were sampled at 1000 Hz using a 16-bit A/D board (PCI-6035E, National Instruments) and EMGworks 3.0 acquisition software (DelSys, Inc). All sensors were secured to the skin by a double-sided adhesive interface.
Fig. 1.
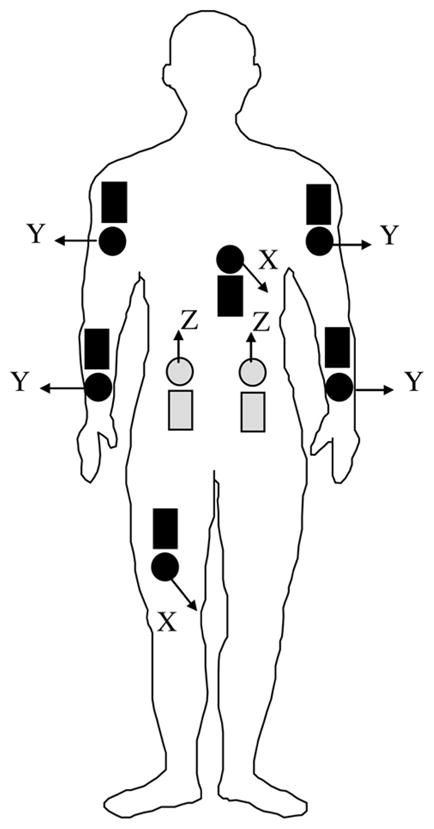
Schematic overview of the location of ACC (dark round) and sEMG (dark rectangular) sensors on a frontal view of the subject. Lightly shaded sensors indicate posterior placement on the subject. The directions for measurement of acceleration by each accelerometer are indicated by arrows where X refers to the anterior-posterior direction, Y refers to the medial–lateral direction, and Z refers to the superior–inferior (gravity) direction.
C. Activities Monitored
Data from the sensors were acquired while the subjects carried out the same set of 11 ADL activities (referred to as identification tasks) as in previous studies [17]–[21]. The identification tasks were originally based on the functional independence measure (FIM) [24], the most widely used scale for assessing functional independence. The FIM is comprised of six subcategories of ADL activities that include feeding, grooming, dressing, transferring, ambulating, and personal care tasks, and two tasks from each of these categories were selected to develop the identification task set (Table II). In order to test for the likelihood of false detection associated with motor activities not belonging to these 11 identification tasks, an additional set of 10 tasks (referred to as nonidentification tasks) was also monitored (Table II), as described in previous investigations [17]–[21]. They included fine- or gross-motor activities utilizing similar muscle groups and/or limb trajectories as those of the 11 identification tasks. All of the subjects were read the same set of instructions for each task and were not coached in the manner in which they performed the task, thereby allowing for some of the realistic variability found in “real life.”
TABLE II.
List of the Identification and Nonidentification Tasks Studied in This Report. FIM Category Identifies Which of the Specific FIM Categories Are Being Represented by the Identification Task
| Identification Tasks | FIM Category | non-Identification Tasks |
|---|---|---|
| Food-Cutting Food-Lifting |
Feeding | Typing Box: Waist-to-Head |
| Tooth-Brushing Hair-Combing |
Grooming | Open/Close Drawer Phone Call |
| Shirt-Buttoning Pant-Lifting |
Dressing (upper/lower body) | Flipping Pages Box: Floor-to-Waist |
| Sit-to-Stand Supine-to-Sit Sitting |
Transfers | Organizing Small Objects Writing |
| Walking | Locomotion | Folding Clothes Standing |
| Bowel Movement | Toileting |
The identification tasks were repeated twice by the subject in order to provide training and test data sets for the algorithms that were designed for the subsequent data analysis. Identification tasks that involved repetitive activity (e.g., brushing teeth, combing hair, and cutting food) were performed continuously by the subject for 1 min. All the other identification tasks were performed as a set of 15 repetitions. These numbers were specified on the basis of a previous study demonstrating their sufficiency for training the neural network algorithms among healthy control subjects [17]. Rest periods were allowed on an “as-needed” basis between tasks to minimize fatigue.
D. Data Processing and Analysis
Data processing and classification of tasks were accomplished in four parts consisting of feature extraction algorithms, a multilayer feed forward neural network, an adaptive neuro-fuzzy inference system, and an optimization procedure to minimize number of sensors. This model was based on a previously-reported investigation among a nondisabled population [17]. The process is schematically presented in Fig. 2.
Fig. 2.

Schematic diagram showing each stage of the data processing system for activity classification, based on earlier work [17]. Raw sEMG and ACC signals provide the input into the system, which culminates in the output classification of 11 identification tasks. Feature extraction parameters describe various characteristics of the input signals related to muscle activity and movement. The features serve as inputs to a neural network, which is trained to identify the identification tasks. The output is directed to an adaptive neuro-fuzzy inference system which identifies whether the outputs of the neural networks resembled the orthogonal pattern expected of an identification task, or the nonorthogonal pattern of a nonidentification task.
Feature Extraction
Surface EMG features were computed using 4 s epochs, which was the time necessary to complete the longest identification task (supine-to-sit). The features included: 1) the root mean square (rms) value of the raw sEMG signal to represent overall muscle activity, 2) the amplitude range of the auto-covariance function of the sEMG envelope to represent the modulation of muscle activity, 3) the dominant frequency component of the sEMG envelope to represent the periodicity of muscle activity, and 4) the co-activation intervals between muscle pairs to represent muscle co-contraction. The raw sEMG signals were initially filtered with a fifth-order high-pass Butterworth filter with zero phase lag (cutoff frequency 45 Hz) to attenuate artifacts, followed by calculation of the RMS energy. The envelope of the sEMG signal was then obtained using a 12 Hz low-pass filter (FIR implemented using a 201-coefficient Hamming window) and down sampled by a factor of 10. The auto-covariance of the sEMG envelope was computed for lags between −2s and +2 s and the amplitude range of this function was extracted for each channel. The dominant frequency was computed using the squared magnitude of the FFT of the envelope between 0 and 10 Hz. The spectrum was binned in intervals of 1 Hz, and the bin with the greatest magnitude was designated the dominant frequency component. Co-activation between pairs of channels was derived for each channel using a statistically-based algorithm of double-threshold detectors that operates on the raw sEMG signal [25]. The feature extraction procedure resulted in a total of 52 numerical values for each sEMG epoch: (eight channels) × (three features) + (28 values representing the percent co-activation for all possible pairs of eight sEMG channels). Features from a total of 40 epochs were extracted for each task.
ACC features were also extracted using 4 s epochs. The data were down sampled by a factor of 10 after applying an antialiasing filter. To measure changes in body orientation relative to the gravity vector, the rms and range of auto-covariance were calculated from data low-pass filtered at 15 Hz. Measures related to body acceleration were computed from the RMS, range of auto-covariance, dominant frequency, and percent co-activation of high-pass filtered data at 1 Hz. This processing resulted in a total of 68 numerical values for each ACC epoch: (eight channels) × (two features from low-pass ACC + three features from high-pass ACC) + (28 values representing the percent co-activation for all possible pairs of eight ACC channels).
Neural Network
The next step of the analysis procedure was implemented by analyzing the data using a multilayer feed forward artificial neural network (ANN) to identify the relationship between feature sets and identification tasks, and to identify the ANN topology with the highest performance metrics for classifying the identification tasks. Four different ANN topologies were evaluated for this purpose: two ANN topologies with a single hidden layer containing 22 and 33 neurons, respectively; and two neural networks with two hidden layers containing either 44 and 33 or 44 and 22 neurons, respectively. A larger number of neurons were not considered to avoid the possible requirement for a larger training data set than provided in this study. The selection of these topologies was based on comparisons of different ANN configurations carried out in previous studies among control subjects [17]–[19]. Each of the 11 identification tasks was assigned to one output neuron. This is an important characteristic of the design resulting in orthogonal outputs that decrease the likelihood of misclassification errors. A sigmoid (anti-symmetric hyperbolic tangent) transfer function was used for the neurons of the hidden layers, and a linear transfer function for the neurons of the output layer [26].
Training of the neural networks was accomplished by the use of a scaled conjugate gradient algorithm [27] with weights and biases of neurons selected using a technique proposed by Nguyen and Widrow [28] for nonlinear transfer functions. For neurons with linear transfer function, the weights and biases were initialized by random values selected between −1 and 1 [26]. The neural network was trained on a subject-by-subject basis utilizing 440 data sets (40 epochs × 11 identification tasks). The features were normalized for each input neuron so that the mean was 0 and the standard deviation was 1. The target outputs of the neural network were determined by setting one neuron of the output layer to 1 and all the other neurons to 0, so that each identification task was associated with one active output neuron. The training algorithm was run for different numbers of iterations (100, 250, 350, 500, and 1000) using an “early stopping” procedure to achieve the greatest sensitivity for a given value of specificity or misclassification [29].
The detection of the identification task by the ANN was based on the L2-norm distance between the outputs of the neural network and each of the targets where the L2-norm distance for the jth target is defined as . The minimum of {d1, d2 …, d11} was selected and compared to different threshold values that varied between 0.1 to 5, by steps of 0.02 to identify all possible classification decisions and to optimize performance. If this minimal distance was smaller than the threshold value, the corresponding identification task was accepted as the final output of the classifier algorithm module. If the minimal distance was greater than the threshold value, the dataset was deemed as belonging to a nonidentification task. Sensitivity, specificity and misclassification were then calculated with each of the possible thresholds based on all the data sets. The ANN topology that resulted in the highest levels of identification task sensitivity and specificity was selected for the next step of processing using ANFIS [30].
Neuro-Fuzzy Inference System
The use of the ANFIS was implemented to determine whether the outputs of the selected ANN resembled the orthogonal pattern expected of an identification task, or the nonorthogonal pattern of a nonidentification task (Fig. 2). The usefulness of this procedure was demonstrated in previous investigations among healthy and stroke populations [17]–[21] and was therefore adopted in this investigation. The ANFIS was trained using examples of orthogonal and nonorthogonal patterns associated with the identification and nonidentification tasks, respectively. The training set consisted of 20 epochs for each of the identification tasks and 20 epochs for a subset of the nonidentification tasks. An additional 20 epochs of data from the identification and nonidentification tasks was used for the test set. A subtractive clustering method [30] was utilized to build the fuzzy inference system and determine the number of rules and antecedent membership functions [31], [32]. A least-square estimation approach was used to determine the rule’s consequent equations, resulting in a Takagi-Sugeno-Kang inference system [31], [32] with outputs approximating 0 for the identification tasks and 1 for the nonidentification tasks. The output of the ANFIS (a value between 0 and 1) was compared to a threshold value, such that outputs below the threshold would consider the ANN output as orthogonal, in which case the corresponding identification task was accepted. Outputs exceeding the threshold would consider the neural network output as nonorthogonal and the identification task would be rejected in favor of the output representing the nonidentification task category. A threshold value of 0.65 was used for the ANFIS in this study based on a preliminary investigation [17] in which this value resulted in the greatest sensitivity for the identification tasks when misclassification of the nonidentification tasks was arbitrarily set to less than 10%. A more detailed description of the ANFIS can be found in related studies [19], [21].
Performance Measurement and Optimization
The final stage of the analyses to quantify classification performance was implemented by first calculating sensitivity and specificity for the identification tasks, and misclassification for the nonidentification tasks. Sensitivity measures the percentage of correct classifications of identification tasks, whereas specificity measures the percentage of mistaken classifications of one identification task for another. Misclassification measures the percentage of nonidentification tasks mistaken for identification tasks. The receiver operating characteristics (ROC) curves of the ANN and ANFIS were evaluated by plotting sensitivity versus specificity and sensitivity versus misclassification for all possible thresholds [29]. The equations for computing these outcomes are listed below
An optimization procedure was then implemented to obtain maximum sensitivity and specificity for a given value of misclassification for successively smaller combinations of ACC and sEMG sensor configurations. Because the ACC and sEMG sensors were placed adjacent to one another in most locations on the body to explore the possible benefits of combining such measures in a single hybrid sensor, a goal of the optimization procedure was to identify the fewest number of such combined locations needed to provide “acceptable” classification results. Acceptability was defined as achieving at least 90% sensitivity and specificity, respectively, for misclassifications errors no greater than 10%. This specification was based on our intent to achieve results for stroke patients that were comparable to the previously reported results among healthy subjects without stroke.
The first step of the optimization was to compare the classification results for the full complement of 16 channels of data, the full complement of ACC data (eight channels), and the full complement of sEMG data (eight channels), respectively. These results were used to determine whether the ACC or sEMG data provided higher levels of classification for these tasks. The classification algorithms were then reanalyzed using all possible combinations of successively fewer numbers of sensor data as inputs to the neural networks. Details of this process are provided in the Results section of the paper.
III. Results
A qualitative analysis of the raw data demonstrated that the sEMG and ACC signals patterns were visibly different for the different identification tasks. Fig. 3(a) provides examples of signal patterns from three activities monitored in the same subject. The first two plots were derived from data recorded while the subject buttoned his shirt and combed his hair, respectively. As might be expected, the sEMG and ACC patterns for these tasks are visibly different because these two identification tasks require very different uses of the upper extremities. However, the third task in the figure, bringing a telephone receiver to the ear, is a nonidentification task with a similar use of the upper extremities as the hair combing task, making the task of automated recognition likely more difficult than the previous examples. This likelihood is supported by examining channels 1 and 3 for both tasks, which appear to have similar signal patterns. However, there are visible differences in the amplitude modulation of the sEMG and ACC signals in channels 2 and 4 for these tasks, highlighting the fact that similar tasks may have dissimilar signal features in some channels which the classification algorithms can exploit. Classification algorithms must not be too sensitive to differences in signal patterns; otherwise it might mistakenly identify the normal variability of performing the same task as different tasks. Fig. 3(b) provides an example of signal patterns from a second subject performing the same tasks as in Fig. 3(a). It illustrates that tasks retain many of the same signal pattern characteristics even when different individuals are performing these tasks.
Fig. 3.

(a) Example of raw sEMG and ACC data from one of the subjects tested in this study. Twenty seconds of data are displayed for a subset of sensors placed on the upper extremity (sEMG sensors located on the biceps brachii and wrist flexor muscles, respectively; ACC sensors located immediately adjacent to the sEMG sensors). Data were recorded for two identification tasks (shirt buttoning and hair combing) and one nonidentification task (bringing a telephone receiver to the ear). (b) A similar data set from a second subject performing the same tasks as in (a).
The results of comparing classification percentages for different neural network topologies are summarized in Fig. 4(a) and (b). This stage of the analysis was performed without the fuzzy-inference postprocessing in order to establish the relationship between ANN topology and operating characteristic performance. Training algorithms were stopped after 250 iterations because performance did not improve beyond this number. The figure demonstrates that differences in operating characteristics were primarily related to the number of layers in the network, with maximum sensitivity for given values of specificity and misclassification obtained for the three-layer neural network with 44 and 22 neurons in the hidden layers. This was the preferred topology used for the remainder of the analysis which incorporated the fuzzy-inference postprocessing.
Fig. 4.

ROC curves for neural networks with different topologies. Results are for algorithms trained using 250 iterations. The left panel is a plot of sensitivity versus misclassification; the right panel is a plot of sensitivity versus specificity. Dashed lines with and without squares represent two-layer neural networks with 22 and 33 neurons in the hidden layer, respectively. Continuous line plots with and without circles represent three-layer neural networks with either 44 and 33 neurons in the first and second hidden layers or 44 and 22 neurons in the first and second layer, respectively.
The ROC curves using the preferred neural network topology are compared for data from the full set of sensors (sEMG and ACC) versus data from either the sEMG sensors or the ACC sensors (Fig. 5). The results indicate that relatively high sensitivity was achieved with the 16-channel sEMG/ACC data set (94.9% ± 1.4%) and the 8-channel ACC data set (93.2% ± 1.7%), but not for the 8-channel sEMG data set (68.7%±3.4%). Maximum specificity was relatively high for all three data sets and resulted in mean values of 99.1% ± 0.5% for 16-channel sEMG/ACC data, 96.8% ± 0.4% for 8-channel ACC data, and 95.1% ± 1.6% for 8-channel sEMG data. The inability of the 8-channel sEMG data set to achieve relatively high sensitivity percentages for misclassification limited to 10% suggests that a solely sEMG-based sensor system would not be sufficient for effectively monitoring these tasks in this population.
Fig. 5.
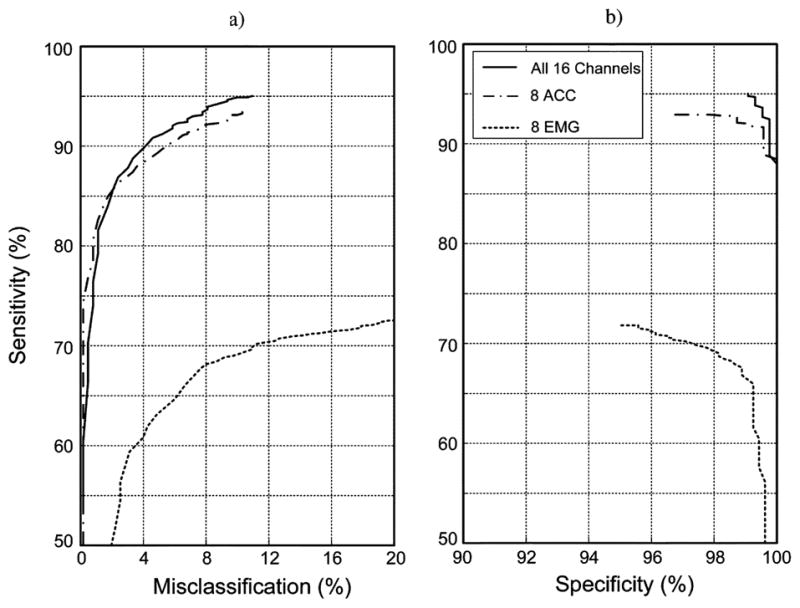
ROC curves for classification of the identification and nonidentification tasks for data from all 16 sensors (eight sEMG plus eight ACC; solid line), from just the eight ACC sensors (dash/dot line) and from just the eight sEMG sensors (dotted line). Results were derived from all of the subject data using an ANN with a three-layer neural network with 44 and 22 neurons in the hidden layers and an ANFIS.
Optimization of the classification results to obtain a system that would require a minimal number of sensors began by repeating the analysis for all possible combinations of successively fewer numbers of the eight ACC sensors (Fig. 6). This strategy was dictated by the previously described finding that the eight ACC sensor configuration resulted in the best ROC curve. As might be expected, and as was indicated in the figure, successively fewer numbers of ACC sensors was associated with a decrease in the sensitivity obtained for a given value of specificity or misclassification. Examination of the sensitivity versus misclassification curves [Fig. 6(a)] reveals a precipitous drop in performance when the numbers of sensors were reduced to less than 4. Sensitivity versus specificity performance [Fig. 6(b)] also supported this finding. The 4-channel ACC system associated with peak performance was attained for sensor locations on both upper arms, the forearm of the preferred side, and the thigh of the nonpreferred side, and resulted in a maximum mean sensitivity of 86.5% and specificity of 99.7% for misclassifications limited to 10%
Fig. 6.

ROC curves for data from different numbers of ACC sensors used in the analysis. Each ROC curve represents the best performance for a specified number of sensors when all possible combinations of that number of sensors were analyzed using the ANN algorithm. The curves demonstrate that classification performance, in general, is reduced by decreasing the number of ACC sensor. Secondly, these results demonstrate that reducing the number of sensors to fewer than 4 results in a dramatic reduction in sensitivity, particularly when the goal of limiting misclassifications to 10% is enforced.
Further analysis was conducted to determine whether the ROC curves for this 4-ACC data set could be improved by adding EMG data from the adjacent sensors. The result (Fig. 7) demonstrated that sensitivity percentages were significantly improved, with maximum sensitivity and specificity values averaging 95.0% and 99.7%, respectively. Sensitivity improved for 10 of the 11 identification tasks as a result of adding this data set (Table III).
Fig. 7.

Comparison of ROC curves for data from four hybrid sensors (dashed line) versus data from four ACC sensors (solid line). Results are for the set of sensors with data that produced the highest % sensitivity and % specificity. The findings demonstrate that classification of these tasks can be improved with a hybrid sensor that combines sEMG and ACC detection.
TABLE III.
Individual Task Performance for the Best 4-ACC and 4-Hybrid Sensor Combination Is Compared. Sensitivity and Specificity Results Are for Misclassification Rates ≤ 10%. Analysis Included Postprocessing Using an Adaptive Neuro-Fuzzy Inference System
| Task | 4 - ACC | 4 - Hybrid | ||
|---|---|---|---|---|
| Sensitivity (%) | Specificity (%) | Sensitivity (%) | Specificity (%) | |
| Food-Cutting | 91.6 | 100.0 | 96.8 | 100.0 |
| Food-Lifting | 97.3 | 100.0 | 98.8 | 100.0 |
| Tooth-Brushing | 70.3 | 99.2 | 89.9 | 99.1 |
| Hair-Combing | 85.3 | 99.0 | 94.6 | 99.0 |
| Shirt-Buttoning | 85.0 | 99.3 | 95.4 | 99.3 |
| Pant-Lifting | 84.8 | 99.6 | 94.7 | 99.5 |
| Sit-to-Stand | 85.3 | 100.0 | 95.8 | 100.0 |
| Sitting | 69.0 | 100.0 | 92.5 | 100.0 |
| Bowel Movement | 85.5 | 100.0 | 96.5 | 100.0 |
| Supine-to-Sit | 93.3 | 5100.0 | 97.0 | 100.0 |
| Walking | 92.8 | 99.1 | 92.5 | 100.0 |
| Mean (%) | 85.5 | 99.7 | 95.0 | 99.7 |
IV. Discussion
This study provides evidence that automated monitoring of a variety of activities of daily living can be accomplished in patients with stroke using a wearable sensor system in combination with a neural network and fuzzy logic processing technique. Although other reports in the literature have achieved similar levels of classification accuracy for wearable activity monitors, the identification tasks in those reports were nonspecific and were restricted to investigations on normal healthy subjects [8]–[10]. In the present study, the identification tasks were more specific and related to FIM activities that are useful for evaluation the functional mobility of patients with motor disorders. But, more importantly, this study suggests that movement assessment technology can be used to monitor the abnormal ADLs of a patient population, which in our case consisted of hemi paretic stroke patients having mild to moderate dysfunction. By using hybrid ACC and sEMG sensor pairs only four pairs were required to provide the highest sensitivity and specificity for the identification tasks. One pair was located on each arm, one pair on the forearm, and one pair on the thigh.
The high levels of sensitivity and specificity (i.e., better than 90% on average) that were achieved in this study were accomplished while limiting misclassifications of nonidentification tasks to an average of less than 10%. The inclusion of nonidentification tasks into the study design was also unique compared to some other activity monitoring studies [5], [7]–[9]. The inclusion of nonidentification tasks was done to develop a more “real-world” monitoring condition where tasks containing similar limb trajectories and movements as the identification task set could be analyzed to see whether they confound the classification algorithms. In fact, the neural networks were designed so that the output represented the identification tasks as orthogonal in order to minimize such misclassifications. This approach decreased the likelihood that the output of the neural network would select a target associated with an identification task when processing a feature set derived from a nonidentification task. The neural network also provided a reduction of the dimensionality of the classification space that was necessary for utilizing the adaptive neuro-fuzzy inference system. Fuzzy postprocessing proved beneficial because when it was implemented, the neural network provided sensitivity and specificity values above 90% for all 11 identification tasks. Without the ANFIS, only 8 of the 11 identification tasks achieved this 90% level of performance, for misclassifications averaging below 10%. This task-specific advantage of using the ANFIS was consistent with findings from previous studies [17]–[21].
The inclusion of both sEMG and ACC sensors for monitoring functional activities has rarely been reported in the literature [18]–[21]. The results of this study demonstrate that the inclusion of sEMG sensors to an ACC-based monitoring system was useful in attaining the highest level of classification accuracy with the least number of sensors for patients with stroke. This advantage was not seen in previous work among healthy control subjects where a 4 sEMG sensor system was sufficient in achieving sensitivity and specificity results in the 90% range for misclassifications less than 10%, providing that a neuro-fuzzy inference system was included as a part of the analysis [18]–[20]. The scarcity of EMG-based approaches for activity monitoring may be due to the generally held belief that sEMG techniques are not amenable to home use. This perception has likely been perpetuated because of previous sensor technologies that did not incorporate active electronics at the recording site, thereby requiring time-consuming skin preparation and immobilization of sensor leads to reduce baseline noise and motion artifact, respectively. Recent advances in sEMG sensor design and signal conditioning hardware have greatly reduced the need for such preparations. Improvements in sensor miniaturization and digital circuitry also make it feasible to consider combining ACC and sEMG signal detection into the same hybrid sensor circuit board and encapsulation.
In our attempt to reduce the overall number of sensors, we considered the ACC sensors as the “primary” sensors for classification because the predominant number of wearable monitoring systems in the literature rely on ACC sensors [8]–[10]. Furthermore, as reported in preliminary work on control subjects, ACC data provided better classification performance overall than sEMG data when classifying these tasks [17], [18]. However, there were several individual identification tasks that were classified with greater sensitivity and specificity when sEMG data were combined with ACC data. It may be that the ability of sEMG data to characterize such motor control features as muscle coordination, loading, and co-contraction was particularly useful in identifying these tasks.
There are several basic limitations associated with the methodology of this study that will need further development in the future to provide a wearable sensor system for use in the home under “real world” conditions. The algorithms were trained separately for each individual and required multiple repetitions of the task to obtain sufficient data for training and testing purposes. The need for such individualized training may be unrealistic for use on people with moderate to severe motor impairments who might not have the stamina or time for this requirement. A generic approach will need to be developed that utilizes algorithms that are applicable to a population of targeted users without the need for extensive individualized training. This study was also limited to monitoring “scripted” tasks in a laboratory environment. Some of these tasks were repetitive, such as walking or brushing teeth, whereas others were nonrepetitive, such as bringing a telephone receiver to the ear. Although all tasks were repeated for the purposes of training, it is not clear what the impact is of identifying repetitive versus nonrepetitive activities in a larger task set encountered in real life. Monitoring was also limited to tasks performed in isolation during well-delineated time segments. It is not known how well the algorithms developed in this fashion would perform for data collected outside the laboratory during unscripted free-form activities. These conditions will need to be explored and dealt with before this system can be implemented effectively for clinical use.
Acknowledgments
This work was supported in part by a National Institute on Disability and Rehabilitation Research (NIDRR) Field-Initiated Project Award 133G020108, in part by the National Institutes of Health/Small Business Innovation Research (NIH/SBIR) under Grant R44 AR47272, and in part by the National Institutes of Health/Bioengineering Research Partnerships (NIH/BRP) under Grant R01 EB007163 from National Institute of Biomedical Imaging and Bioengineering (NIBIB).
The authors would like to thank Dr. M. Kaplan and Dr. P. Novak for their clinical assistance and suggestions.
Biographies
 Serge H. Roy received the B.S. degree from New York University, New York, in 1975, and the M.S. and Sc.D. degrees from Boston University, Boston, MA, 1981 and 1992, respectively.
He is currently a Research Professor at Boston University NeuroMuscular Research Center, Boston, MA. His primary research interests are directed at developing and applying EMG systems for assessing neuromuscular disorders.
Dr. Roy is the recipient of the Elizabeth C. Adams Award (N.Y.U.) and two group achievement awards from NASA. He was elected as a Fellow to the American Institute for Medical and Biological Engineering (AIMBE) and to the International Society of Electrophysiology and Kinesiology (ISEK).
 M. Samuel Cheng received the B.S. degree in physical therapy from National Taiwan University, Taiwan, in 1993, the M.S. degree in physical therapy from MGH Institute of Health Professions, Boston, MA, 1999, and the Sc.D. degree in applied kinesiology from Boston University, Boston, MA, in 2005.
He is currently an Associate Professor in physical therapy at Nova Southeastern University, Fort Lauderdale, FL. His research interests include clinical use of surface EMG, biomechanics and motor control.
Dr. Cheng has been a member of the American Physical therapy Association (APTA) since 1997.
Shey-Sheen Chang (S’07–M’09) received the B.S. degree in electrical and computer engineering from Chang-Gung University, Taiwan, in 1998, and the M.S. and Ph.D. degrees in electrical engineering from Boston University, Boston, MA, in 2003 and 2009, respectively.
From 2002 to2009, he was a Research Assistant with Complex Biosignal Processing Laboratory and NeuroMuscular Research Center at Boston University. He is currently with Delsys, Inc., Boston, MA. His research interests include applied artificial intelligence, pattern recognition, and biosignal separation.
John Moore photograph and biography not available at the time of publication.
Gianluca De Luca photograph and biography not available at the time of publication.
 S. Hamid Nawab (M’95–SM’01) received the S.B., S.M., and Ph.D. degrees in electrical engineering from Massachusetts Institute of Technology, Cambridge, in 1977, 1979, and 1982, respectively.
He is currently Professor of Electrical and Computer Engineering, Professor of Biomedical Engineering, and Research Professor in the NeuroMuscular Research Center at Boston University, Boston, MA.
Dr. Nawab is a fellow of the American Institute of Medical and Biological Engineering (AIMBE) and a member of Tau Beta Pi. His research interests include complex biosignal processing for the imaging of muscle and movement control, computational auditory scene analysis, and intelligent search algorithms for signal processing.
 Carlo J. De Luca (LF’09) has held academic appointments at Queen’s University (Canada), Massachusetts Institute of Technology, Harvard Medical School, and Boston University. At Boston University he served as Dean of the College of Engineering. He has served on review boards for national and international government agencies, and on the National Advisory Council of NIBIB. He is the founding CEO of Delsys, which received the Tibbetts Award in 2006. He has co-authored a book, 102 peer-reviewed articles; 11 peer-reviewed conference papers, 20 book chapters; 255 abstracts; holds 14 patents, and has given over 130 invited presentations. He has received several awards and prizes.
Contributor Information
Serge H. Roy, Email: sroy@bu.edu, Neuro-Muscular Research Center, Boston University, Boston, MA 02215 USA
M. Samuel Cheng, Physical Therapy Program, Nova Southeastern University, Fort Lauderdale, FL 33328 USA.
Shey-Sheen Chang, DelSys Inc., Boston, MA 02215 USA.
John Moore, Neuro-Muscular Research Center, Boston University, Boston, MA 02215 USA.
Gianluca De Luca, DelSys Inc., Boston, MA 02215 USA.
S. Hamid Nawab, Neuro-Muscular Research Center, Boston University, Boston, MA 02215 USA. Department of Biomedical Engineering and the Department of Electrical and Computer Engineering, Boston University, Boston, MA 02215 USA.
Carlo J. De Luca, Neuro-Muscular Research Center, Boston University, Boston, MA 02215 USA. Department of Biomedical Engineering and the Department of Electrical and Computer Engineering, Boston University, Boston, MA 02215 USA. DelSys Inc., Boston, MA 02215 USA.
References
- 1.Heart Disease and Stroke Statistics—2005 Update. Dallas, Tx: Amer. Heart Assoc; 2005. [Google Scholar]
- 2.CDC. Prevalence of disabilities and associated health conditions among adults—United states. MMWR. 2001;50:120–125. [PubMed] [Google Scholar]
- 3.Lieberman JR, Dorey F, Shekelle P. Difference between patients’ and physicians’ evaluations of outcome after total hip arthroplasty. J Bone Joint Surg. 1996;78:835–838. doi: 10.2106/00004623-199606000-00005. [DOI] [PubMed] [Google Scholar]
- 4.Reuben DB. What’s wrong with ADLs? J Am Geriatr Soc. 1995;43:936–937. doi: 10.1111/j.1532-5415.1995.tb05540.x. [DOI] [PubMed] [Google Scholar]
- 5.Kiani K, Snijders CJ, Gelsema ES. Computerized analysis of daily life motor activity for ambulatory monitoring. Technol Health Care. 1997;5:307–318. [PubMed] [Google Scholar]
- 6.Veltink PH, Bussmann HB, de Vries W, Martens WJ, van Lummel RC. Detection of static and dynamic activities using uniaxial accelerometers. IEEE Trans Rehabil Eng. 1996 Dec;4(4):375–385. doi: 10.1109/86.547939. [DOI] [PubMed] [Google Scholar]
- 7.Busser HJ, Ott J, van Lummel RC, Uiterwaal M, Blank R. Ambulatory monitoring of children’s activity. Med Eng Phys. 1997;19:440–445. doi: 10.1016/s1350-4533(97)00007-6. [DOI] [PubMed] [Google Scholar]
- 8.Bussmann HB, Reuvekamp PJ, Veltink PH, Martens WH, Stam HJ. Validity and reliability of measurements obtained with an activity monitor in people with and without a transtibial amputation. Phys Ther. 1998;78:989–998. doi: 10.1093/ptj/78.9.989. [DOI] [PubMed] [Google Scholar]
- 9.Kiani K, Snijders CJ, Gelsema ES. Recognition of daily life motor activity classes using an artificial neural network. Arch Phys Med Rehabil. 1998;79:147–154. doi: 10.1016/s0003-9993(98)90291-x. [DOI] [PubMed] [Google Scholar]
- 10.Mathie MJ, Coster ACF, Lovell NH, Celler BG. Accelerometry: Providing an integrated, practical method for long-term, ambulatory monitoring of human movement. Physiol Meas. 2004;25:R1–R20. doi: 10.1088/0967-3334/25/2/r01. [DOI] [PubMed] [Google Scholar]
- 11.Thielgen T, Foerster F, Fuchs G, Hornig A, Fahrenberg J. Tremor in Parkinson’s disease: 24-hr monitoring with calibrated accelerometry. Electromyogr Clin Neurophysiol. 2004;44:137–146. [PubMed] [Google Scholar]
- 12.Keijsers NL, Horstink MW, van Hilten JJ, Hoff JI, Gielen CC. Detection and assessment of the severity of levodopa-induced dyskinesia in patients with Parkinson’s disease by neural networks. Mov Disord. 2000;15:1104–1111. doi: 10.1002/1531-8257(200011)15:6<1104::aid-mds1007>3.0.co;2-e. [DOI] [PubMed] [Google Scholar]
- 13.Basmajian JV, De Luca CJ. Muscles Alive: The Functions Revealed by Electromyography. 5. Baltimore, MD: Williams Wilkins; 1985. [Google Scholar]
- 14.De Luca CJ. The use of surface electromyography in biomechanics. J Appl Biomech. 1997;13:135–163. [Google Scholar]
- 15.Nieuwboer A, Dom R, De Weerdt W, Desloovere K, Janssens L, Stijn V. Electromyographic profiles of gait prior to onset of freezing episodes in patients with Parkinson’s disease. Brain. 2004;127:1650–1660. doi: 10.1093/brain/awh189. [DOI] [PubMed] [Google Scholar]
- 16.Boose A, Spieker S, Jentgens C, Dichgans J. Wrist tremor: Investigation of agonist-antagonist interaction by means of long-term EMG recordings and cross-spectral analysis. Electroencephalogr Clin Neurophys. 1996;101:355–363. doi: 10.1016/0924-980x(96)95533-2. [DOI] [PubMed] [Google Scholar]
- 17.De Luca CJ, Bonato P, Roy SH, Moore J, Vadnais A. EMG-based approach to identifying functional motor activities. Proc. XIIIth Congr. ISEK; Vienna, Austria. Jun. 2002. [Google Scholar]
- 18.Sherrill DM, Bonato P, De Luca CJ. A neural network approach to monitor functional motor activities. presented at the 2nd Joint EMBS/BMES Conf; Houston, TX. 2002. [Google Scholar]
- 19.Sherrill DM. MS thesis. Boston, MA: 2003. Automatic monitoring of functional motor activities. [Google Scholar]
- 20.Cheng MS, Roy SH. Monitoring functional motor activities in patients with stroke using surface electromyography. presented at the XIIIth Int. Conf. Mechan. Med. Biol; Tainan, Taiwan. Nov. 2003. [Google Scholar]
- 21.Cheng MS. PhD dissertation. Boston, MA: 2005. Monitoring functional motor activities in patients with stroke. [Google Scholar]
- 22.Roy SH, Cheng MS, De Luca CJ. A wearable functional activity monitor for stroke patients. presented at the XVth Congr. ISEK; Boston, MA. Jun. 2004. [Google Scholar]
- 23.Fugl-Meyer AR, Jaasko L, Leyman I, Olsson S, Steglind S. The post-stroke hemiplegic patient. I. A method for evaluation of physical performance. Scand J Rehabil Med. 1975;7:13–31. [PubMed] [Google Scholar]
- 24.Keith RA, Granger CV, Hamilton BB, Sherwin FS. The functional independence measure: A new tool for rehabilitation. Adv Clin Rehabil. 1987;1:6–18. [PubMed] [Google Scholar]
- 25.Bonato P, D’Alessio T, Knaflitz M. A statistical method for the measurement of muscle activation intervals from surface myoelectric signal during gait. IEEE Trans Biomed Eng. 1998;45:287–299. doi: 10.1109/10.661154. [DOI] [PubMed] [Google Scholar]
- 26.Mao J, Jain AK. Artificial neural networks for feature extraction and multivariate data projection. IEEE Trans Neural Networks. 1995;6(2):296–317. doi: 10.1109/72.363467. [DOI] [PubMed] [Google Scholar]
- 27.Ripley BD. Pattern Recognition and Neural Networks. Cambridge, U.K: Cambridge Univ. Press; 1996. [Google Scholar]
- 28.Nguyen D, Widrow B. Improving the learning speed of 2-layer neural networks by choosing initial values of the adaptive weights. Proc Int Joint Conf Neural Networks. 1990;3:21–26. [Google Scholar]
- 29.Zou KH. Statistical validation based on parametric receiver operating characteristic analysis of continuous classification data. Acad Radiol. 2003;10:1359–1368. doi: 10.1016/S1076-6332(03)00538-5. [DOI] [PMC free article] [PubMed] [Google Scholar]
- 30.Chiu S. Cluster estimation method with extension to fuzzy model identification. Proc. 3rd IEEE Conf. Fuzzy Syst.; Orlando, FL. Jun. 26–29, 1994; pp. 1240–1245. [Google Scholar]
- 31.Jang JSR. ANFIS: Adaptive-network-based fuzzy inference system. IEEE Trans Syst, Man Cybern. 1993 May/Jun;23(3):665–685. [Google Scholar]
- 32.Janikow CZ. Fuzzy decision trees: Issues and methods. IEEE Trans Syst, Man, Cybern. 1998 Feb;28(1):1–14. doi: 10.1109/3477.658573. [DOI] [PubMed] [Google Scholar]