

Abstract
Two classes of thalamic relays project to either middle layers or upper layers, including layer 1, of the neocortex, and are referred to as ‘specific’ and ‘non-specific’ relays, respectively. The electrophysiological properties of the non-specific relays have not been investigated, largely due to the paucity of in vitro slice preparations containing intact non-specific pathways. In this study, we used Flavoprotein Autofluorescence (FA) imaging to demonstrate intact thalamocortical connectivity of non-specific relays in slice preparations of the somatosensory and auditory systems. These preparations will enable the elucidation of electrophysiological properties of non-specific pathways.
Keywords: thalamus, cortex, autofluorescence imaging, auditory, somatosensory
Introduction
Thalamocortical projections are subdivided into ‘specific’ and ‘non-specific’ pathways, primarily targeting either middle or upper layers of cortex, respectively [1–3]. Specific pathways project topographically [4,5] and include thalamic relays that bring primary sensory information to somatosensory, visual and auditory cortices. Non-specific projections, as their name implies, are more diffuse and less topographic. Although the specific pathways have been extensively investigated, the non-specific projections have received less attention, due in part to the lack of adequate experimental preparations.
Connectivity between primary thalamic and cortical regions has been demonstrated in two commonly utilized thalamocortical slices: the somatosensory slice [6]and the primary auditory slice [7]. In the established somatosensory slice, thalamocortical connections from the ventroposterior nucleus of the thalamus (VP) and the posterior medial nucleus of the thalamus (POm) to somatosensory cortex are well characterized [6,8]. In previously described auditory slice preparations, connections from both the MGBv and dorsal medial geniculate body (MGBd) of the thalamus to auditory cortex have been elucidated [7,8].
A recent modification of the somatosensory slice, which contains intact projections from the central lateral nucleus of the thalamus (CL) to S1, a non-specific projection, along with connections from VP to S1, has enabled the investigation of specific/non-specific interactions in the somatosensory system [3]. Interestingly, the ventromedial nucleus of the thalamus (VM) also projects to upper layers of S1 and contain many non-specific relay cells, but it is unknown whether it is also connected to cortex in this slice. A related question in the auditory thalamocortical slice preparation is whether the medial division of the MGB (MGBm), a nucleus containing a high percentage of non-specific relay cells, is connected to cortex. Such connectivity would enable the simultaneous exploration of the effects of specific and non-specific thalamic relays on cortical activity in two sensory modalities and across two non-specific relays in a single modality.
Here, using FA imaging, a technique recently adapted for use in vitro [9,10], we show that VM is connected to S1 in the modified somatosensory slice and that MGBm is connected to A1 in the standard auditory thalamocortical slice, expanding the experimental repertoire in these slice preparations.
Methods
Slice Preparation
All animal procedures followed the animal care guidelines of the University of Chicago. After deeply anesthetizing mice (mus musculus, BALB/C, postnatal day 13–23) with 1 mg/g ketamine (Vetaket; Phoenix Scientific, St. Joseph, MO) and 10 mg/g xylazine (AnaSed; Lloyd Laboratories, Shenandoah, IA) and verifying that the hindlimb reflex was absent, they were perfused with cold, oxygenated sucrose-based slicing solution, composed of, in mM: 234 sucrose, 11 glucose, 26 NaHCO3, 2.5 KCl, 1.25 NaH2PO4*H2O, 10 MgCl2*6H2O, 0.5 CaCl2*2H2O. After decapitation and brain removal, tissue slices (500 μm) were cut using previously described techniques in a plane that maintained thalamocortical and corticothalamic connectivity in the somatosensory and auditory systems (for further details see [3,7,8,10,11]). Slices were stored in room temperature, oxygenated low calcium artificial cerebrospinal fluid (ACSF), composed of (in mM): 26 NaHCO3, 2.5 KCl, 10 glucose, 126 NaCl, 1.25 NaH2PO4*H2O, 3 MgCl2*6H2O, and 1 CaCl2*2H2O. Experiments were performed on a Zeiss Axioskop FS 2 Plus (Carl Zeiss, Jena, Germany) in standard ACSF, composed of (in mM): 26 NaHCO3, 2.5 KCl, 10 glucose, 126 NaCl, 1.25 NaH2PO4*H2O, 2 MgCl2*6H2O, and 2 CaCl2*2H2O.
Stimulation Methods
Thalamic activation was elicited from the slice using both electrical stimulation and laser scanning photostimulation (LSPS) [10,12–14]. While electrical stimulation yields robust FA images, LSPS only induces action potentials in cell bodies, and not axons, ensuring that remote activation results only from neurons at the stimulation site. LSPS was achieved using a computer-controlled UV Laser (355 nm; 5 laser pulses; 5 ms width at 20 Hz) to focally release ‘caged’ glutamate in the thalamus. Laser power at the slice was ~60 mW. For further details of the LSPS configuration, see [10–14].
For electrical stimulation experiments, standard concentric bipolar stimulating electrodes were used to deliver trains of stimuli (pulse width 10 ms, 20 Hz, 0.5–1 s duration).
Imaging
Metabolic activity was measured by capturing green light (~510–540 nm) generated by mitochondrial flavoproteins, most prominently flavin mononucleotide (FMN) and flavin adenine dinucleotide (FAD), in the presence of blue light (~450–490 nm; see [9,15] for further details) with a high-sensitivity camera (Retiga-SRV, Qimaging). We previously demonstrated that deviation in the signal correlates to the degree of postsynaptic activity (see [10] for more details and a demonstration of some capabilities of FA imaging). Optical recordings were taken during 14 s runs, with stimuli lasting for 1000 ms. Image exposure time ranged from 80ms to 150ms. All images were taken at 2.5x magnification and processed using programs generated in-house made to run on Matlab.
Results
Somatosensory Thalamocortical Slice
We assessed connectivity in the modified somatosensory thalamocortical slice using both electrical stimulation and photostimulation. Results, shown in Figure 1, demonstrate thalamocortical connectivity from VM, CL, POm and VP to cortex. Trains of stimuli were used to activate each of the nuclei, which led to robust stimulus sites in both VP and VM (Fig. 1B,D), but a very weak stimulation site in CL (Fig. 1A). Cortical activation was both focal and subtle, and ΔF/F values rose above .75% in response to the stimulus train. This is the first demonstration that VM, a thalamic nucleus containing many non-specific thalamic relay cells, is connected to cortex in this slice. We saw this connectivity in slices from six animals, out of seven tested. We used electrical stimulation in four animals, and photostimulation in three animals, one of which overlapped with an electrical stimulation experiment.
Figure 1.

Connectivity in the modified somatosensory thalamocortical slice preparation. (A) Raw FA image for anatomical reference in electrical experiments (B–E). (B) Electrical stimulation of CL and resulting cortical activation. (C) Electrical stimulation in VM and resulting cortical activation. (D) Electrical stimulation in VP and cortical activation. (E) POm electrical stimulation and cortical activation. (F) Raw FA image for anatomical reference in photostimulation experiments (G–I). (G) Cortical response to photostimulation of CL. (H) Photostimulation of VM and resultant activity in S1. Arrow indicates stimulation site here and in all other imaging figures. (I) Cortical response to photostimulation in VP. Arrows in the lower right inset of (A and F) are for orientation: D = Dorsal, M = Medial. Color bar at bottom of (I) represents values of ΔF/F corresponding to colors in panels (B–E and G–I). Color bar also applies to all FA colormap images in Fig. 2.
Auditory Thalamocortical Slice
We also assessed connectivity in the auditory thalamocortical slice using both electrical stimulation and photostimulation. Results, shown in Figure 2, demonstrate thalamocortical connectivity from MGBv to cortex, which is the ‘specific’ thalamic nucleus in the auditory system, as well as from MGBm, the ‘non-specific’ thalamic nucleus in the auditory system, to cortex. ΔF/F values reached >4% after both MGBv and MGBm photostimulation (Fig. 2B–C, suggesting a robust slice for both projections. Electrical stimulation trains (see Methods) in another slice from a different animal elicited less robust activation of cortex, though levels reached >2% ΔF/F in maximally activated areas (Fig. 2G–H). Note that the stimulation sites during electrical stimulation remained confined to MGBm and MGBv. MGBm stimulation elicited cortical activation in four out of four auditory thalamocortical slices. We used electrical stimulation in slices from four animals, as well as photostimulation in two of these slices.
Figure 2.
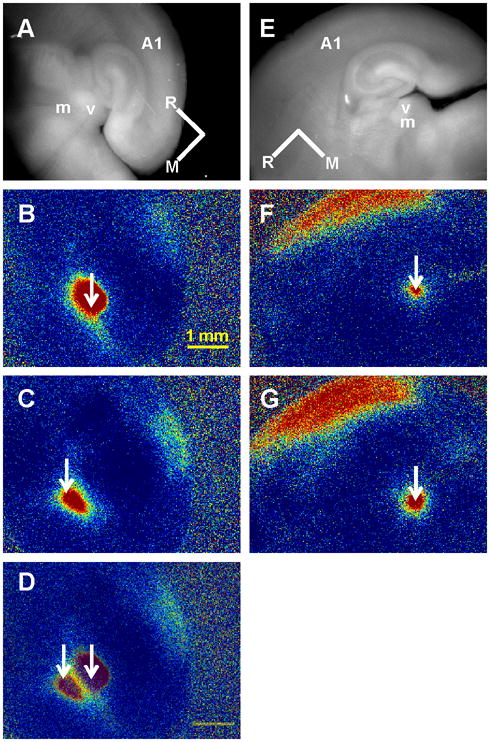
Connectivity in the auditory thalamocortical slice preparation. (A) Electrical stimulation of MGBm and FA response in auditory cortex. (B) Electrical stimulation in MGBv and cortical response. (C) Raw FA image for anatomical reference. (D) Overlay of (A) and (B). Note the lack of overlap between stimulation sites and limitation of activation to the borders of the subnuclei. (E) Raw FA image for anatomical references for panels (F) and (G). (F) Cortical response to MGBm photostimulation. (C) Cortical response to photostimulation in MGBv. See Figure 1 for colormap. In (A) and (E): m = MGBm, v = MGBv, R = Rostral, M = Medial. See Figure 1 for FA colorbar and corresponding ΔF/F values. Single arrows in (B), (C), (F) and (G) correspond to stimulation sites.
Discussion
Here, we demonstrated that two thalamocortical slice preparations from different sensory systems contain both specific and non-specific thalamocortical pathways. Non-specific projections, from VM and CL, to cortex are maintained in a modified version of the somatosensory slice [3] along with projections from first-order and higher-order specific thalamic nuclei, VP and POm, to cortex. We have also demonstrated that MGBm projections to cortex are intact in the standard auditory thalamocortical slice preparation [7]. Interactions between specific and non-specific thalamocortical circuits are thus viable in these slice preparation, enabling the comparative study of interactions among VM, POm, CL and VP thalamocortical circuitry in the somatosensory slice and MGBv and MGBm projections to cortex in the auditory slice. This provides a powerful tool for future elucidation of the physiological interactions of these pathways at their cortical targets.
Conclusion
The potential interactions between specific and non-specific pathways are particularly intriguing, since the role of layer 1-projecting thalamocortical relays is unknown. The apical dendrites of corticothalamic pyramidal cells in layer 5 extend into layer 1, facilitating possible interactions with the robust corticothalamocortical circuit. Furthermore, layer 5 pyramidal cells exhibit a strong form of coincidence detection involving the layer 1 projecting thalamocortical neurons and cortical circuitry that is closely related to specific thalamocortical input [3,16]. The utility of these slices containing both systems can qualitatively elucidate whether coincidence detection is employed for these two projections and quantitatively determine the relationship between the timing of inputs and the degree of coincidence detection.
Acknowledgments
NIH/NIDCD grant R01 DC008794 (SMS) and NIH/NINDS Grant F32NS054478 (CCL)
We thank D.A. Llano, A. Mallik and N.P. Issa for their invaluable technical advice and expertise with in vitro FA imaging.
Footnotes
The authors report no conflicts of interest.
References
- 1.Lorente de No R. Cerebral cortex: architecture, intra-cortical connections, motor projections. In: Fulton J, editor. Physiology of the Nervous System. London: Oxford University Press; 1938. pp. 291–340. [Google Scholar]
- 2.Jones EG. A new view of specific and nonspecific thalamocortical connections. Adv Neurol. 1998;77:49–71. discussion 72-43. [PubMed] [Google Scholar]
- 3.Llinas RR, Leznik E, Urbano FJ. Temporal binding via cortical coincidence detection of specific and nonspecific thalamocortical inputs: A voltage-dependent dye-imaging study in mouse brain slices. Proceedings of the National Academy of Sciences of the United States of America. 2002;99:449–454. doi: 10.1073/pnas.012604899. [DOI] [PMC free article] [PubMed] [Google Scholar]
- 4.Stiebler I, Neulist R, Fichtel I, Ehret G. The auditory cortex of the house mouse: left-right differences, tonotopic organization and quantitative analysis of frequency representation. Journal of Comparative Physiology A: Neuroethology, Sensory, Neural, and Behavioral Physiology. 1997;181:559–571. doi: 10.1007/s003590050140. [DOI] [PubMed] [Google Scholar]
- 5.Simons DJ, Woolsey TA. Functional organization in mouse barrel cortex. Brain Res. 1979;165:327–332. doi: 10.1016/0006-8993(79)90564-x. [DOI] [PubMed] [Google Scholar]
- 6.Agmon A, Connors BW. Thalamocortical responses of mouse somatosensory (barrel) cortexin vitro. Neuroscience. 1991;41:365–379. doi: 10.1016/0306-4522(91)90333-j. [DOI] [PubMed] [Google Scholar]
- 7.Cruikshank SJ, Rose HJ, Metherate R. Auditory thalamocortical synaptic transmission in vitro. J Neurophysiol. 2002;87:361–384. doi: 10.1152/jn.00549.2001. [DOI] [PubMed] [Google Scholar]
- 8.Lee CC, Sherman SM. Synaptic Properties of Thalamic and Intracortical Inputs to Layer 4 of the First- and Higher-Order Cortical Areas in the Auditory and Somatosensory Systems. J Neurophysiol. 2008;100:317–326. doi: 10.1152/jn.90391.2008. [DOI] [PMC free article] [PubMed] [Google Scholar]
- 9.Shibuki K, Hishida R, Murakami H, Kudoh M, Kawaguchi T, Watanabe M, et al. Dynamic imaging of somatosensory cortical activity in the rat visualized by flavoprotein autofluorescence. J Physiol. 2003;549:919–927. doi: 10.1113/jphysiol.2003.040709. [DOI] [PMC free article] [PubMed] [Google Scholar]
- 10.Llano DA, Theyel BB, Mallik AK, Sherman SM, Issa NP. Rapid and Sensitive Mapping of Long-Range Connections In Vitro Using Flavoprotein Autofluorescence Imaging Combined With Laser Photostimulation. J Neurophysiol. 2009;101:3325–3340. doi: 10.1152/jn.91291.2008. [DOI] [PMC free article] [PubMed] [Google Scholar]
- 11.Theyel BB, Llano DA, Sherman SM. The corticothalamocortical circuit drives higher-order cortex in the mouse. Nat Neurosci. 2010;13:84–88. doi: 10.1038/nn.2449. [DOI] [PMC free article] [PubMed] [Google Scholar]
- 12.Lam Y-W, Sherman SM. Mapping by Laser Photostimulation of Connections Between the Thalamic Reticular and Ventral Posterior Lateral Nuclei in the Rat. J Neurophysiol. 2005;94:2472–2483. doi: 10.1152/jn.00206.2005. [DOI] [PubMed] [Google Scholar]
- 13.Lam Y-W, Nelson CS, Sherman SM. Mapping of the Functional Interconnections Between Thalamic Reticular Neurons Using Photostimulation. J Neurophysiol. 2006;96:2593–2600. doi: 10.1152/jn.00555.2006. [DOI] [PubMed] [Google Scholar]
- 14.Lam Y-W, Sherman SM. Different Topography of the Reticulothalmic Inputs to First-and Higher-Order Somatosensory Thalamic Relays Revealed Using Photostimulation. J Neurophysiol. 2007;98:2903–2909. doi: 10.1152/jn.00782.2007. [DOI] [PubMed] [Google Scholar]
- 15.Reinert KC, Dunbar RL, Gao W, Chen G, Ebner TJ. Flavoprotein Autofluorescence Imaging of Neuronal Activation in the Cerebellar Cortex In Vivo. J Neurophysiol. 2004;92:199–211. doi: 10.1152/jn.01275.2003. [DOI] [PubMed] [Google Scholar]
- 16.Larkum ME, Kaiser KM, Sakmann B. Calcium electrogenesis in distal apical dendrites of layer 5 pyramidal cells at a critical frequency of back-propagating action potentials. Proc Natl Acad Sci U S A. 1999;96:14600–14604. doi: 10.1073/pnas.96.25.14600. [DOI] [PMC free article] [PubMed] [Google Scholar]