Abstract
Despite the therapeutic importance of antifolates, the links between their direct antimetabolite activity and downstream consequences remain incompletely understood. Here we employ metabolomics to examine the complete metabolic effects of the antibiotic trimethoprim in E. coli. In rich media, trimethoprim treatment causes thymineless death. In minimal media, in contrast, trimethoprim addition results in rapid stoppage of cell growth and stable cell stasis. We show that initial impairment of cell growth is due to rapid depletion of glycine and associated activation of the stringent response. Long-term stasis is due to purine insufficiency. Thus, E. coli has dual systems for surviving folate depletion and avoiding thymineless death: a short-term response based on sensing of amino acids and a long-term response based on sensing of nucleotides.
Antifolates have been used for decades as anti-cancer and antibacterial agents (1). Antifolates block cellular growth by inhibiting key enzymes in the folate biosynthesis pathway, such as dihydrofolate reductase (DHFR). DHFR catalyzes the conversion of inactive dihydrofolates to active tetrahydrofolates, which are necessary for the synthesis of glycine, methionine, thymidine triphosphate (dTTP), and purines. Thus, inhibition of DHFR activity depletes cells of metabolites necessary for DNA, RNA, and protein biosynthesis. Although best known for their ability to induce thymineless death, under certain nutrient conditions, DHFR inhibitors cause cells to enter and remain in stasis, a quiescent-like state in which cells stop proliferating. By entering stasis, cells are able to avoid death during DHFR inhibition; however, it is not clear how cells stop growth and enter a stable stasis. Here, using the antifolate trimethoprim as an example, we investigate the mechanism by which E. coli halts growth and prevents death during DHFR inhibition.
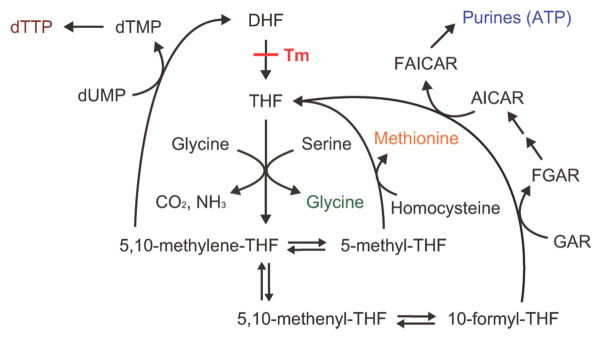
Trimethoprim inhibits bacterial DHFR, leading to a depletion of active tetrahydrofolates, which are necessary for glycine, methionine, dTTP, and purine biosynthesis in E. coli (Scheme 1). Trimethoprim is bactericidal in rich media (2) but leads only to bacteriostasis in minimal media (3). More specifically, trimethoprim is bactericidal when glycine, methionine, and a purine source (such as inosine) are added to minimal media (4), as cells become depleted of dTTP and undergo thymine-less death (5, 6). Addition of thymine (which cells convert to dTTP) to cells growing in minimal media with glycine, methionine, and a purine source reverses the bactericidal effect of trimethoprim (4).
Scheme 1.
Pathways affected by trimethoprima
aTrimethoprim (Tm) inhibits the conversion of inactive dihydrofolates (DHF) to active tetrahydrofolates (THF), leading to the depletion of dTTP, glycine, methionine, and purines (such as ATP).
Thymine starvation triggers many cellular processes, including induction of DNA repair systems and cell filamentation (7). While substantial DNA damage is observed during thymineless death, protein and RNA syntheses continue (8). In addition to altered dTTP levels, the pool sizes of other endogenous deoxyribonucleoside triphosphates (dNTPs) are also aberrant during thymine starvation (9–11). Changes in levels of other metabolites during thymineless death have yet to be explored.
Here, we investigate the processes by which cells stop growth and enter stasis in response to DHFR inhibition by trimethoprim. We track the dynamics of the E. coli metabolome following trimethoprim treatment using high performance liquid chromatography-tandem mass spectrometry (LC-MS/MS). Through this approach, we identify the growth-limiting metabolites that trigger survival mechanisms to stop growth. We find that glycine depletion first stops cell growth through activation of the stringent response. Next, purine depletion caused by DHFR blockade stops cell growth. Intriguingly, DHFR-induced purine depletion induces a cellular metabolic state resembling phosphate starvation, a natural stress that bacteria have accordingly evolved to survive. Thus, in minimal media, depletion of amino acids and purines precedes and thereby precludes thymineless death.
RESULTS AND DISCUSSION
Metabolomic Analysis Reveals Full Scope of Pathways Affected by Trimethoprim
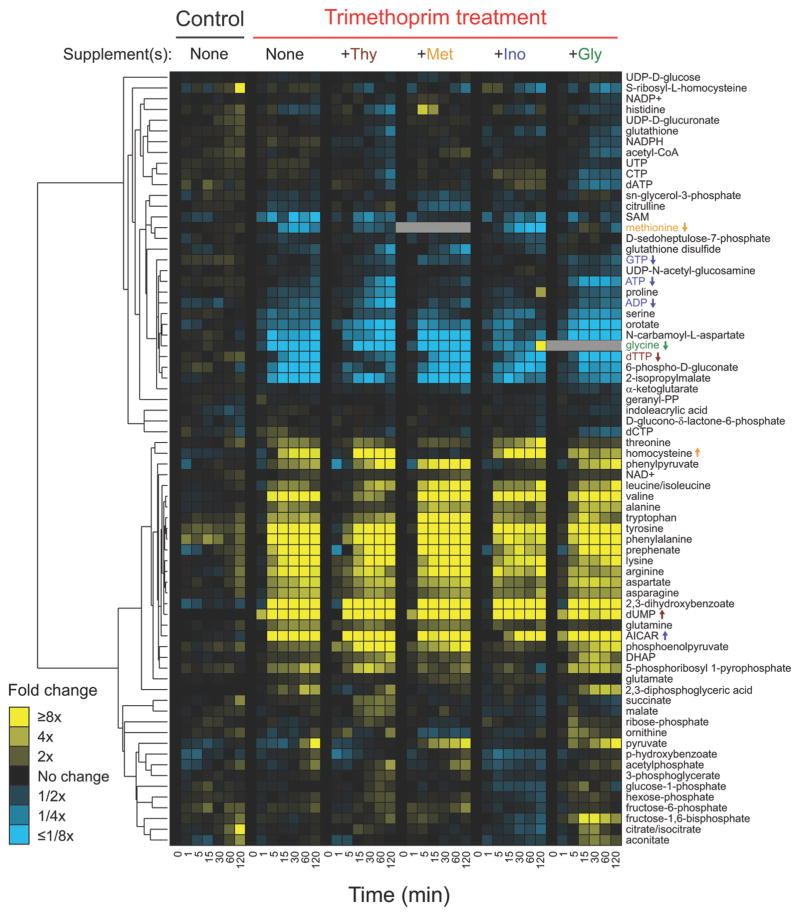
We explored the dynamics of intracellular metabolites in trimethoprim-treated E. coli using LC-MS/MS-based metabolomics. By using the filter plate method for fast quenching of the E. coli metabolome (12), we are able to detect rapid metabolic changes in response to antibiotic treatment, and use the timing of each change to gain a more nuanced understanding of the response of E. coli to trimethoprim. We measured 72 intracellular metabolites 1, 5, 15, 30, 60, and 120 min after trimethoprim treatment and compared their relative concentrations to the values at the time of drug addition. Metabolomic changes that occur immediately post trimethoprim addition include a buildup of precursors in folate-dependent pathways and reduced concentrations of the products of these pathways (Figure 1). By 120 min post treatment, levels of intracellular homocysteine (methionine precursor), deoxyuridine monophosphate (dUMP, a precursor for thymidine triphosphate, dTTP), and aminoimidazole carboxamide ribonucleotide (AICAR, an upstream purine intermediate) increase by ~5, ~50, and ~50 fold, respectively, consistent with the drug inhibiting the known folate-dependent steps of these pathways (Figure 1).
Figure 1.
Profiles of 72 intracellular metabolites in wildtype E. coli treated with trimethoprim while growing in minimal media containing indicated supplements. Relative levels are expressed as the log ratio of the normalized signal intensity in drug-treated cells at each time point to the normalized signal intensity in the drug-free time 0 sample (n ≥ 2 independent experiments). Signal intensity was normalized to the cell optical density (A650) at each time point. In cases of exogenous glycine and/or methionine addition, glycine and methionine levels are not reported because intracellular pools could not be differentiated from extracellular pools.
dUMP is the first metabolite to accumulate, rising ~5-fold within 1 min of drug addition and >30-fold within 5 min. AICAR also rises >30-fold within 5 min, and homocysteine rises slowly, ~5-fold over ~5 min of trimethoprim addition. Many amino acids accumulate following trimethoprim treatment, presumably from protein synthesis coming to a halt. Metabolites downstream of chorismate, a folate precursor, also accumulate. They include 2,3-dihydroxybenzoate, phenylpyruvate, phenylalanine, tryptophan, and tyrosine.
Trimethoprim First Depletes Intracellular Glycine
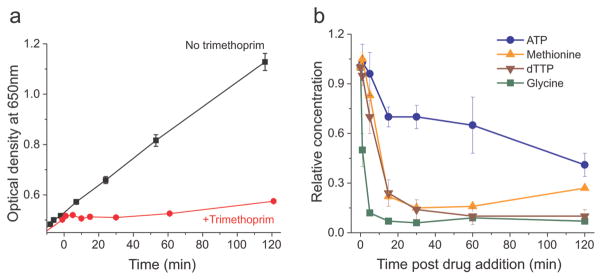
E. coli stop growing within 1 min of trimethoprim addition (Figure 2, panel a). Trimethoprim inhibits the synthesis of tetrahydrofolates, which are necessary for the production of glycine, methionine, dTTP, and purines. While these folate-dependent metabolites deplete with trimethoprim treatment, the metabolite that depletes most rapidly and markedly is glycine (Figure 2, panel b). Half of the intracellular glycine pool is depleted within 1 min, falling by ~90% within 5 min. The next folate-dependent metabolite to deplete, dTTP, falls by only ~5% within 1 min and ~30% after 5 min and eventually depletes by ~90% within 60 min. Methionine levels remain steady for the first minute and then drop by ~20% within 5 min of trimethoprim treatment. By 30 min, methionine levels fall to ~15% of initial values. Adenosine triphosphate (ATP) levels decrease less dramatically, depleting by ~30% by 15 min and to ~40% of initial values by 120 min.
Figure 2.
The first folate-dependent metabolite to be depleted following trimethoprim addition, accounting for the almost immediate halt in growth, is glycine. a) Growth curves for E. coli with trimethoprim addition (red) and without trimethoprim (black) in minimal media. Error bars show ±1 SE of the mean (n = 3). b) Concentration data for four metabolites from trimethoprim-treated E. coli. Data are shown as relative concentration normalized to concentrations at time 0 and optical density. Trimethoprim was added to cells growing in minimal media at time 0. Error bars show ±1 SE of the mean (n ≥ 2 independent experiments).
As an initial test of the effects of nutrient supplementation on the metabolome of trimethoprim-treated cells, we grew E. coli in minimal media containing a single supplement (inosine, methionine, thymine, or glycine). Metabolomic analysis demonstrates that rapid depletion of glycine occurs when any single supplement other than glycine is provided in the media (Figure 1). Other metabolites mostly show the same general trends across the single supplement experiments. Homocysteine increases in all cases except for when exogenous methionine is added to the media. This is consistent with methionine being an inhibitor of homoserine O-succinyltransferase (13), which catalyzes the first reaction in the methionine biosynthesis pathway.
When exogenous inosine is provided in the media, intracellular glycine levels initially drop with trimethoprim treatment; 2 h after drug addition, however, glycine levels rise to almost 10-fold normal levels. This is from the conversion of threonine to glycine, which is catalyzed by two enzymes, 2-amino-3-ketobutyrate CoA ligase (product of kbl) and L-threonine aldolase (product of ltaE). In the kbl−ltaE− double mutant, glycine levels do not rise with inosine supplementation (Supplementary Figure 1). Thus, cells are able to convert threonine to generate glycine in the presence of a purine source; accordingly, while a candidate for causing initial stoppage of cell growth, glycine depletion seems likely to be insufficient to cause stable cell stasis.
Trimethoprim Leads to a Hierarchical Depletion of Folate-Dependent Metabolites
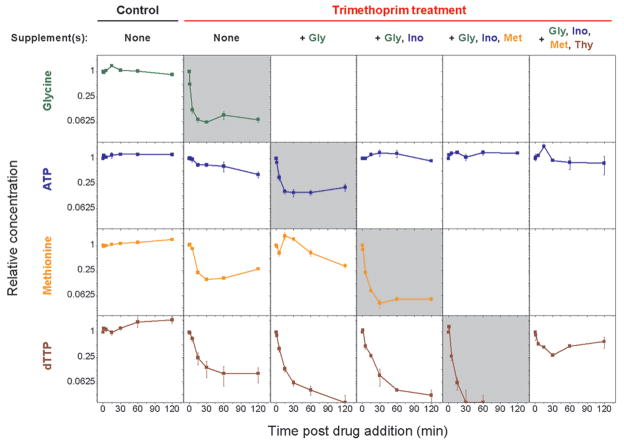
The metabolomic results of supplemented conditions suggest that trimethoprim treatment results in sequential metabolic changes. When drug-induced glycine starvation is prevented by addition of exogenous glycine, purines deplete much faster (see ATP, GTP, ADP, dATP in Figure 1). ATP levels decrease much more drastically and rapidly under glycine supplementation compared to minimal media (Figure 3). These results suggest that under minimal media conditions, cells are able to maintain purine concentrations as long as purine consumption is decreased secondary to glycine depletion. Methionine and dTTP levels also drop somewhat more quickly when trimethoprim is added in the presence of glycine.
Figure 3.
Trimethoprim treatment in minimal media leads to hierarchical depletion of folate-dependent metabolites. When drug-induced glycine starvation is prevented by addition of exogenous glycine, the first intracellular pool to be depleted is that of purines (ATP). Supplementation with both glycine and inosine (a purine source) leads to rapid methionine depletion. When glycine, inosine, and methionine are all supplemented, dTTP depletes much more rapidly, in which case cells die instead of simply not growing. In cases of exogenous glycine and/or methionine addition, glycine and methionine levels are not reported because intracellular pools could not be differentiated from extracellular pools. Error bars show ±1 SE of the mean (n ≥ 2 independent experiments).
Supplementation with both glycine and inosine (a purine source) leads to more rapid methionine depletion (Figure 3). ATP levels are maintained because inosine circumvents the need for de novo purine biosynthesis. Methionine concentrations fall markedly faster. dTTP changes are similar to those seen under glycine supplementation. It appears that purine depletion by trimethoprim normally prevents methionine depletion, presumably by inhibiting translation; restoration of purine concentrations by supplementation of a purine precursor causes methionine concentrations to drop rapidly upon trimethoprim treatment.
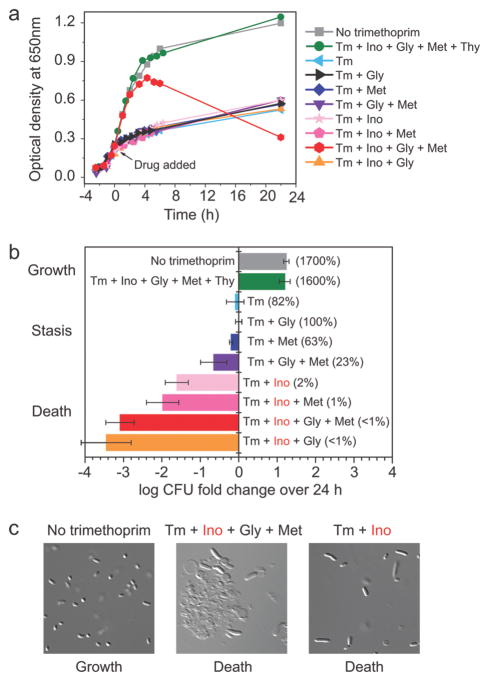
When glycine, inosine, and methionine are all supplemented, dTTP levels drop more precipitously than under the previously described conditions, falling to <10% of initial concentrations in 30 min (Figure 3). Under these conditions, cells do not enter stasis but instead die (Figure 4, panel b). Figure 4, panel a shows the growth curves of E. coli after trimethoprim treatment with various supplement conditions, and Figure 4, panel b shows the corresponding viability of these cells after 24 h of drug treatment. Note that optical density measurements 24 h post trimethoprim addition are not good indicators of cell death, as cells die intact (without bursting) in some conditions while lysing in other conditions (Figure 4, panel c).
Figure 4.
Inosine supplementation leads to thymineless death. a) Effect of trimethoprim (Tm) on the growth of E. coli. Trimethoprim was added at time 0, as indicated by the arrow. Data shown is one representative replicate of at least triplicates. b) Influence of various supplements on viability of wildtype E. coli 24 h post trimethoprim addition. Colony forming units (CFU) were counted 24 h post drug treatment and normalized to the CFU count at 0 h (time of drug addition). The x axis represents CFU fold change over 24 h on a log 10 scale. Error bars show ±1 SE of the mean (n ≥ 2 independent experiments). c) Microscopic images of wildtype cells 24 h post trimethoprim treatment under different conditions. Images taken using Zeiss AxioVision 4.5.
Trimethoprim treatment in minimal media leads to depletion of folate-dependent metabolites in the following hierarchical order: (1) glycine, (2) purines, (3) methionine, and (4) dTTP. Addition of exogenous glycine, inosine, methionine, and thymine (which cells convert to dTTP) allows drug-treated cells to grow to saturation (Figure 4, panel a). The availability of these intermediates in the media compensates for the inability of E. coli to synthesize folate-dependent metabolites, and therefore growth occurs at the same rate as for untreated cultures. A heat map containing all metabolite data for conditions shown in Figure 3 is presented in Supplementary Figure 2.
Intracellular Purine Levels Ultimately Dictate Cell Fate
Addition of exogenous glycine, inosine, methionine, and thymine (which cells convert to dTTP) allows drug-treated cells to grow like cells without trimethoprim (Figure 4). Addition of all supplements except for thymine leads to >99% cell death over 24 h of trimethoprim treatment. Looking at optical density alone, any other supplement combination seems to lead to stasis, as cells stop exponential growth upon trimethoprim addition and remain an optical density at 650 nm of <0.6. However, CFU counts 24 h post drug addition reveal cell death whenever inosine is supplemented, with cell survival ≤2%. Thus, purine depletion allows cells to avoid thymineless death. Sensing amino acid depletion also plays some role in avoiding thymineless death, as supplementation with glycine and methionine causes some death (survival rate = 23%).
Amino Acid Depletion Activates the Stringent Response
The stringent response is a multi-effect stress response triggered when protein synthesis stalls due to unloaded tRNAs (14). This response is associated with the accumulation of guanosine 5′-triphosphate, 3′-diphosphate (pppGpp), and guanosine 5′-diphosphate, 3′-diphosphate (ppGpp), collectively known as (p)ppGpp, which is synthesized by RelA and SpoT proteins (15). During amino acid starvation, RelA activates the synthesis of (p)ppGpp (16). SpoT is involved in (p)ppGpp synthesis during starvation for other nutrients (17). As trimethoprim treatment first depletes the amino acid glycine, we tested whether the stringent response is responsible for the initial rapid halt in growth by making a relA mutant. As shown in Figure 5, the stringent response keeps cells alive in the short term: when wildtype is supplemented with inosine only, allowing for the activation of the stringent response through glycine and methionine depletion, essentially all cells survive for the first 11 h of drug treatment. In the presence of inosine, preventing the stringent response from becoming activated by glycine and methionine supplementation causes significant cell death within 2 h of trimethoprim treatment. Similarly, inactivating the stringent response by deleting relA causes more than 50% of cells to die within 2 h of trimethoprim addition when inosine is supplemented. The somewhat higher survival in the relA mutant compared to wildtype cells supplemented with glycine and methionine may be due to the residual (p)ppGpp synthetic activity by SpoT (18) in the relA mutant. However, the stringent response is not sufficient to keep cells alive in the long term; wildtype supplemented with inosine only dies by 24 h post trimethoprim addition (survival rate = 2%). Whereas the ability to detect purine depletion ultimately allows for cell survival, the ability to detect amino acid depletion significantly delays death.
Figure 5.
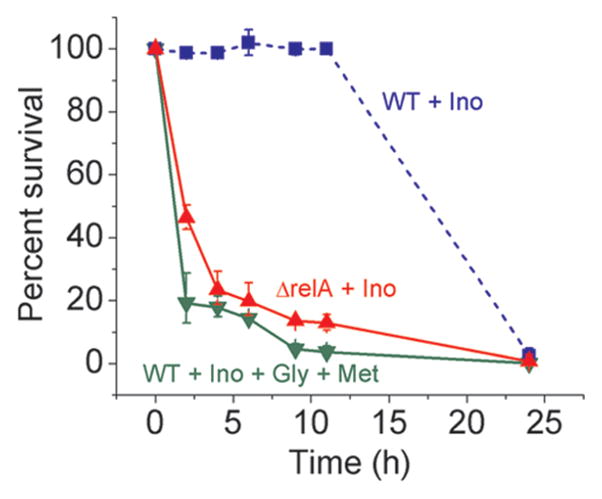
Glycine limitation delays trimethoprim-triggered thymineless death. Trimethoprim was added at log phase (time 0). Colony forming units (CFU) were counted at various time points post drug treatment and normalized to the CFU count at 0 h (time of drug addition). Error bars show ±1 SE of the mean (n ≥ 3 independent experiments).
Purine Depletion Metabolically Mimics Aspects of Phosphate Starvation
As shown in Figure 6, when the stringent response is activated, intracellular NTP pools remain stable. However, bypassing the stringent response in drug-treated cells through relA deletion or glycine and methionine supplementation causes intracellular NTP pools to deplete. A similar depletion in NTPs is also observed when E. coli cells are switched from media containing abundant phosphate to media containing no phosphate. Both trimethoprim treatment (an artificial means of causing NTP depletion) and switch to no-phosphate media (a natural phosphate starvation) cause E. coli to stop growing and enter stasis (Figure 4 and Supplementary Figure 3). The similarity in metabolomics data raises the possibility that purine depletion during trimethoprim treatment triggers cellular defense mechanisms normally induced by phosphate starvation. When both amino acid and purine depletion sensors are bypassed through glycine, methionine, and inosine supplementation, intracellular NTP pools increase, while dTTP plummets, leading to thymineless death.
Figure 6.

Profiles of intracellular triphosphates in conditions that bypass the stringent response during trimethoprim (Tm) treatment are similar to those in phosphate-starved cells. Intracellular NTP pools are stable when the stringent response is on, but are depleted when the stringent response is off. Intracellular NTP pools increase during thymineless death. Relative levels are expressed as the log ratio of the normalized signal intensity in drug treated cells at each time point to the normalized signal intensity in the drug-free time 0 sample (n ≥ 2 independent experiments).
Trimethoprim triggers two different responses of nutrient limitation. The first response reacts to amino acid (glycine and methionine) deprivation, and a second response reacts to purine depletion. While inactivation of the stringent response alone causes some cell death (77%) during trimethoprim treatment, blocking purine depletion causes more death (98%). When both safeguards are turned off, >99% cell death occurs following trimethoprim treatment.
It is interesting to note that cells cannot sense thymine limitation and instead die of thymineless death. We are unaware of a natural environmental condition that would cause thymine starvation; as long as pyrimidines are available, cells can generate dTMP from dUMP and eventually convert it to dTTP to make DNA. However, environmental changes in phosphate levels are common, and cells have accordingly evolved a mechanism for sensing phosphate limitation and halting growth. There has been no such evolutionary pressure to respond to thymine limitation, and as a result, E. coli are susceptible to thymineless death.
Conclusions
LC-MS/MS-based metabolomics has many important applications, including drug metabolism (19), biomarker discovery (20), personalization of therapy (21), and elucidation of drug action (22). Here we contribute to deepening the understanding of the mechanism of drug action: exploring the dynamics of the metabolome revealed both the full scope of pathways impacted by trimethoprim and also the primary growth-limiting biosynthetic defect. This technology allowed for the identification of glycine, an amino acid, as the first metabolite to deplete following drug treatment, pointing to the stringent response as the first mechanism for stopping cell growth. Next, it revealed the depletion of triphosphates, a metabolic profile also present during phosphate starvation. Finally, metabolomics uncovered the broad effects of one antimetabolite: inhibiting one enzymatic reaction affects not only the pathways immediately linked to that step but also pathways far upstream and downstream of the reaction.
METHODS
Chemicals and Reagents
Trimethoprim (≥98%), glycine (≥99%), methionine (≥99%), inosine (≥99%), thymine (≥99%), and all media components were from Sigma-Aldrich. Ammonium acetate (99.4%) was from Mallinckrodt Chemicals, and ammonium hydroxide solution (29.73%) was from Fisher Scientific. Dimethyl sulfoxide (ACS reagent grade) was from MP Biomedicals, Inc. HPLC-grade water, acetonitrile, and methanol (OmniSolv; EMD Chemical) were from VWR International.
Microbial Culture Conditions and Extraction
E. coli K-12 strain NCM3722 was grown at 37 °C in a minimal salts media (23) with 10 mM ammonium chloride as the nitrogen source and 0.4% glucose as the carbon source with or without 4 μg mL−1 trimethoprim and 0.3 mM supplements (glycine, methionine, inosine, and/or thymine). A trimethoprim stock solution (1 mg mL−1) was made by dissolving trimethoprim in dimethyl sulfoxide (DMSO). All supplements were dissolved directly into the media to a final concentration of 0.3 mM before media sterilization. To generate growth curves, cells were grown in liquid culture in a shaking flask, and optical density at 650 nm (A650) was measured at various time points. To obtain exponential-phase cultures, saturated overnight cultures were diluted 1:30 and then grown in liquid culture in a shaking flask to A650 of ~0.1. A 5 mL portion of cells was then transferred to nylon membrane filters resting on vacuum filter support. Once the cells were loaded, the membrane filters were transferred to media-loaded agarose plates (for details, see ref 12). Cells were grown to A650 of ~0.5 and extracted as the 0 min sample. Metabolism was quenched by direct and immediate transfer of the filters into 4 °C extraction solvent (40:40:20 acetonitrile/methanol/water with 0.1 M formic acid), and extraction was carried out as described previously (12).
For experiments involving trimethoprim and supplements, when E. coli cultures reached A650 of ~0.5, the cell-loaded membrane filters were switched to media-loaded agarose plates containing 4 μg mL−1 trimethoprim with or without 0.3 mM supplements (glycine, methionine, inosine, and/or thymine) and extracted at the following times after the switch: 1, 5, 15, 30, 60, and 120 min. For colony forming unit (CFU) counts to determine cell viability, subcultures were made on LB agar (1% tryptone, 0.5% yeast extract, 0.5% NaCl, 1.5% agar).
For phosphate starvation experiments, MOPS minimal media (24) (Teknova) containing 10 mM ammonium chloride and 0.4% glucose was used. Samples were initially grown in liquid pMOPS media containing 1.32 mM K2HPO4, to A650 of ~0.1, as described above. Cells were then loaded on membrane filters and transferred to agarose plates containing MOPS media with 0.5 mM K2HPO4. Filters were switched to phosphate-free MOPS agarose plates at A650 of ~0.3, and after 30 s, the filters were switched to a second phosphate-free MOPS plate, to minimize phosphate carryover on the nylon filter. Metabolism was quenched, and samples were extracted as described above.
LC-MS/MS Analysis
Two different LC separations were coupled by electrospray ionization (ESI) to triple quadrupole mass spectrometers operating in multiple reaction monitoring mode. The LC method coupled to positive-mode ESI was hydrophilic interaction chromatography on an aminopropyl column at basic pH, as previously described (25). The LC method coupled to negative-mode ESI was reversed-phase chromatography using an amine-based ion pairing agent (a variation of the method used in ref (26)). The stationary and mobile phases were identical, but the gradient was altered as follows: t = 0, 0% B; t = 5, 0% B; t = 10, 20% B; t = 20, 20% B; t = 35, 65% B; t = 38, 95% B; t = 42, 95% B, t = 43, 0% B; t = 50, 0% B; where B refers to the methanol-containing mobile phase. For LC, we used an LC-20 AD HPLC system (Shimadzu) with autosampler temperature of 4 °C and injection volume of 10 μL. For MS, we used a TSQ Quantum Ultra or Discovery Max triple-quadrupole mass spectrometer (Thermo Fisher Scientific). Mass spectrometry parameters were as previously described (25).
Mutant Construction
Strains from the Keio collection (27) in which the gene of interest had been replaced with a kanamycin (kan) resistance cassette were used. Mutant strains were constructed by using P1vir transduction (28) to move the necessary alleles from the Keio collection to NCM3722. The kan cassette was removed using FLP recombinase (29) to create unmarked, in-frame deletion strains.
Supplementary Material
Acknowledgments
We thank A. Hottes, H. Goodarzi, and S. Amini for assistance with microscopy and mutant construction and verification. This research was supported by the National Institute of Health (NIH) Center for Quantitative Biology at Princeton University (P50GM071508), the American Heart Association grant 0635188N, and NSF Career Award MCB-0643859.
Footnotes
Supporting Information Available: This material is available free of charge via the Internet at http://pubs.acs.org.
References
- 1.Gangjee A, Jain HD, Kurup S. Recent advances in classical and non-classical antifolates as antitumor and antiopportunistic infection agents: part I. Anti-Cancer Agents Med Chem. 2007;7:524–542. doi: 10.2174/187152007781668724. [DOI] [PubMed] [Google Scholar]
- 2.Bushby SRM, Hitchings GH. Trimethoprim, a sulphonamide potentiator. Br J Pharmac Chemother. 1968;33:72–90. doi: 10.1111/j.1476-5381.1968.tb00475.x. [DOI] [PMC free article] [PubMed] [Google Scholar]
- 3.Then R, Angehrn P. Effects of trimethoprim on Escherichia coli under limited nutrition. Arzneim Forsch. 1973;23:451–455. [PubMed] [Google Scholar]
- 4.Amyes SGB, Smith JT. Trimethoprim action and its analogy with thymine Starvation. Antimicrob Agents Chemother. 1974;5:169–178. doi: 10.1128/aac.5.2.169. [DOI] [PMC free article] [PubMed] [Google Scholar]
- 5.Cohen SS, Barner HD. Studies on unbalanced growth in Escherichia coli. Proc Natl Acad Sci USA. 1954;40:885–893. doi: 10.1073/pnas.40.10.885. [DOI] [PMC free article] [PubMed] [Google Scholar]
- 6.Then R, Angehrn P. Sulphonamide-induced ‘thymine-less death’ in Escherichia coli. J Gen Microbiol. 1973;76:255–263. doi: 10.1099/00221287-76-2-255. [DOI] [PubMed] [Google Scholar]
- 7.Bazill GW. Lethal unbalanced growth in bacteria. Nature. 1967;216:346–349. doi: 10.1038/216346a0. [DOI] [PubMed] [Google Scholar]
- 8.Ahmad SI, Kirk SH, Eisenstark A. Thymine metabolism and thymineless death in prokaryotes and eukaryotes. Annu Rev Microbiol. 1998;52:591–625. doi: 10.1146/annurev.micro.52.1.591. [DOI] [PubMed] [Google Scholar]
- 9.Biswas C, Hardy J, Beck WS. Release of repressor control of ribonucleotide reductase by thymine starvation. J Biol Chem. 1965;240:3631–3640. [PubMed] [Google Scholar]
- 10.Neuhard J, Thomassen E. Turnover of the deoxyribonucleoside triphosphates in Escherichia coli 15 T during thymine starvation. Eur J Biochem. 1971;20:36–43. doi: 10.1111/j.1432-1033.1971.tb01359.x. [DOI] [PubMed] [Google Scholar]
- 11.Ohkawa T. Studies of intracellular thymidine nucleotides. Eur J Biochem. 1975;60:57–66. doi: 10.1111/j.1432-1033.1975.tb20975.x. [DOI] [PubMed] [Google Scholar]
- 12.Yuan J, Bennett BD, Rabinowitz JD. Kinetic flux profiling for quantitation of cellular metabolic fluxes. Nat Protoc. 2008;3:1328–1340. doi: 10.1038/nprot.2008.131. [DOI] [PMC free article] [PubMed] [Google Scholar]
- 13.Lee L-W, Ravel JM, Shive W. Multimetabolite control of a biosynthetic pathway by sequential metabolites. J Biol Chem. 1966;241:5479–5480. [PubMed] [Google Scholar]
- 14.Cashel M, Gentry DR, Hernandez VJ, Vinella D. The Stringent Response. In: Neidhardt FC, editor. Escherichia Coli and Salmonella Cellular and Molecular Biology. 2. American Society for Microbiology; Washinton, DC: 1996. pp. 1458–1496. [Google Scholar]
- 15.Potrykus K, Cashel M. (p)ppGpp: still magical? Annu Rev Microbiol. 2008;62:35–51. doi: 10.1146/annurev.micro.62.081307.162903. [DOI] [PubMed] [Google Scholar]
- 16.Haseltine WA, Block R. Synthesis of guanosine tetra-and pentaphosphate requires the presence of a codon-specific, uncharged transfer ribonucleic acid in the acceptor site of ribosomes. Proc Natl Acad Sci USA. 1973;70:1564–1568. doi: 10.1073/pnas.70.5.1564. [DOI] [PMC free article] [PubMed] [Google Scholar]
- 17.Battesti A, Bouveret E. Acyl carrier protein/SpoT interaction, the switch linking SpoT-dependent stress response to fatty acid metabolism. Mol Microbiol. 2006;62:1048–1063. doi: 10.1111/j.1365-2958.2006.05442.x. [DOI] [PubMed] [Google Scholar]
- 18.Xiao H, Kalman M, Ikehara K, Zemel S, Glaser G, Cashel M. Residual guanosine 3′,5′-bispyrophosphate synthetic activity of relA null mutants can be eliminated by spoT null mutations. J Biol Chem. 1991;266:5980–5990. [PubMed] [Google Scholar]
- 19.Hsieh Y. HPLC-MS/MS in drug metabolism and pharmacokinetic screening. Expert Opin Drug Metab Toxicol. 2008;4:93–101. doi: 10.1517/17425255.4.1.93. [DOI] [PubMed] [Google Scholar]
- 20.Sabatine MS, Liu E, Morrow DA, Heller E, McCarroll R, Wiegand R, Berriz GF, Roth FP, Gerszten RE. Metabolomic identification of novel biomarkers of myocardial ischemia. Circulation. 2005;112:3868–3875. doi: 10.1161/CIRCULATIONAHA.105.569137. [DOI] [PubMed] [Google Scholar]
- 21.Clayton TA, Lindon JC, Cloarec O, Antti H, Charuel C, Hanton G, Provost JP, Le Net JL, Baker D, Walley RJ, Everett JR, Nicholson JK. Pharmaco-metabonomic phenotyping and personalized drug treatment. Nature. 2006;440:1073–1077. doi: 10.1038/nature04648. [DOI] [PubMed] [Google Scholar]
- 22.Kwon YK, Lu W, Melamud E, Khanam N, Bognar A, Rabinowitz JD. A domino effect in antifolate drug action in Escherichia coli. Nat Chem Biol. 2008;4:602–608. doi: 10.1038/nchembio.108. [DOI] [PMC free article] [PubMed] [Google Scholar]
- 23.Gutnick D, Calvo JM, Klopotowski T, Ames BN. Compounds which serve as the sole source of carbon or nitrogen for Salmonella typhimurium LT-2. J Bacteriol. 1969;100:215–219. doi: 10.1128/jb.100.1.215-219.1969. [DOI] [PMC free article] [PubMed] [Google Scholar]
- 24.Neidhardt FC, Bloch PL, Smith DF. Culture medium for enterobacteria. J Bacteriol. 1974;119:736–747. doi: 10.1128/jb.119.3.736-747.1974. [DOI] [PMC free article] [PubMed] [Google Scholar]
- 25.Bajad SU, Lu W, Kimball EH, Yuan J, Peterson C, Rabinowitz JD. Separation and quantitation of water soluble cellular metabolites by hydrophilic interaction chromatography-tandem mass spectrometry. J Chromatogr A. 2006;1125:76–88. doi: 10.1016/j.chroma.2006.05.019. [DOI] [PubMed] [Google Scholar]
- 26.Luo B, Groenke K, Takors R, Wandrey C, Oldiges M. Simultaneous determination of multiple intracellular metabolites in glycolysis, pentose phosphate pathway and tricarboxylic acid cycle by liquid chromatography-mass spectrometry. J Chromatogr A. 2007;1147:153–164. doi: 10.1016/j.chroma.2007.02.034. [DOI] [PubMed] [Google Scholar]
- 27.Baba T, Ara T, Hasegawa M, Takai Y, Okumura Y, Baba M, Datsenko KA, Tomita M, Wanner BL, Mori H. Construction of Escherichia coli K-12 in-frame, single-gene knockout mutants: the Keio collection. Mol Syst Biol. 2006;2:0008. doi: 10.1038/msb4100050. [DOI] [PMC free article] [PubMed] [Google Scholar]
- 28.Silhavy TJ, Berman ML, Enquist LW. Experiments with Gene Fusions. Cold Spring Harbor Laboratory Press; Plainview, NY: 1984. [Google Scholar]
- 29.Datsenko KA, Wanner BL. One-step inactivation of chromosomal genes in Escherichia coli K-12 using PCR products. Proc Natl Acad Sci USA. 2000;97:6640–6645. doi: 10.1073/pnas.120163297. [DOI] [PMC free article] [PubMed] [Google Scholar]
Associated Data
This section collects any data citations, data availability statements, or supplementary materials included in this article.


