Abstract
Purpose
To examine the relationship between rate of vascular change and plus disease diagnosis.
Design
Retrospective observational case-control study.
Methods
Wide-angle images were taken bilaterally from 37 infants at 31–33 and 35–37 weeks post-menstrual age (PMA). The semi-automated Retinal Image multiScale Analysis system was used to measure parameters for all arteries and veins: integrated curvature, diameter, and tortuosity index. A reference standard diagnosis (plus vs. not plus) was defined for each eye by consensus of five experts at 35–37 weeks PMA. Weekly rate of change in parameters was compared in eyes with plus vs. not plus disease. Receiver operating characteristic area under the curve (AUC) was calculated for plus disease detection based on: 1) weekly rates of parameter change between 31–33 and 35–37 weeks PMA, and 2) parameter values at 35–37 weeks only.
Results
Weekly rates of change in all venous parameters were significantly different in eyes with plus vs. not plus disease, particularly for tortuosity index (p<0.0004) and diameter (p=0.018). Using weekly rate of change, AUC for plus disease detection was highest for venous tortuosity index (0.819) and venous diameter (0.712). Using the 35–37 week PMA image only, AUC was highest for venous integrated curvature (0.952) and diameter (0.789).
Conclusion
Rate of change in venous, but not arterial, parameters is correlated with plus disease development in this data set. This did not appear to contribute information beyond analysis of an image at 35–37 weeks PMA only.
INTRODUCTION
Retinopathy of Prematurity (ROP) is characterized by abnormal retinal vasoproliferation in low birth weight infants, and is a leading cause of childhood blindness worldwide.1 The multi-center Cryotherapy for ROP (CRYO-ROP) and Early Treatment for ROP (ETROP) studies demonstrated the benefits of appropriate detection and treatment.2,3 Published consensus guidelines state that all infants with birth weight <1500 grams or gestational age ≤30 weeks require screening examination for ROP.4
“Plus disease” was described by the international classification of ROP as a component of severe disease, and is defined as venous dilation and arterial tortuosity greater than that of a published photograph which was selected by expert consensus.2,5,6 The CRYO-ROP and ETROP studies showed that presence of plus disease is a necessary component of threshold disease and a sufficient component of type-1 ROP, both of which have been found to benefit from treatment with laser photocoagulation or cryotherapy.2,3 However, previous studies have shown that there may be significant variability in plus disease diagnosis among different experts,7–10 and that computer-based image analysis systems which quantify vascular features have potential to perform comparably to or better than experts in plus disease diagnosis.10,11 This suggests that there may be advantages of quantitative, objective methods for plus disease diagnosis.
The standard photographic definition of plus disease depicts vascular appearance at a single point in time.2,3 However, vascular abnormalities actually evolve over time. Previous studies have found that faster change in vessel appearance may be a prognostic indicator of worse disease outcome and more rapid progression toward treatment-requiring disease.12–17 The revised international classification of ROP created a new “pre-plus” designation to account for the fact that vascular dilation and tortuosity occur over a range of levels.6 However, little previous work to our knowledge has examined the value of analyzing the rate of vascular change over time in clinical diagnosis of plus disease.
The purpose of this pilot study was to examine the feasibility of quantitative plus disease diagnosis based on analysis of the rate of vascular change over time compared to analysis at a single point in time. Posterior retinal images were interpreted by a group of ROP experts to develop a reference standard (“plus” vs. “not plus”) diagnosis, and a computer-based image analysis system was used to measure quantitative vascular features.
DESIGN AND METHODS
Source of Data
Wide-angle images of the posterior retina were captured bilaterally from 37 infants during routine ROP care using a commercially-available device (RetCam-II, Clarity Medical Systems, Pleasanton, CA). Images were captured from each infant at two sessions: the first between 31–33 weeks post-menstrual age (PMA), and the second between 35–37 weeks PMA. Eyes with good quality posterior pole images at both sessions were included in the study.
Image Interpretation: Experts
Five recognized ROP experts interpreted images. All experts had either been a Principal Investigator or certified investigator in the CRYO-ROP or ETROP studies, or had co-authored at least three peer-reviewed manuscripts involving ROP. Experts designated each image as “plus” or “not plus.” Each image was given a final diagnosis based on the response given by the majority of experts.
Image Interpretation: Computer-Based System
Retinal vessels in each of the 148 images were analyzed using a computer-based system, Retinal Image multiScale Analysis (RISA), using previously-described methods.18,19 This system defines three parameters to quantify the degree of vascular thickness and nonlinearity: diameter, tortuosity index, and integrated curvature. This computer-based system operates by constructing 1-pixel skeletons of the selected vessel, and then calculating geometric properties. Diameter is defined as total area of the vessel, divided by its length. Tortuosity index is the length of the vessel divided by the length of the straight line connecting the start and end points of the vessel. Integrated curvature is defined as the sum of the angles along the skeleton, normalized by the length of the vessel.
Data Analysis
Values for the computer-based image analysis parameters were calculated separately for all vessels present in both the first and second sessions in each eye. Average arterial and venous values were calculated for each parameter: arterial diameter, arterial tortuosity index, arterial integrated curvature, venous diameter, venous tortuosity index, and venous integrated curvature. Rate of vascular change between the first and second sessions in each eye was calculated in two ways: (1) as the change per week in the single vessel in each eye with the highest change between the two sessions for each computer-based system parameter, and (2) as the mean change per week in computer-based system parameters for all vessels present in images from both sessions.
Receiver operating characteristic areas under the curve (AUC) were calculated for use of the computer-based system to detect plus disease. This was performed by plotting sensitivity vs. (1-specificity) compared to the reference standard, while varying hypothetical cutoff thresholds separating “plus” from “not plus.”20–22 This was done by considering all individual computer-based system parameters separately at the first session, all individual computer-based system parameters separately at the second session, change per week in the vessel with highest change between sessions for each parameter, and mean change per week in all vessels present in images from both first and second sessions. P-values were computed to test the hypothesis that diagnostic performance of the computer-based system was better than chance (i.e. AUC=0.5).
RESULTS
Characteristics of Data
Retinal images from 37 infants were captured bilaterally during a first session at 31–33 weeks PMA, and a second session at 35–37 weeks PMA. This resulted in a total of 148 images (37 infants * 2 eyes * 2 sessions). Mean gestational age of infants was 26 weeks, and mean birth weight was 787 grams.
Image Interpretation: Experts
All 148 images were interpreted by 5 experts, and given a reference standard diagnosis of “plus” or “not plus” based on the response provided by the majority of experts (Table 1). Thirteen (8.8%) of the 148 images were given a reference standard diagnosis of “plus” based on expert consensus. All images with a reference standard diagnosis of “plus” were from the second session at 35–37 weeks PMA.
Table 1.
Diagnosis of “plus” versus “not plus” in posterior retinal images by 5 recognized retinopathy of prematurity (ROP) experts.*
| 31–33 weeks | 35–37 weeks | Total | ||||
|---|---|---|---|---|---|---|
| Expert | Plus | Not plus | Plus | Not plus | Plus | Not plus |
| 1 | 0/74 (0%) | 74/74 (100%) | 17/74 (23%) | 57/74 (77%) | 17/148 (11%) | 131/148 (89%) |
| 2 | 0/74 (0%) | 74/74 (100%) | 24/74 (32%) | 50/74 (68%) | 24/148 (16%) | 124/148 (84%) |
| 3 | 0/74 (0%) | 74/74 (100%) | 7/74 (9%) | 67/74 (91%) | 7/148 (5%) | 141/148 (95%) |
| 4 | 0/74 (0%) | 74/74 (100%) | 4/74 (5%) | 70/74 (95%) | 4/148 (3%) | 144/148 (97%) |
| 5 | 0/74 (0%) | 74/74 (100%) | 16/74 (22%) | 58/74 (78%) | 16/148 (11%) | 132/148 (89%) |
Posterior retinal images of both eyes of 37 premature infants were taken at first session between 31–33 weeks post-menstrual age (PMA), and at a second session between 35–37 weeks PMA. Images were interpreted by 5 experts and given a diagnosis of “plus” versus “not plus.”
Image Interpretation: Computer-Based System
All 148 images were analyzed for the 6 individual computer-based system parameters (arterial diameter, arterial tortuosity index, arterial integrated curvature, venous diameter, venous tortuosity index, and venous integrated curvature). A total of 463 arteries (mean 3.13 arteries/image) and 513 veins (mean 3.47 veins/image) were analyzed for a total of 976 analyzed vessels. This resulted in a total of 1,389 (=463×3) system responses for arteries (diameter, tortuosity index, integrated curvature), and 1,539 (=513×3) system responses for veins. Eighty-five (8.7%) of the 976 vessels could not be analyzed by the computer-based system because of inadequate image quality.
Computer-Based Plus Disease Diagnosis
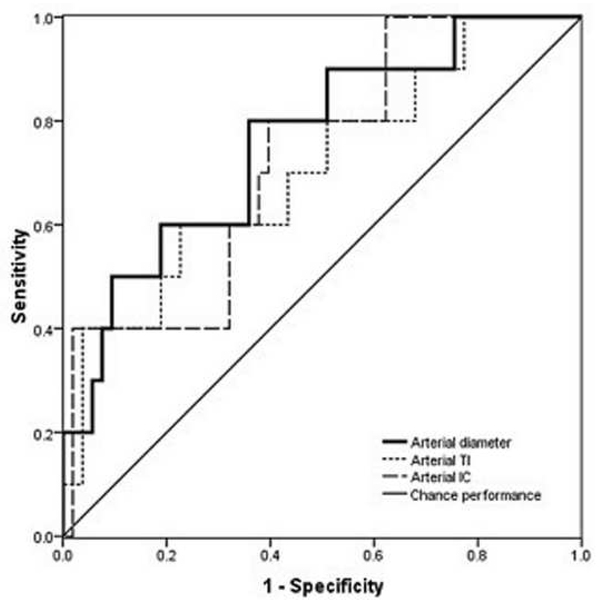
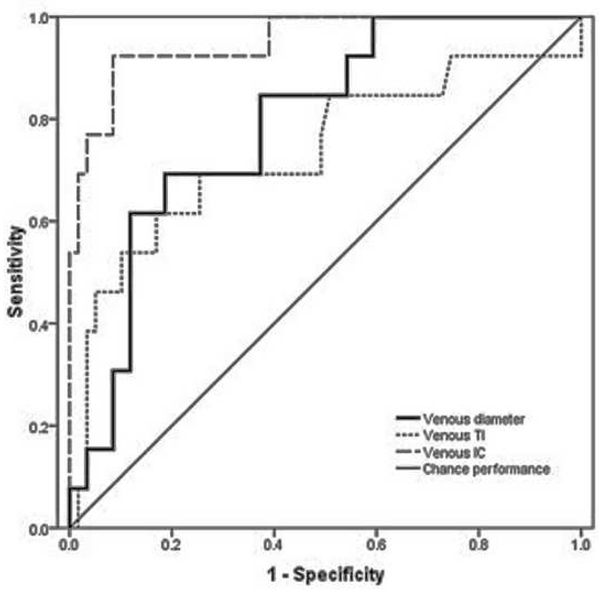
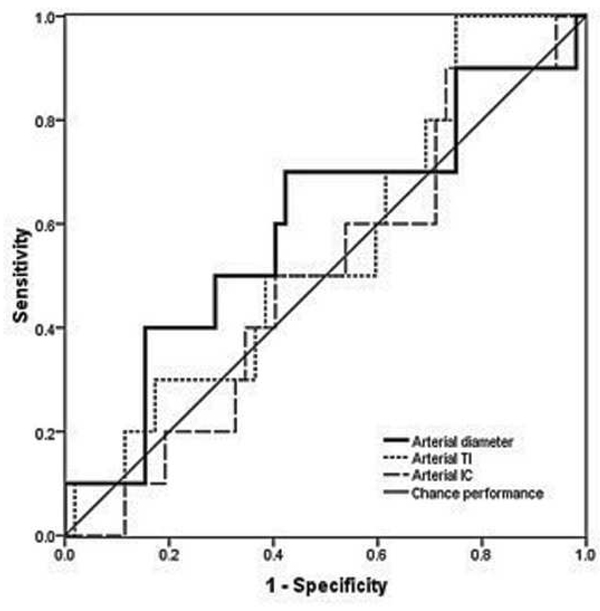
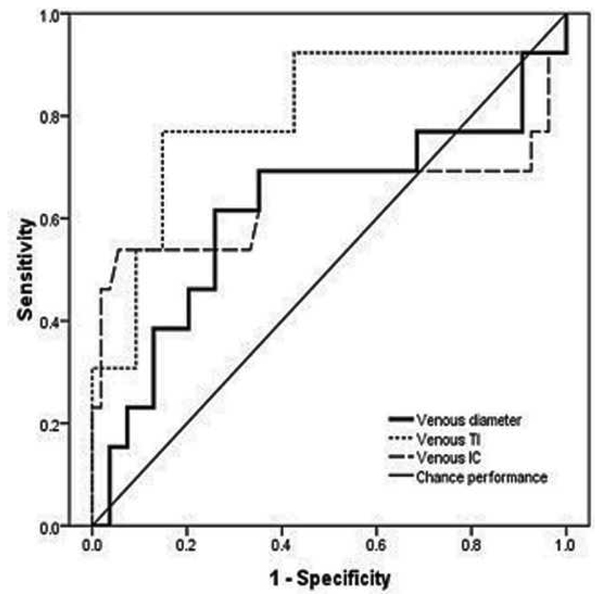
Table 2 summarizes accuracy of computer-based plus disease diagnosis using image analysis from a single session (35–37 weeks PMA), compared to the rate of vascular change between two sessions (31–33 weeks to 35–37 weeks PMA). Receiver operating characteristic curves for plus disease diagnosis using individual computer-based image parameters from a single session (35–37 weeks PMA) are displayed in Figure 1. Using data from the second session only, receiver operating characteristic AUCs for plus disease detection were statistically better than chance performance (p<0.05), for all vessel parameters except arterial diameter (p=0.08). Among individual parameters at a single session, diagnostic performance was highest for venous integrated curvature (AUC=0.952, p<0.001) and venous diameter (AUC=0.789, p=0.001).
Table 2.
Receiver operating characteristic areas under the curve (AUC) for diagnosis of plus disease using a computer-based image analysis system, using a single session (35–37 weeks post-menstrual age [PMA]) compared to the rate of change between two sessions (31–33 weeks PMA to 35–37 weeks PMA).*
| Arteries | Veins | |||||||||||
|---|---|---|---|---|---|---|---|---|---|---|---|---|
| Single session (35–37 weeks PMA) |
Highest vessel change/week |
Mean vessel change/week |
Single session (35–37 weeks PMA) |
Highest vessel change/week |
Mean vessel change/week |
|||||||
| AUC (95% CI) |
p-value | AUC (95% CI) |
p-value | AUC (95% CI) |
p-value | AUC (95% CI) |
p-value | AUC (95% CI) |
p-value | AUC (95% CI) |
p-value | |
| Diameter | 0.760 (0.599–0.922) |
N/S* | 0.610 (0.416–0.804) |
N/S* | 0.594 (0.390–0.799) |
N/S* | 0.789 (0.666–0.911) |
0.001 | 0.712 (0.512–0.912) |
0.018 | 0.617 (0.419–0.815) |
N/S* |
| TI | 0.708 (0.599–0.922) |
0.039 | 0.580 (0.395–0.765) |
N/S* | 0.554 (0.370–0.738) |
N/S* | 0.734 (0.559–0.909) |
0.009 | 0.819 (0.668–0.970) |
<0.001 | 0.802 (0.646–0.958) |
0.001 |
| IC | 0.726 (0.564–0.889) |
0.024 | 0.530 (0.345–0.715) |
N/S* | 0.498 (0.316–0.680) |
N/S* | 0.952 (0.890–1.013) |
<0.001 | 0.697 (0.489–0.905) |
0.029 | 0.642 (0.412–0.873) |
N/S* |
Wide-angle posterior retinal images were captured bilaterally from 37 infants at two sessions, and computer-based system parameters (diameter, tortuosity index [TI] and integrated curvature [IC]) were calculated from arteries and veins separately. Rate of vascular change between the two sessions was calculated in two ways: (1) change per week in the single vessel in each eye found to have undergone highest change between sessions (“highest vessel change/week”) and (2) as mean change per week in all vessels present in images from both sessions (“mean vessel change/week”).
N/S, not statistically-significant.
Figure 1.
Receiver operating characteristic (ROC) curves for detection of plus disease, in infants at risk for retinopathy of prematurity, using a computer-based image analysis system to analyze arteries (left) and veins (right) during a single session at 35–37 weeks post-menstrual age.*
*For each system parameter (diameter, tortuosity index [TI], integrated curvature [IC]), sensitivity is plotted against (1-specificity) over a range of cutoff values separating “plus” from “not plus.” Diagonal line represents chance performance (area under curve = 0.5).
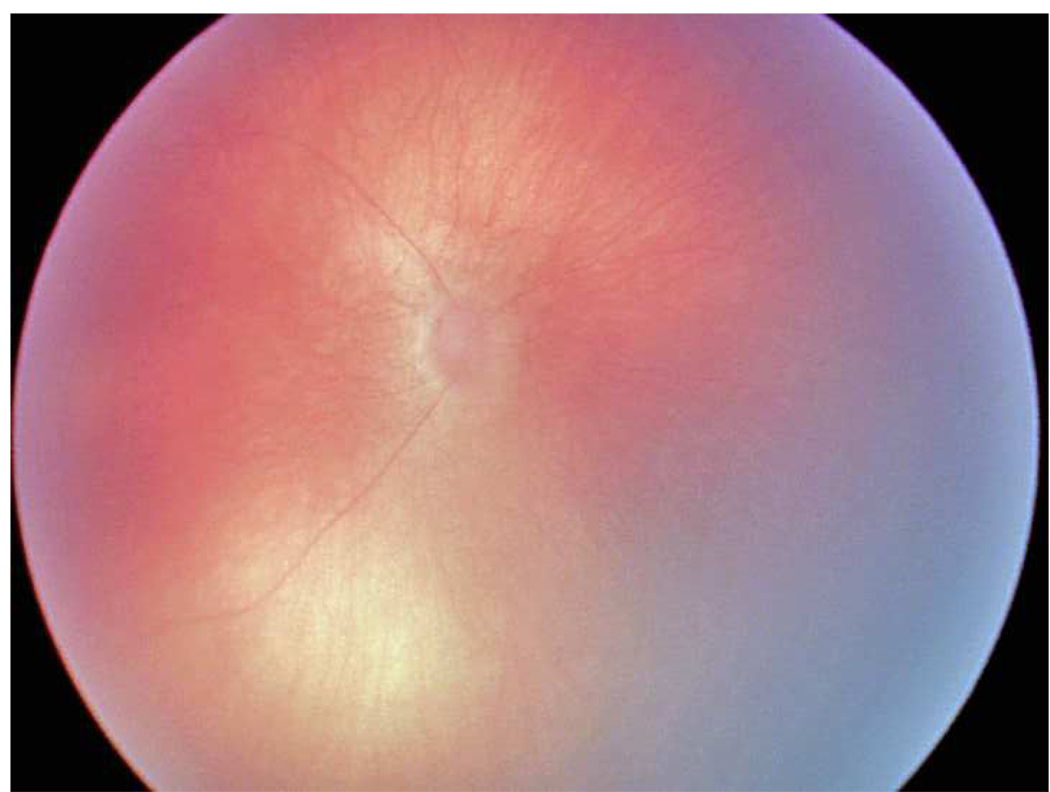
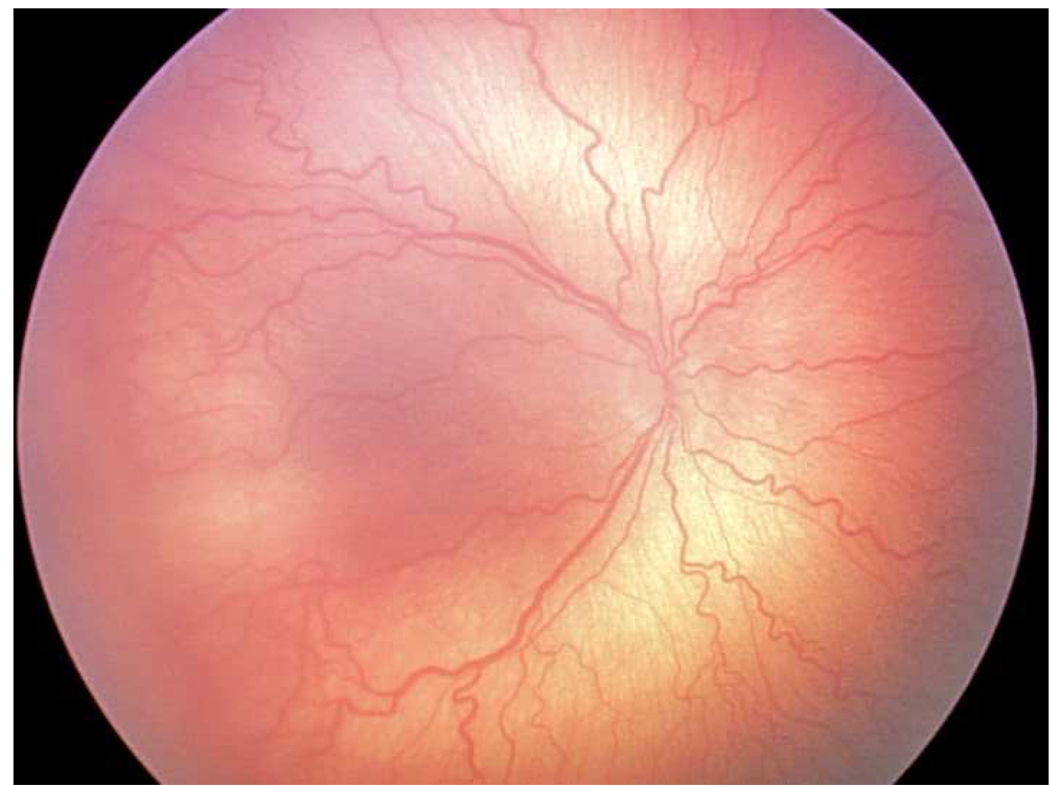
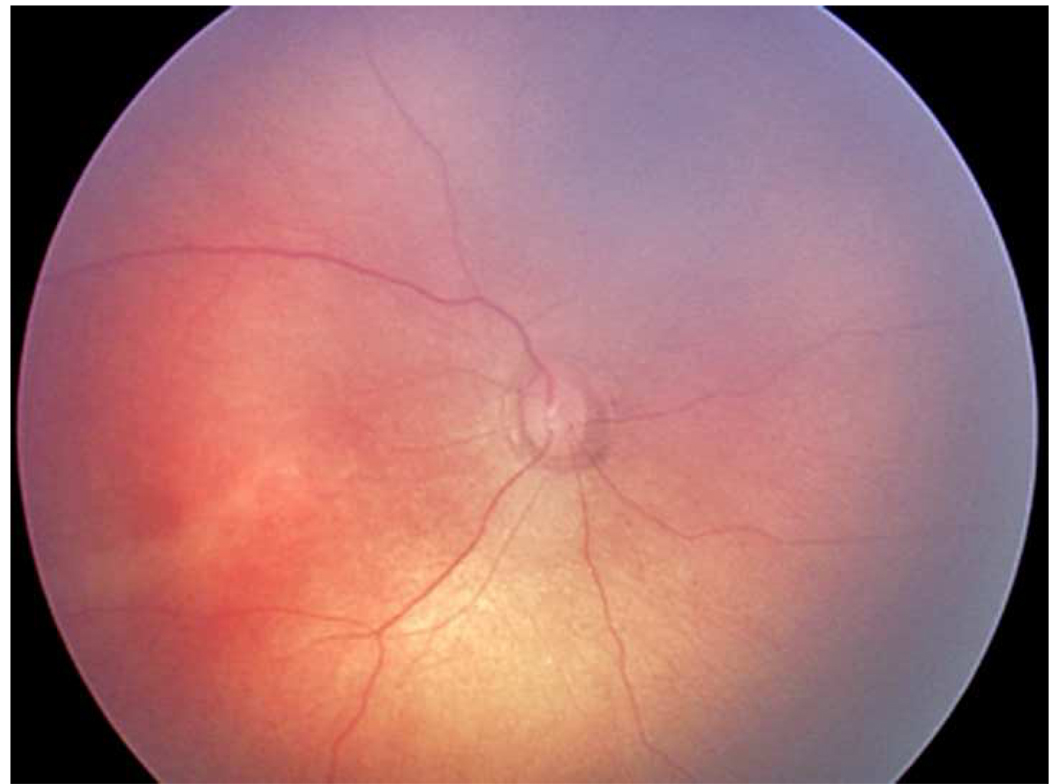
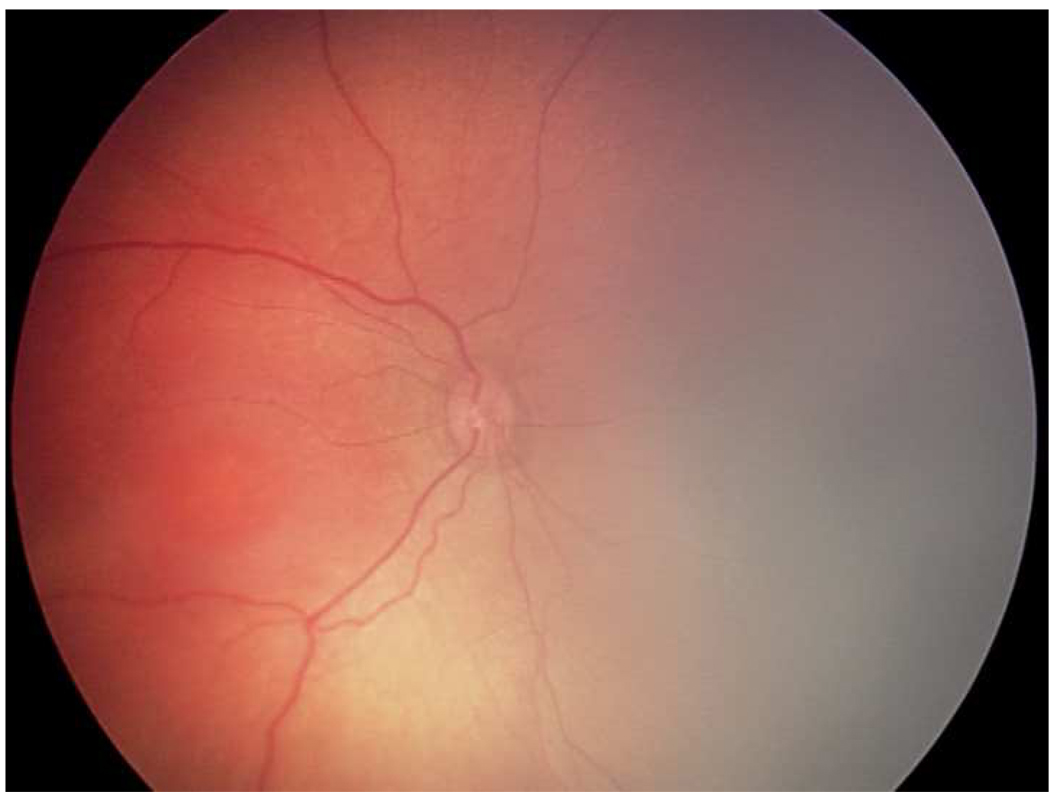
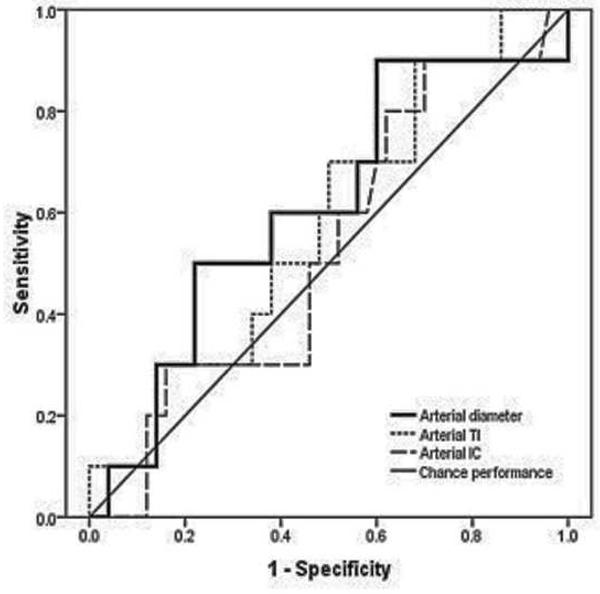
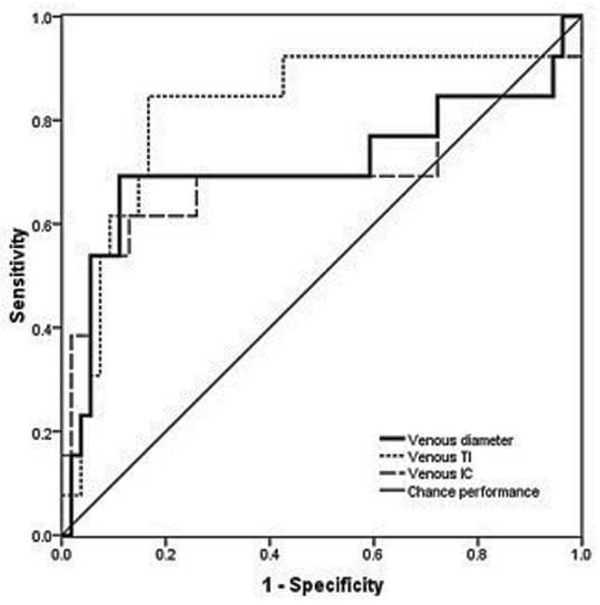
Examples of images showing different rates of vascular change are shown in Figure 2. Receiver operating characteristic curves for plus disease diagnosis based on rate of vascular change between the two sessions (31–33 weeks to 35–37 weeks PMA) are displayed in Figure 3 using the single vessel in each eye found to undergo greatest change between the two sessions. Using this method for analysis of rate of vascular change, diagnostic performance was highest for venous tortuosity index (AUC=0.819, p=0.000376) and venous diameter (AUC=0.712, p=0.018). Receiver operating characteristic curves for plus disease diagnosis based on the rate of vascular change between the two sessions are displayed in Figure 4 using the mean rate of change among all vessels present in images at both sessions for each eye. Using this method for analysis of rate of vascular change, diagnostic performance was statistically better than chance performance only for venous tortuosity index (AUC=0.802, p=0.001).
Figure 2.
Representative images showing different rates of vascular change in two infants screened for retinopathy of prematurity. *
*First infant had greater weekly change in venous tortuosity index (TI, 0.1063 pixels/week) and venous integrated curvature (IC, 0.0052 pixels/week) from 31 weeks post-menstrual age (PMA) (top left) to 35 weeks PMA (top right), and was clinically diagnosed as “plus” at 35 weeks PMA. Second infant had less weekly change in venous TI (0.0015 pixels/week) and venous IC (0.0002 pixels/week) from 32 weeks PMA (bottom left) to 36 weeks PMA (bottom right), and was clinically diagnosed as “not plus” at 36 weeks PMA.
Figure 3.
Receiver operating characteristic curves for detection of plus disease, in infants at risk for retinopathy of prematurity, using a computer-based system to analyze rate of change in vascular parameters of arteries (left) and veins (below) between a first session at 31–33 weeks post-menstrual age (right) and a second session at 35–37 weeks post-menstrual age. *
*Rate of change in vascular parameters (diameter, integrated curvature [IC], tortuosity index [TI]) is computed as change per week in the single vessel in each eye found to have undergone highest change for each parameter between sessions. Sensitivity is plotted against (1-specificity) over a range of cutoff values separating “plus” from “not plus.” Diagonal line represents chance performance (area under curve = 0.5).
Figure 4.
Receiver operating characteristic curves for detection of plus disease, in infants at risk for retinopathy of prematurity, using a computer-based system to analyze rate of change in vascular parameters of arteries (left) and veins (right) between a first session at 31–33 weeks post-menstrual age (PMA) and a second session at 35–37 weeks PMA. *
*Rate of change in vascular parameters (diameter, tortuosity index [TI], integrated curvature [IC]) is computed as mean change per week in all vessels present in images from both sessions. Sensitivity is plotted against (1-specificity) over a range of cutoff values separating “plus” from “not plus.” Diagonal line represents chance performance (area under curve = 0.5).
DISCUSSION
This study was designed to assess the accuracy of computer-based diagnosis of plus disease using quantitative vascular parameters computed at a single session (35–37 weeks PMA), compared to the rate of vascular change between two sessions (31–33 weeks to 35–37 weeks PMA). The key findings were that: (1) Computer-based image analysis has potential to diagnose plus disease based on individual vascular features, and (2) Analyzing rate of change in vascular parameters between these two sessions has potential to identify plus disease, although this did not appear to contribute information beyond analysis of a single session.
Our findings are consistent with earlier work suggesting that computer-based image analysis can identify plus disease based on quantitative vascular features.9–12,14,16,23–26 In this study, all vascular parameters except for arterial diameter were significantly different in images with plus disease by expert consensus compared to images without plus disease. Using the 35–37 week PMA image only, diagnostic accuracy was highest for venular IC (AUC=0.952) and diameter (AUC=0.789). One earlier study using the same computer-based system as the current study found that, for both arteries and veins, all three system parameters were significantly larger in eyes with plus disease than those with no plus disease.24 In that earlier study, integrated curvature had highest accuracy for diagnosis (AUC=0.911 for arteries, 0.824 for veins). Another study using this same computer-based image analysis system found that arterial tortuosity index (but not arterial or venous diameter) was significant higher in images with ROP than in images without ROP.16 Finally, a study involving a different computer-based system found that images with plus disease had greater average tortuosity and dilation than images without plus disease, but that this difference was statistically-significant only for tortuosity.25
The current study also shows that weekly rate of change in venular parameters was significantly different for eyes which developed plus disease compared to those which did not. AUC for plus disease detection was highest for weekly rate of change of venular tortuosity index (0.819) and diameter (0.712) (Table 2 and Figure 3). This suggests that rate of change in venular parameters is correlated with plus disease development, and that analysis of change in vascular parameters between examination sessions has potential to identify plus disease. However, the AUC for rate of change in vascular parameters was not higher than that for the value of vascular parameters at the second examination session (35–37 weeks PMA) alone, indicating that this did not appear to contribute information beyond analysis of a single image at 35–37 weeks PMA.
Previous research has suggested the potential utility of analyzing the rate of vascular change for identifying severe ROP. Data from the CRYO-ROP study regarding the natural course of disease showed that faster rate of progression to prethreshold disease was associated with worse structural outcomes.15 Wallace et al found faster rate of disease progression in infants who had early vascular changes designated “pre-plus disease,” which indicated a greater likelihood of development of severe ROP.13 Henegan et al found absolute change in vascular diameter, but not tortuosity, to be correlated with clinical diagnosis of plus disease.12 The latter study differed from our current study in that it examined average change in vascular parameters for all vessels, rather than only those vessels present in both images, and in that it did not differentiate between arteries and veins. In this study, we show that change in a greater number of vascular parameters over time is significantly correlated with diagnosis of plus disease. Having said that, we emphasize that plus disease is currently defined by comparison to a standard photograph at a single point in time, and this study did not provide evidence that rate of change in vessel parameters is better at identifying plus disease.
Faster rate of anatomic change has been found useful for guiding treatment in other ophthalmologic diseases and in other fields of medicine. Several glaucoma staging systems allow for measurement of quantitative change in optic disc parameters,27 and faster rate of change in cup-to-disc ratio has been correlated with higher average intraocular pressure.28 In cardiology, one study showed that side-by-side interpretation of echocardiograms, which allow for quantified analysis of parameter change, had higher specificity than interpretation of independent echocardiograms for identifying change in valve regurgitation.29 Another study found that the increase in QRS duration over time was a better predictor of adverse cardiac outcome than a single measurement of QRS duration.30 For ROP, future studies involving the predictive value for rate of vascular change to identify risk of poor outcomes, compared to traditional methods based on findings at individual exams, may be warranted.
A key limitation of this study is that the reference standard was considered to be presence of plus disease at single points in time (either 31–33 weeks or 35–37 weeks PMA). This was done because the current definition of plus disease is based on individual ophthalmoscopic examinations, without regard to temporal progression. Previous studies involving computer-based plus disease diagnosis have used similar reference standards for comparison.10,11,13,25,26,31 Because our reference standard was obtained during a static examination, this study design may significantly bias toward showing that computer-based analysis at single points in time perform better than analysis of rates of vascular change for plus disease diagnosis. Larger studies, in which experts and automated image analysis systems are asked to review serial images and provide overall diagnostic impressions regarding disease progression and prognosis, would produce additional insights. We suspect that important information would be gained by considering the temporal progression of vascular change in ROP, and previous work has suggested that video documentation of retinal vascular evolution may contribute diagnostic and educational value.31 If baseline rates of vascular development can be characterized in normal premature infants, then future ROP classification systems might incorporate these data so that abnormal rates of change could be detected using computer-based methods.
Additional study limitations should be noted: (1) There was variation in quality among study images. This may have affected quantitative measurements of dilation and tortuosity, particularly if vessel margins were indistinct because of blurring. Among all study images, 13.6% of arteries were of insufficient quality to be analyzed by the computer-based system, whereas only 4.3% of veins could not be analyzed. It is possible that this may have introduced a systematic bias which led to rate of change in arterial parameters being less associated with plus disease than rate of change in venous parameters (Table 2). However, because rates of vascular change were always calculated within the same patients, other possible confounding factors such as image magnification would be expected to remain consistent. (2) Because the first imaging session was between 31–33 weeks PMA and the second was between 35–37 weeks PMA, the number of weeks between examination sessions was not consistent. Although this was addressed by calculating the rates of change per week, understanding the precise time course of vascular evolution in ROP may require further research. (3) Only 8.8% of study images had a reference standard diagnosis of “plus disease” based on expert consensus. Therefore, future studies examining a larger number of eyes with plus disease will have greater power for examining the rate of vascular change on clinical plus disease diagnosis.
In summary, computer-based image analysis has potential to identify plus disease based on individual vascular features. Analysis of temporal change in vascular parameters has potential to provide information regarding plus disease diagnosis beyond what is available during a single examination. Because retinal vessels in ROP evolve significantly within a short time, future research may be warranted to examine the role for creating new indices for disease classification based on rate of vascular change. Disease classification incorporating quantifiable measures such as rate of change may help to decrease subjectivity in plus disease diagnosis.
ACKNOWLEDGEMENTS
(a) Funding/Support: Research to Prevent Blindness (New York, NY) and grant EY13972 from the National Institutes of Health (Bethesda, MD) (MFC).
Biographies
Preeti Thyparampil is a graduate of the Columbia University College of Physicians and Surgeons, Class of 2010. Preeti grew up Queens, New York, and earned a BA in Biology and Psychology from New York University in 2005. She will be a resident in ophthalmology at The Cullen Eye Institute, Baylor College of Medicine in Houston, Texas.

Michael F. Chiang is an Associate Professor of Ophthalmology and Biomedical Informatics at Columbia University. His research involves telemedicine, image analysis, and electronic health record systems. Dr. Chiang received a B.S. in Electrical Engineering and Biology from Stanford University, an M.D. from Harvard Medical School and Harvard-MIT Division of Health Sciences and Technology, and an M.A. in Biomedical Informatics from Columbia University. He completed residency and pediatric ophthalmology fellowship training at the Johns Hopkins Wilmer Eye Institute.

Footnotes
Publisher's Disclaimer: This is a PDF file of an unedited manuscript that has been accepted for publication. As a service to our customers we are providing this early version of the manuscript. The manuscript will undergo copyediting, typesetting, and review of the resulting proof before it is published in its final citable form. Please note that during the production process errors may be discovered which could affect the content, and all legal disclaimers that apply to the journal pertain.
(b) Financial disclosures: MFC is an unpaid member of the Scientific Advisory Board of Clarity Medical Systems (Pleasanton, CA).
- Design and conduct of the study (PJT, YP, JTF, MFC)
- Collection, management, analysis, and interpretation of data (PJT, YP, MEM, TCL, DJW, AMB, RVPC, JTF, MFC)
- Preparation, review, or approval of the manuscript (PJT, YP, MEM, TCL, DJW, AMB, RVPC, JTF, MFC)
(d) Statement about conformity with author information: This study was approved by the Institutional Review Board at Columbia University Medical Center. Written informed consent was obtained from all expert study participants prior to participation, and waiver of consent was obtained for use of de-identified retinal images. This study was conducted in accordance with Health Insurance Portability and Accountability Act (HIPAA) guidelines.
REFERENCES
- 1.Steinkuller PG, Du L, Gilbert C, Foster A, Collins ML. Childhood blindness. J AAPOS. 1999;3(1):26–32. doi: 10.1016/s1091-8531(99)70091-1. [DOI] [PubMed] [Google Scholar]
- 2.Cryotherapy for Retinopathy of Prematurity Cooperative Group. Multicenter trial of cryotherapy for retinopathy of prematurity: preliminary results. Arch Ophthalmol. 1988;106(4):471–479. doi: 10.1001/archopht.1988.01060130517027. [DOI] [PubMed] [Google Scholar]
- 3.Early Treatment for Retinopathy of Prematurity Cooperative Group. Revised indications for the treatment of retinopathy of prematurity: results of the Early Treatment for Retinopathy of Prematurity randomized trial. Arch Ophthalmol. 2003;121(12):1684–1694. doi: 10.1001/archopht.121.12.1684. [DOI] [PubMed] [Google Scholar]
- 4.Section on Ophthalmology American Academy of Pediatrics, American Academy of Ophthalmology, American Association for Pediatric Ophthalmology and Strabismus. Screening examination of premature infants for retinopathy of prematurity. Pediatrics. 2006;117(2):572–576. doi: 10.1542/peds.2005-2749. [DOI] [PubMed] [Google Scholar]
- 5.Committee for the Classification of Retinopathy of Prematurity. An international classification of retinopathy of prematurity. Arch Ophthalmol. 1984;102(8):1130–1134. doi: 10.1001/archopht.1984.01040030908011. [DOI] [PubMed] [Google Scholar]
- 6.International Committee for the Classification of Retinopathy of Prematurity. The International Classification of Retinopathy of Prematurity revisited. Arch Ophthalmol. 2005;123(7):991–999. doi: 10.1001/archopht.123.7.991. [DOI] [PubMed] [Google Scholar]
- 7.Chiang MF, Jiang L, Gelman R, Du YE, Flynn JT. Interexpert agreement of plus disease diagnosis in retinopathy of prematurity. Arch Ophthalmol. 2007;125(7):875–880. doi: 10.1001/archopht.125.7.875. [DOI] [PubMed] [Google Scholar]
- 8.Reynolds JD, Dobson V, Quinn GE, et al. Evidence-based screening criteria for retinopathy of prematurity: natural history data from the CRYO-ROP and LIGHT-ROP studies. Arch Ophthalmol. 2002;120(11):1470–1476. doi: 10.1001/archopht.120.11.1470. [DOI] [PubMed] [Google Scholar]
- 9.Wallace DK, Quinn GE, Freedman SF, Chiang MF. Agreement among pediatric ophthalmologists in diagnosing plus and pre-plus disease in retinopathy of prematurity. J AAPOS. 2008;12(4):352–356. doi: 10.1016/j.jaapos.2007.11.022. [DOI] [PMC free article] [PubMed] [Google Scholar]
- 10.Gelman R, Jiang L, Du YE, Martinez-Perez ME, Flynn JT, Chiang MF. Plus disease in retinopathy of prematurity: pilot study of computer-based and expert diagnosis. J AAPOS. 2007;11(6):532–540. doi: 10.1016/j.jaapos.2007.09.005. [DOI] [PMC free article] [PubMed] [Google Scholar]
- 11.Koreen S, Gelman R, Martinez-Perez ME, et al. Evaluation of a computer-based system for plus disease diagnosis in retinopathy of prematurity. Ophthalmology. 2007;114(12):e59–e67. doi: 10.1016/j.ophtha.2007.10.006. [DOI] [PubMed] [Google Scholar]
- 12.Heneghan C, Flynn J, O'Keefe M, Cahill M. Characterization of changes in blood vessel width and tortuosity in retinopathy of prematurity using image analysis. Med Image Anal. 2002;6(4):407–429. doi: 10.1016/s1361-8415(02)00058-0. [DOI] [PubMed] [Google Scholar]
- 13.Wallace DK, Kylstra JA, Chesnutt DA. Prognostic significance of vascular dilation and tortuosity insufficient for plus disease in retinopathy of prematurity. J AAPOS. 2000;4(4):224–224. doi: 10.1067/mpa.2000.105273. [DOI] [PubMed] [Google Scholar]
- 14.Wallace DK. Computer-assisted quantification of vascular tortuosity in retinopathy of prematurity (an American Ophthalmological Society thesis) Trans Am Ophthalmol Soc. 2007;105:594–615. [PMC free article] [PubMed] [Google Scholar]
- 15.Schaffer DB, Palmer EA, Plotsky DF, et al. The Cryotherapy for Retinopathy of Prematurity Cooperative Group. Prognostic factors in the natural course of retinopathy of prematurity. Ophthalmology. 1993;100(2):230–237. doi: 10.1016/s0161-6420(93)31665-9. [DOI] [PubMed] [Google Scholar]
- 16.Swanson C, Cocker KD, Parker KH, Moseley MJ, Fielder AR. Semiautomated computer analysis of vessel growth in preterm infants without and with ROP. Br J Ophthalmol. 2003;87(12):1474–1477. doi: 10.1136/bjo.87.12.1474. [DOI] [PMC free article] [PubMed] [Google Scholar]
- 17.Grunwald L, Mills MD, Johnson KS, et al. The rate of retinal vessel dilation in severe retinopathy of prematurity requiring treatment. Am J Ophthalmol. 2009;147(6):1086–1091. doi: 10.1016/j.ajo.2008.12.038. [DOI] [PubMed] [Google Scholar]
- 18.Martinez-Perez ME, Hughes AD, Stanton AV, et al. Retinal vascular tree morphology: A Semi-automatic Quantification. IEEE Trans Biomed Eng. 2002;49(8):912–917. doi: 10.1109/TBME.2002.800789. [DOI] [PubMed] [Google Scholar]
- 19.Martinez-Perez ME, Hughes AD, Thom SA, Bharath AA, Parker KH. Segmentation of blood vessels from red-free and fluorescein retinal images. Med Image Anal. 2007;11(1):47–61. doi: 10.1016/j.media.2006.11.004. [DOI] [PubMed] [Google Scholar]
- 20.Lasko TA, Bhagwat JG, Zou KH, Ohno-Machado L. The use of receiver operating characteristic curves in biomedical informatics. J Biomed Inform. 2005;38(5):404–415. doi: 10.1016/j.jbi.2005.02.008. [DOI] [PubMed] [Google Scholar]
- 21.Chiang MF, Starren J, Du YE, et al. Remote image based retinopathy of prematurity diagnosis: a receiver operating characteristic analysis of accuracy. Br J Ophthalmology. 2006;90(10):1292–1296. doi: 10.1136/bjo.2006.091900. [DOI] [PMC free article] [PubMed] [Google Scholar]
- 22.Zweig MH, Campbell G. Receiver-operating characteristic (ROC) plots: a fundamental evaluation tool in clinical medicine. Clin Chem. 1993;39(4):561–577. [PubMed] [Google Scholar]
- 23.Wilson CM, Cocker KD, Moseley MJ, et al. Computerized analysis of retinal vessel width and tortuosity in premature infants. Invest Ophthalmol Vis Sci. 2008;49(8):3577–3585. doi: 10.1167/iovs.07-1353. [DOI] [PubMed] [Google Scholar]
- 24.Gelman R, Martinez-Perez ME, Vanderveen DK, Moskowitz A, Fulton AB. Diagnosis of plus disease in retinopathy of prematurity using Retinal Image multiScale Analysis. Invest Ophthalmol Vis Sci. 2005;46(12):4734–4738. doi: 10.1167/iovs.05-0646. [DOI] [PMC free article] [PubMed] [Google Scholar]
- 25.Wallace DK, Jomier J, Aylward SR, Landers MB., 3rd Computer-automated quantification of plus disease in retinopathy of prematurity. J AAPOS. 2003;7(2):126–130. doi: 10.1016/mpa.2003.S1091853102000150. [DOI] [PubMed] [Google Scholar]
- 26.Wallace DK, Zhao Z, Freedman SF. A pilot study using “ROPtool” to quantify plus disease in retinopathy of prematurity. J AAPOS. 2007;11(4):381–387. doi: 10.1016/j.jaapos.2007.04.008. [DOI] [PubMed] [Google Scholar]
- 27.Spaeth GL, Lopes JF, Junk AK, Grigorian AP, Henderer J. Systems for staging the amount of optic nerve damage in glaucoma: a critical review and new material. Surv Opthalmol. 2006;51(4):293–315. doi: 10.1016/j.survophthal.2006.04.008. [DOI] [PubMed] [Google Scholar]
- 28.Kwon YH, Kim YI, Pereira ML, Montague PR, Zimmerman MB, Alward WL. Rate of optic disc cup progression in treated primary open-angle glaucoma. J Glaucoma. 2003;12(5):409–416. doi: 10.1097/00061198-200310000-00003. [DOI] [PubMed] [Google Scholar]
- 29.Weissman NJ, Panza JA, Tighe JF, Jr, Perras ST, Kushner H, Gottdiener JS. Specificity of Doppler echocardiography for the assessment of changes in valvular regurgitation: comparison of side-by-side versus serial interpretation. J Am Coll Cardiol. 2001;37(6):1614–1621. doi: 10.1016/s0735-1097(01)01222-0. [DOI] [PubMed] [Google Scholar]
- 30.Shamim W, Yousufuddin M, Cicoria M, Gibson DG, Coats AJ, Henein MY. Incremental changes in QRS duration in serial ECGs over time identify high risk elderly patients with heart failure. Heart. 2002;88(1):47–51. doi: 10.1136/heart.88.1.47. [DOI] [PMC free article] [PubMed] [Google Scholar]
- 31.MacKeen L, Ells A. Dynamic documentation of the evolution of retinopathy of prematurity in video format. J AAPOS. 2008;12(4):349–351. doi: 10.1016/j.jaapos.2008.02.006. [DOI] [PubMed] [Google Scholar]


