

Abstract
Sprouty negatively regulates receptor tyrosine kinase signals by inhibiting Ras/ERK pathways. Sprouty is down-regulated in breast, prostate and liver cancers and appears to function as a tumor suppressor. The role of Sprouty in colonic neoplasia, however, has not been investigated. Sprouty-2 protein and mRNA transcripts were significantly up-regulated in human colonic adenocarcinomas. Strikingly, the c-Met receptor was also upregulated in tumors with increased sprouty-2. To delineate a potential causal relationship between sprouty-2 and c-Met, K-ras mutant HCT-116 colon cancer cells were transduced with purified TAT-sprouty-2 protein or stably transfected with full-length human sprouty-2 gene. Sprouty-2 up-regulation significantly increased cell proliferation by accelerating cell cycle transition. Sprouty-2 transfectants demonstrated strong up-regulation of c-Met protein and mRNA transcripts and hepatocyte growth factor stimulated ERK and Akt phosphorylation and enhanced cell migration and invasion. In contrast, knockdown of c-Met by siRNA significantly decreased cell proliferation, migration and invasion in sprouty-2 transfectants. Further, knockdown of sprouty-2 by siRNA in parental HT-29 and LS-174T colon cancer cells also decreased cell invasion. Sprouty-2 transfectants formed significantly larger tumor xenografts and demonstrated increased proliferation and angiogenesis and suppressed apoptosis. Sprouty-2 tumors metastasized to liver from cecal orthotopic implants suggesting sprouty-2 might also enhance metastatic signals. Thus in colon cancer sprouty functions as an oncogene and its effects are mediated in part by c-Met up-regulation.
Keywords: Sprouty-2, Colon, Cancer, Metastasis, Ras, c-Met
Introduction
To date, four mammalian sprouty proteins (Sprouty 1–4) have been identified (Hacohen et al., 1998). Sprouty-2 is ubiquitously expressed, whereas the expression of other sprouty isoforms is organ- and tissue-specific (Su et al., 2002). Mitogen-activated protein kinase (MAPK) signals from several receptor tyrosine kinases (RTKs) are inhibited by sprouty, including fibroblast growth factor (FGF), vascular endothelial growth factor (VEGF), platelet-derived growth factor (PDGF) and stem cell factor/kit ligand (SCF) (Cabrita & Christofori, 2008; Guy et al., 2003; Kim & Bar-Sagi, 2004). The inhibitory targets of sprouty, however, remain controversial as sprouty may function upstream of Ras or down-stream at the level of Raf (Gross et al., 2001; Hanafusa et al., 2002; Lee, 2006; Sasaki et al., 2003). Understanding the molecular mechanisms mediating sprouty function is further complicated by the observation that sproutys do not always inhibit MAPK activation. For example, sprouty-1 and -2 not only failed to suppress EGF induced MAPK activation in endothelial cells, HEK293, CHO and HeLa cells but surprisingly enhanced activation of this pathway in these cells (Lim et al., 2002; Rubin et al., 2003; Wong et al., 2001). Thus, sproutys appear capable of up- or down-regulating MAPK signals depending on ligand, RTK and the cell-context involved.
The expression of sprouty proteins is altered in a number of cancers. Recent reports indicated down-regulation of sprouty isoforms in breast, prostate, lung and liver cancer. The genomic localization of sprouty-2 adjacent to a large CpG island led to the hypothesis that aberrant hypermethylation of this region might suppress sprouty-2 transcription in breast cancer (Lo et al., 2004). Two studies demonstrated down-regulation of sprouty-1 and -2 in prostate cancer (Kwabi-Addo et al., 2004; McKie et al., 2005), while another reported down-regulation of sprouty-2 in liver cancer (Fong et al., 2006). Similarly, in non-small cell lung cancer (NSCLC), down-regulated sprouty-2 increased proliferation of K-ras mutant NSCLC cells (Sutterluty et al., 2007). Consistent with these findings, over-expression of sprouty-2 in lung epithelial cells inhibited urethane-induced lung tumorigenesis, supporting a tumor suppressor role for sprouty-2 (Minowada & Miller, 2009). In contrast to these reports, sprouty can also facilitate tumor formation. In this regard, silencing sprouty-2 in H-ras v12-transformed fibroblast inhibited tumor formation in nude mice and colony formation in agarose (Lito et al., 2008). These growth effects were only observed in Ras-transformed cells. Sprouty-2 over-expression was also reported in melanomas with mutant B-raf and N-ras (Bloethner et al., 2005).
The role of sprouty-2 has not been investigated in human colon cancer. In the current report we demonstrate that sprouty-2 is up-regulated in human colon adenocarcinomas. Activating K-ras mutations occur frequently in colon cancers that could theoretically block sprouty inhibition of Ras signals. To test this hypothesis, a K-ras mutant HCT-116 human colon cancer cell line exhibiting minimal levels of sprouty-2 was transduced with purified TAT-sprouty-2 protein or stably transfected with an expression plasmid encoding the full-length protein sequence of the human sprouty-2 gene. Our studies indicate that sprouty-2 up-regulation induces c-Met expression. Furthermore, sprouty-2 up-regulation enhances the transformed phenotype as assessed by increased cell proliferation, cell migration and invasion in colon cancer cells. Underscoring the biological relevance of these observations, we found that sprouty-2 transfectants when injected in nude mice produced significantly larger tumors. An orthotopic cecal model of liver metastasis suggested that sprouty-2 up-regulation also enhanced competence for liver metastasis. To our knowledge, this is the first report to show sprouty-2 over-expression in human colon cancers and to demonstrate an enhanced cancer phenotype of K-ras mutated colon cancer cells.
Materials and Methods
Human Colonic Tumors
The study was approved by the University of Chicago Hospitals Institutional Review Board for human investigations. Specimens included colon cancer samples and paired adjacent normal appearing colonic mucosa. Tumors were divided and a portion fixed in 10% buffered formalin for histological classification. Another fraction was flash frozen in liquid nitrogen and stored at −80°C until analysis. Tumor histology was graded by an expert gastrointestinal pathologist (Dr. John Hart, University of Chicago, Chicago, IL). For Western blotting experiments, frozen tissues were homogenized with a Polytron. Tissues were then sonicated and proteins solubilized in SDS-Laemmli buffer.
Plasmid Constructs and TAT proteins
Full-length human sprouty-2 cDNA was subcloned into the Kpn1/EcoR1 sites of HA-tag-encoded mammalian expression vector pHM6 (Roche Molecular Biochemicals) as described (Yigzaw et al., 2001). TAT-GFP and TAT-HA-humansprouty-2 purified proteins were prepared as described earlier (Edwin et al., 2006). The TAT-HA tag includes an N-terminal hexahistidyl leader followed by the 11-amino acid TAT protein transduction domain (YGRKKRRQRRR) and an HA tag (YPYDVPDYA). The TAT-HA bacterial expression vector and purification of TAT-GFP and TAT-HA-sprouty-2 proteins were described previously (Yigzaw et al., 2001).
Cell Culture
Human HCT-116 colon cancer cells were obtained from ATCC and grown in DMEM (Mediatech) supplemented with 10% fetal bovine serum (Hyclone) and penicillin-streptomycin mixture (Mediatech). HCT-116 cells express mutant K-ras, but low levels of sprouty-2 compared to other colon cancer cell lines (data not shown).
Selection of Stable Clones
HCT-116 cells (100,000 cells/well, 6 well plate) were plated in McCoy’s 5A medium containing 10% serum. The following day, cells were transfected with plasmid construct encoding HA-humansprouty-2 or vector alone using the Effectene transfection reagent (Qiagen). Twenty-four hr later, media was supplemented with the antibiotic Geneticin (G418) (Mediatech) at 800 μg/ml. Individual G418-resistant clones were isolated and expanded and maintained in 800 μg/ml G418. Expression of HA-humansprouty-2 was confirmed by Western blotting.
Western blotting
Cells were homogenized in Laemmli buffer and proteins quantified by BioRad RC-DC assay. Proteins were separated by SDS-PAGE and blots were incubated overnight at 4°C with specific primary antibodies, including β-actin (1:10000, Sigma), phospho-ERK1,2 (1:2500, Santa Cruz), phospho-AKT-ser473 (1:2000, Cell Signaling), total ERK (1:3000, Cell Signaling), total AKT (1:3000, Cell Signaling), Sprouty-2 (1:3000, Sigma), c-Met (1:1000, Santa Cruz), Cox-2 (1:1000, Cayman Chemical), Cyclin D1 (1:10000, Santa Cruz), and HA-tag (1:5000, Cell Signaling) followed by 1 hr incubation with appropriate peroxidase-coupled secondary antibodies (Santa Cruz) and detection with enhanced chemiluminescence (Pierce). Xerograms were digitized by Epson Expression 1680 flat bed scanner and captured in Adobe Photoshop. Band densitometry was quantified using IP Lab Gel software from Scanalytics (Rockville, MD) running on a G4 Apple Macintosh computer. Western blotting band intensities were expressed in arbitrary units and normalized to fold-increases compared to control.
Sprouty-2 and c-Met Knockdown with SiRNA
siRNA transfections were done as recommended by the manufacturer (Santa Cruz). Cells were plated (200,000 cells/well, 6 well plate) in 10% serum overnight and transfected with 60pmole control siRNA (an irrelevant control sequence, sc-37007) or sprouty-2 siRNA (sc-41037) or c-met siRNA (sc-29397) for 6 hr. Cells were allowed to grow for 48 hrs and lysates were tested by Western blotting.
Cell Proliferation
For Wst-1 and BrdU assays, cells were plated in 10% serum containing media in ninety-six well plates (10,000 cells/well). Cell growth was assessed by Wst-1 cell proliferation assay kit (Cayman Chemical) and ELISA for BrdU incorporation into cellular DNA by a labeling and detection kit (Roche). Further, cells were also plated in six well plates (100,000 cells/well) for indicated times, trypsinized and counted using a coulter counter.
Real-time PCR
RNA samples were tested by Agilent chip for RNA purity and quantified by RiboGreen. RNA (100 ng) was reverse transcribed into cDNA using SuperScript III Platinum Two-Step qRT-PCR kit (Invitrogen) as described earlier (Dougherty et al., 2009). The resulting first-strand cDNA was used as template for quantitative PCR in triplicate using SYBR Green QPCR Master Mix kit. Oligonucleotide PCR primer pairs were designed to cross intron-exon boundaries from published mouse sequences in the GenBank database using Primer3 (Rozen & Skaletsky, 2000). The sprouty-2 primers were forward 5′-AGG GGT TGG TGC AAA GCC GC-3′ and reverse 5′-GCG ACC CGT TGC CAC TCT GA-3′. and the c-Met primers were forward 5′-CAT TTC CAG TCC TGC AGT CA-3′ and reverse 5′-CTC CTT CAA GGG GTC CAC TA-3′. PCR amplification was verified by melting curve and electrophoretic analysis of the PCR products on 3% agarose gel. Negative controls (no reverse transcriptase and no template) yielded no products. The data were analyzed using the comparative ΔΔCt method, and mRNA abundance was normalized to β-actin mRNA and expressed as fold-control (Yuan et al., 2006).
Cell Cycle Analysis and Apoptosis determination
For cell cycle analysis and apoptosis assay (Sub G0 phase analysis) cells were plated (200,000 cells/well) in six well plates for 24 hr. Cells were synchronized by serum deprivation and then re-stimulated with normal 10% serum containing media for desired time periods. Cells were then trypsinized, fixed with 70% ethanol overnight and then stained with propidium iodide solution (10 μg/ml) (Invitrogen) containing RNase A (10 U/ml) (Promega) at 4°C for 30 min. The distribution of cells in the cell cycle was assessed by a flow cytometer (Cerda et al., 2001).
Cell Migration and Invasion
For cell migration and invasion assays, cells in 1% serum containing media were plated on 8-micron transwell permeable supports (Corning, Inc) or on BD matrigel transwell invasion chambers, respectively. For migration assays the lower chamber contained 1% serum containing media and 5 ng/ml of HGF. Cells were allowed to migrate for 16 hrs. In invasion assays the lower chamber contained 1% serum containing media and 1 ng/ml of HGF. Cells were allowed to invade for 48 hrs. After incubation, media fractions were discarded and adherent non-invaded cells on the upper surface of the filters were removed with a cotton swab. The filter membranes, containing invaded cells on the lower surface were cut out and cells fixed in methanol. Cells were stained with Diff Quick Stain Kit (IMEB Inc.) and counted under microscope.
HCT-116 Tumor Xenografts in BALB/c (nu/nu) Mice
To assess the effect of sprouty-2 upregulation on HCT-116 tumor xenograft growth, sprouty-2 and EV transfectants (5×10⁶ cells) were suspended in 100 μl PBS and injected subcutaneously in the flank of male nude mice [BALB/c (nu/nu), 4 week old]. Tumor size was measured weekly using a vernier caliper and the tumor volumes calculated using the formula (a × b2 × 0.5), where a and b represents the larger and smaller diameters, respectively. Tumors were excised after 4 wks and aliquots fixed in 10% buffered formalin for histology and immunostaining and separate aliquots frozen for Western blotting analyses.
Immunostaining
5-micron sections of formalin fixed paraffin-embadded tumors were cut and mounted on Vectabond-coated Superfrost Plus slides and immunostained as described earlier (Khare et al., 2003; Khare et al., 2008). Sections were incubated at 4°C with primary antibodies overnight (c-Met, 1:75; Ki-67, 1:50; cleaved caspase-3, 1:25; and nestin-1, 1:50) followed by incubation with HRP-conjugated secondary antibodies (1:200) at room temperature for 30 min. Antigen-antibody complexes were detected by DAKO EnVision Plus System, horseradish peroxidase, using 3,3′-diaminobenzidine as substrate. For negative controls, sections were incubated with isotype-matched irrelevant antibodies.
Orthotopic Cecal Implantation of Tumors in nu/nu Mice
To assess the local invasion and metastatic potential of sprouty-2 up-regulated HCT-116 cells, we performed cecal orthotopic tumor implantations (Shoji et al., 2003). Mice were anesthetized with ketamine (70 mg/kg body wt) and Xylazine (7 mg/kg body wt). Subcutaneously growing colon tumors (taken from subcutaneous xenograft studies) were resected aseptically and minced. Aliquots weighing 75 mg (4 mm diameter) were implanted in the cecum. Briefly, an incision was made through the left lower abdominal pararectal line and peritoneum. The cecal wall was exposed and a part of the serosal membrane was scraped with a 27-gauge needle. Care was exercised to prevent the rupture of the cecal wall. A tumor fragment was placed in a serosal pocket that was secured with a transmural suture. The cecum was returned into the peritoneal cavity, and the abdominal wall closed with sutures. The mice were sacrificed 8 wks after tumor implantation or earlier if they developed signs of distress. At the time of sacrifice, livers were processed for hematoxylin and eosin staining and histological examination.
Statistical Analysis
Results are expressed as means ±SD or means ±SE as indicated. Data were analyzed using student’s t-test for unpaired samples or ANOVA as appropriate. Values of p<0.05 were considered statistically significant.
Results
Sprouty-2 Up-regulation in Human Colon Adenocarcinomas
To determine the potential role of sprouty-2 in human colon adenocarcinomas, we examined sprouty-2 expression levels in colon cancer samples and surrounding normal colon tissues. As shown in Fig. 1A, sprouty-2 was overexpressed in 9 of 10 cancer tissues as compared to low levels of sprouty-2 protein in surrounding normal-appearing colonic mucosa. As assessed by quantitative scanning densitometry we detected 2–15 fold increases in sprouty-2 expression levels in cancer tissues. Furthermore, sprouty-2 mRNA levels were also analyzed by real-time PCR. A significant increase in sprouty-2 transcripts compared to adjacent normal mucosa was noted (Fig. 1B). In contrast, expression levels of sprouty-1 and sprouty-4, isoforms were not changed (data not shown) demonstrating that sprouty-2 might be involved in colorectal carcinogenesis. These tumors were obtained from cecum, ascending and descending colons. Tumors ranged from moderately to poorly differentiated and demonstrated varying stages of invasion. There was no correlation between level of sprouty-2 expression and tumor grade.
Fig. 1. Sprouty-2 up-regulation in human colon adenocarcinomas.

(A) Frozen tissues were homogenized as described in “Materials and Methods” and lysates probed for sprouty-2 expression by Western blotting. Blots were reprobed for β-actin as a loading control. Quantitative densitometry values are expressed as fold increases in sprouty-2 expression in colon adenocarcinomas tumor biopsies (T), compared to adjacent normal-appearing colonic mucosa (N). (B) Total RNA was isolated from six tumors and adjacent normal mucosa. Sprouty-2 mRNA level was quantified as described in “Materials and Methods”. Mean ± SD fold change in tumors compared to adjacent normal-appearing colonic mucosa. *p< 0.05, compared with normal mucosa.
Increased Cell Proliferation in Tat-sprouty-2 Transduced Colon Cancer Cells
To determine biological growth phenotype induced by human sprouty-2 in colon cancer, we transduced HCT-116 cells with sprouty-2. The addition of an 11-amino acid sequence from the TAT protein of human immunodeficiency virus to the N terminus of a protein induces transport of the fusion protein across cell membranes. As a control we also transduced colon cancer cells with TAT-GFP that contained the GFP reporter fused to the TAT protein. As shown in Fig. 2A the transduction efficiency of TAT fused GFP into HCT-116 cells after 5 hrs incubation was nearly 100%. HCT-116 cells were also transduced with TAT-HA-sprouty-2 for different time periods, washed extensively and cell lysates subjected to Western blotting with anti-HA antibody for the presence of TAT-HA-sprouty-2 protein. As shown in Fig. 2B, TAT-HA-sprouty-2 protein was detected in cells within 1 hr of incubation. Transduced HCT-116 cells were allowed to grow in 2% or 10% FBS-containing media and cell proliferation assessed 48 hrs later with Wst-1 reagent. Sprouty-2 significantly increased the cell viability in low serum as well as normal serum conditions compared to GFP transduced cells (Fig. 2C).
Fig. 2. Transduction of HCT-116 cells with TAT-tagged sprouty-2 increases cell proliferation.

(A) Cells were transduced with purified TAT-GFP protein (10 μg/ml) for 5 hr at 37°C. TAT-GFP was visualized using a fluorescence microscope. Note that almost 100% cells are GFP positive. (B) Cells were transduced with purified TAT-HA-sprouty-2 protein (10 μg/ml) for the indicated times at 37°C. Cells were washed extensively and cell lysates subjected to Western blotting with anti-HA antibody to detect exogenous HA tagged sprouty-2. (C) Transduced cells were allowed to grow for 48 hr in 2% serum (open bar) or normal 10% serum (filled bar) containing media. Cell proliferation was assessed by Wst-1 assay as described in “Materials and Methods”. *p< 0.05, compared with TAT-GFP transduced cells.
Sprouty-2 Up-regulation Increases Cell Proliferation and Cell Cycle Transition
To study sprouty-2 induced growth phenotypic alterations in colon cancer cells, we also transfected HCT-116 cells with cDNA encoding HA-tagged full-length human sprouty-2. We selected several stable monoclonal populations of HCT-116 transfectants with upregulated sprouty-2. We observed 6–29 fold increases in sprouty-2 protein expression (Fig. 3A) and greater than −70 fold increases in sprouty-2 transcripts (Fig. 3B) by real-time PCR as compared to EV cells. Since Sprouty-2 transduced colon cancer cells had increased cell proliferation (Fig. 2C), we assessed the effects of sprouty-2 upregulation on cell proliferation. Sprouty-2 transfectants also proliferated significantly faster than EV clones as assessed by total cell counts by coulter counter (Fig. 3C) and Wst-1 assay (Inset). To assess whether increased cell numbers reflected a change in cell cycle, we measured cell cycle phase distribution at indicated time points (Table-1). Cells were serum starved and re-stimulated with 10% serum containing media. After 8 hrs of serum stimulation the cell populations in different phases of cell cycle were comparable in both cell types. At later time points, however, in EV transfectants a gradual decrease in G0-G1 with concomitant increase in G2/M phases were observed (Table-1 and Figs. 4A, B and C). In contrast to EV cells, we observed in a rapid decrease in G2/M and a parallel increase in G0-G1 phases in sprouty-2 transfectants (Table-1 and Figs. 4A, B and C). These data clearly indicate that after serum stimulation sprouty-2 transfectants cycled faster as compared to EV cells. There were no significant differences (mean ±SD, n=5) in apoptotic rates between EV (3.6% ±2.7%) and sprouty-2 transfectants (4.5%±2.9%). These results demonstrate that increased viability of sprouty-2 transfectants in normal serum containing media was due to increased proliferation without affecting basal rate of apoptosis. We further confirmed the cellular proliferation by incorporation of BrdU as a parameter for DNA synthesis. We observed a significant increase in DNA synthesis in sprouty-2 transfectants as compared to EV cells (Fig. 4D). Cell cycle progression is positively regulated by interactions between the cyclin-dependent kinases (CDKs) and G1 cyclins and negatively regulated by cyclin kinase inhibitors (CKIs) (Nigg, 1995). We then demonstrated that cyclin D1 was significantly up-regulated in sprouty-2 transfectants compared to EV transfected cells (Fig. 4E). Roles of G1 CDK and other G1 cyclins will require further investigation.
Fig. 3. Sprouty-2 up-regulation increases cell proliferation.
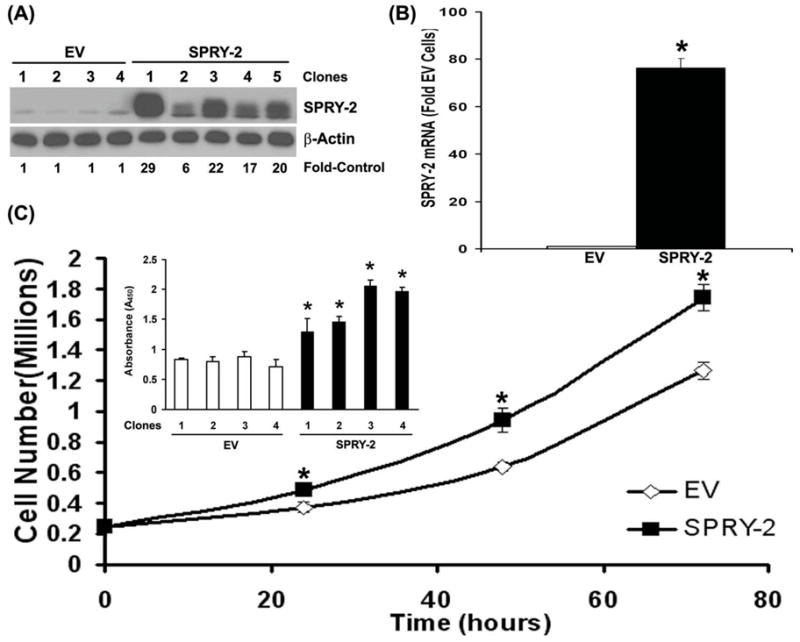
(A) HCT-116 cells were transfected to express HA-human sprouty-2 as described in “Materials and Methods”. Single clones were selected and screened by Western blotting with sprouty-2 (upper panel) and reprobed with β-actin (lower panel) antibodies. EV (Empty Vector, pHm6) transfectants were control monoclonal populations transfected with EV and selected for G418-resistance. Sprouty-2 expression was expressed as fold of EV. (B) Total RNA was isolated from EV and sprouty-2 transfectants. Sprouty-2 mRNA levels were quantified and expressed as fold of EV cells (mean ± SD) as described in “Materials and Methods”. *p< 0.05, compared with EV. (C) EV and sprouty-2 transfected cells were plated in 10% serum containing medium in 6-well plates. Cells were trypsinized and collected at indicated times and counted using a coulter counter. Data represent mean ± SE of three independent experiments. *p< 0.05, compared with EV controls. Inset, cell proliferation by Wst-1 assay. EV and sprouty-2 transfectants were plated in 96-well microtiter plates. Forty-eight hours after plating, Wst-1 reagent was added and the absorbance was measured at 450 nm as described in “Materials and Methods”. Data represent means ± SE of three independent experiments. *p< 0.05, compared with EV controls.
Table 1.
| Time | Clone | G0/G1 | S | G2/M |
|---|---|---|---|---|
| 0hr | EV | 60 ± 0.64 | 13 ± 1.13 | 27 ± 0.64 |
| SPRY-2 | 55 ± 1.4 | 20 ± 0.85 | 25 ± 0.84 | |
| 8hr | EV | 47 ± 3.39 | 15 ± 1.3 | 37 ± 2.05 |
| SPRY-2 | 48 ± 0.91 | 15 ± 0.25 | 37 ± 0.62 | |
| 12hr | EV | 45 ± 3.9 | 19 ± 1.27 | 37 ± 5.53 |
| SPRY-2 | 53 ± 1.37 | 15 ± 0.79 | 32 ± 1.79 | |
| 24hr | EV | 42 ± 2.61 | 14 ± 0.74 | 44 ± 2.31 |
| SPRY-2 | 52 ± 2.55 | 21 ± 1.61 | 27 ± 2.63 |
Fig. 4. Sprouty-2 up-regulation accelerates cell cycle progression and increases cyclin D1 expression in HCT-116 cells.

EV and sprouty-2 transfectants were analyzed at indicated times (Table-1) using CellQuest software in a FacScan flow cytometer as described in “Materials and Methods”. The distribution of DNA in the cell cycle was determined using Modfit LT software. Graphic representation of distribution of cells in G0/G1 (A), S (B) and G2/M (C) phases at indicated time points in EV and sprouty-2 transfectants. Values are reported as mean ± SE in each group (n=4 platings). *p< 0.05, compared with EV controls. (D) EV and sprouty-2 transfectants were plated in 96-well microtiter plates and cells proliferation was assessed by BrdU incorporation measured at indicated times as described in “Materials and Methods”. Data represent mean ± SE of three independent experiments. *p< 0.05, compared with EV controls. (E) Cyclin D1 expression in EV and sprouty-2 transfectants. Blots were reprobed for β-actin as a loading control.
HGF Augments Cell Signaling, Migration and Invasion in Sprouty-2 Transfectants
The regulation of RTK expression and signaling by sprouty-2 has been demonstrated earlier (Lo et al., 2006). We then investigated whether altered phenotype of sprouty-2 transfectants was due to the increased RTK expression and activity. We found that c-Met protein and mRNA transcripts were up-regulated approximately −10 and −35 folds respectively in sprouty-2 transfectants compared to EV transfectants (Fig. 5A and B). In addition, the level of c-Met tyrosine phosphorylation induced by HGF in sprouty-2 clones was 3–5 fold higher than EV transfected cells (Fig. 5C). These results demonstrated that sprouty-2 induces an increase in functional c-Met in colon cancer cells. Important down-stream effectors of c-Met includes phosphatidylinositol-3kinase (PI3K/Akt) and mitogen-activated protein kinase (MAPK)/extracellular signal-regulated kinase (ERK) that mediate proliferative and pro-survival signals (Kanayama et al., 2007). In colon cancer cells Akt and ERK enhance cell cycle progression and inhibit apoptosis (Vaculova et al., 2006). HGF induced significantly greater time-dependent increases in Akt (Fig. 5D) and ERK (Fig. 5E) activations in sprouty-2 transfectants compared to EV transfectants. These data suggest that sprouty-2 at least in part enhances colon cancer cell growth by up-regulating c-Met signaling. HGF/c-Met axis has been shown to contribute to colon cancer cell migration and invasion (Kermorgant et al., 2001). Since functional c-Met was up-regulated in sprouty-2 transfectants, we asked whether HGF would increase migratory and invasive properties of sprouty-2 transfected colon cancer cells. Sprouty-2 upregulation caused a 3–5 fold increase in cell migration (Fig. 5F) and invasion (Fig. 5G) as compared to EV cells.
Fig. 5. Sprouty-2 up-regulation increases hepatocyte growth factor (HGF)-induced signaling, cell migration and invasion.

(A) Upregulation of c-Met receptor expression in sprouty-2 transfectants. Cell lysates from EV or sprouty-2 transfectants were probed for c-Met expression by Western blotting expressed as fold EV cells. (B) Total RNA was isolated from EV and sprouty-2 transfectants and c-Met mRNA levels quantified and expressed as fold of EV (Mean ± SD) as described in “Materials and Methods”. *p< 0.05, compared with EV. (C) HGF increases c-Met tyrosine phosphorylation in sprouty-2 transfectants. Cells were treated with HGF (50 ng/ml) for 5 min, c-Met was immunoprecipitated and Western blotted with anti-phosphotyrosine antibody as described in “Materials and Methods”. (D) Increased phospho-active Akt (p-serine 473) and (E) phospho-active ERK-1,2 (p-ERK 42, 44) induced by HGF in sprouty-2 transfectants. EV or sprouty-2 transfectants were treated with HGF (50 ng/ml) for the indicated times and cell lysates probed for phospho-Akt (serine-473) and phospho-ERK-1,2 expression by Western blotting. Quantitative densitometries were expressed as fold increases compared to untreated controls. (F) HGF increases cell migration in sprouty-2 transfectants. EV or sprouty-2 cells (30×103) were plated on upper chambers of transwells (permeable support, Corning, Inc). The lower chamber contained media with 2% FBS and HGF (5 ng/ml). Sixteen hours later migrated cells were counted as described in “Materials and Methods” (p<0.05 compared to respectively treated EV cells). (G) HGF increases cell invasion in sprouty-2 transfectants. EV or sprouty-2 cells (50×103) cells were plated into upper chambers of transwells coated with matrigel (BD matrigel invasion chamber). The lower chamber contained media with 2% FBS and HGF (1 ng/ml). Forty-eight hrs later migrated (invading) cells were counted as described in “Materials and Methods”. Data was expressed as relative increase in cell migration and invasion compared to EV transfected untreated cells. *p< 0.05, compared to respectively treated EV cells.
c-Met siRNA Decreases Cell Proliferation, Migration and Invasion in Sprouty-2 Transfectants
Since sprouty-2 transfected colon cancer cells had increased c-Met expression, cell proliferation, migration and invasion, we hypothesized that c-Met down-regulation will revert this phenotype in sprouty-2 transfectants. Indeed siRNA-mediated down-regulation of c-Met significantly reduced cell proliferation (Fig. 6A), migration (Fig. 6B) and invasion (Fig. 6C).
Fig. 6. Knockdown of c-Met and sprouty-2 by siRNA decreases cell proliferation, migration and invasion.

Sprouty-2 clones were transfected either with an irrelevant control or specific c-Met siRNA as described in “Materials and Methods”. After transfection cells were trypsinized and plated for cell proliferation assay by BrdU incorporation (A), migration. (B) and invasion (C) analyses as described earlier. Inset, c-Met expression by Western blotting in siRNA transfected cells. (D) HT-29 (open bars) and LS-174T (solid bars) colon cancer cells were transfected either with an irrelevant control or specific sprouty-2 siRNA as described in “Materials and Methods”. After transfection cells were trypsinized and plated for cell invasion analysis as described earlier. Inset, sprouty-2 and c-met expression in sprouty-2 siRNA transfected cells.
Sprouty-2 siRNA Decreases Cell Invasion in Parental HT-29 and LS-174T Cells
To demonstrate that effect of sprouty-2 upregulation is not specific to HCT-116 cells, which are mutated for K-ras, we utilized two other colon cancer cell lines, HT-29 wild-type for K-ras and LS-174T mutated for K-ras. Down-regulation of constitutive sprouty-2 by siRNA in these cell lines significantly inhibited cell invasion (Fig. 6D). These results demonstrate that the effect of sprouty-2 in colon cancer cells is not K-ras mutation specific or limited to a unique cell type.
c-Met Upregulation in Human Colon Adenocarcinomas
Since sprouty-2 transfectants had increased c-Met expression, we next asked whether human tumors that express higher levels of sprouty-2 (Fig. 1) would also demonstrate an up-regulation of c-Met receptor. We demonstrated that c-Met was over-expressed in 11 of 12 cancer tissues as compared to low levels of c-Met protein in adjacent normal-appearing colonic mucosa (Fig. 7A). Levels of c-Met over-expression ranged from 2 to 28-fold in cancer tissue. Furthermore, c-met mRNA transcripts were increased by more than 50-fold in these colonic tumors as compared to normal colonic mucosa (Fig. 7B).
Fig. 7. c-Met up-regulation in human colon adenocarcinomas.

Frozen tissues were homogenized as described in “Materials and Methods” and lysates probed for c-Met expression by Western blotting. Blots were reprobed for β-actin as a loading control. Quantitative densitometries were expressed as fold increases in c-Met expression in colonic adenocarcinomas tumor biopsies (T), compared to adjacent normal-appearing colonic mucosa (N). (B) Total RNA was isolated from six tumors and adjacent normal mucosa and c-Met mRNA quantified as described in “Materials and Methods”. Mean ± SD fold change in tumors compared to adjacent normal-appearing colonic mucosa. *p< 0.05, compared with normal mucosa.
Increased Proliferation, Angiogenesis and Decreased Apoptosis in Sprouty-2 Xenografts
To evaluate the oncogenic potential of sprouty-2 in vivo, we examined tumor xenograft growth of EV or sprouty-2 transfectants in male athymic mice. Four weeks after cell implantation sprouty-2 transfected cells formed tumors that were 6 times larger by weight (Fig. 8, Inset) and volume (Fig. 8) compared to tumors derived from EV cells. The increased growth of tumors from sprouty-2 transfected cells may reflect increased proliferation in these tumors. In agreement with this, the proliferation marker Ki-67 was 5-fold greater in sprouty-2 tumors compared to EV tumors (Fig. 9A and 9B). However, we also observed a significant decrease in expression of cleaved caspase-3 (active caspase-3) in sprouty-2 tumors compared to EV tumors (Fig. 9A and 9C). Caspase-3 is a key effector caspase in the apoptosis pathway, amplifying signals from initiator caspases, such as caspase-8 (Huerta et al., 2006). A decrease in apoptosis as assessed by lower cleaved caspase-3 levels in sprouty-2 tumors would also be expected to contribute to the increased size of these tumors compared to EV tumors.
Fig. 8. Sprouty-2 up-regulation increases tumor xenograft growth in BALB/c-nu/nu mice.

EV or sprouty-2 transfectants were injected into flanks of nude mice (5 mice in each group). Tumor size was measured every week and on day 28 tumors were excised as described in “Materials and Methods”. Significant increases in sprouty-2 transfectant tumor sizes were detected on day 14, 21 and 28 compared to time-matched EV tumors. *p< 0.05, compared to mice injected with EV transfected cells. Inset, sprouty-2 up-regulation significantly increases tumor weight compared to EV tumors (day 28). *p< 0.05, compared with tumors from mice injected with EV transfectants.
Fig. 9. Sprouty-2 up-regulation increases cell proliferation, survival, angiogenesis in tumor xenografts and increases liver metastasis of cecal implants.

(A) c-Met, Ki67 (proliferation marker), cleaved caspase-3 (apoptosis marker) and nestin-1 (endothelial cell angiogenesis marker) immunostaining in sprouty-2 and EV tumor xenografts. Computer assisted quantitation for Ki67 (B), cleaved caspase-3 (C), mean blood vessel area/field (D) and total vessels/field (E) in tumor xenografts. *p< 0.05, compared to EV tumors. (F) Sprouty-2 increases Cox-2 expression in tumor xenografts. Tumor lysates from EV and sprouty-2 groups were probed for Cox-2 by Western blotting. Blots were reprobed for β-actin as a loading control. (G) Tumor fragments (4 mm, 75 mg) taken from subcutaneously growing tumor xenografts were implanted in the cecal wall as described in “Materials and Methods”. After eight weeks, livers were harvested and sections stained with hematoxylin and eosin. Shown are representative liver metastasis 100x and 200x in a mouse implanted with subcutaneous sprouty-2 tumor fragment. Four implantations were done in each group. Three out of four tumors in sprouty group demonstrated liver metastasis, whereas only one tumor in EV group showed metastatic lesion.
Neoangiogenesis is an important requirement for tumor growth. Since sprouty-2 tumors were significantly larger than EV tumors, we assessed tumor vascularization. Nestin-1, a class VI intermediate filament protein is a novel angiogenesis marker used to detect newly proliferating endothelial cells in colorectal angiogenesis (Teranishi et al., 2007). As assessed by quantitative nestin-1 immunostaining (Fig. 9A) there was a 5-fold increase in mean vessel area (Fig. 9D) and a 4-fold increase in total number of vessels (Fig. 9E) in sprouty-2 tumors compared to EV tumors.
Prostaglandins are important mediators of neoplastic capillary growth (Wang et al., 2008). Since Cox-2 is the rate limiting enzyme in prostaglandin biosynthesis and frequently up-regulated in colon cancer, we measured expression of this enzyme (Harris, 2009; Khare et al., 2003; Khare et al., 2008). Cox-2 levels were significantly higher in most sprouty-2 tumors compared to EV tumors (Fig. 9F), consistent with the increased angiogenesis noted.
Increased Liver Metastasis Arising from Cecal Orthotopic Sprouty-2 HCT-116 tumor xenografts
Since spourty-2 enhanced the growth phenotype of colon cancer cells in culture and in tumor xenografts in vivo, we asked whether upregulation of c-Met by sprouty-2 would influence the metastatic potential of these cells. We implanted a small piece of a tumor derived from EV or sprouty-2 xenografts into the cecal wall of nude mice. Tumor fractions with equal size and weight were implanted into each mouse. After 8 weeks, mice were sacrificed and livers were harvested. Tissues were fixed in formalin and stained with hematoxylin and eosin. Three of four sprouty-2 tumors developed liver metastases compared to only one EV tumor. A representative liver section demonstrating metastatic sprouty-2 cells is shown in Fig. 9G. These results strongly suggest that sprouty increases the metastatic potential of K-ras mutant colon cancer cells.
Discussion
Sprouty proteins have been characterized as repressors of RTK signaling. Sprouty inhibits growth factor-induced cellular proliferation, migration and differentiation (Brett et al., 2001; Impagnatiello et al., 2001; Lee et al., 2004; Poppleton et al., 2004; Yigzaw et al., 2001). Sprouty proteins act as competitive inhibitors and have been shown to block Ras/MAPK pathway at multiple levels extending from RTK to Raf activation. All sprouty proteins share a highly conserved cysteine-rich domain at the carboxy terminus. This domain is believed to be critical to target sprouty to the plasma membrane where it can inhibit MAPK signals (Hanafusa et al., 2002; Lim et al., 2002; Yigzaw et al., 2001). The carboxy termini of sprouty-2 and -4 can bind directly to Raf-1, inhibiting Raf-1 kinase activity (Sasaki et al., 2003). In contrast, in certain mammalian contexts, sprouty proteins not only fail to inhibit but may even potentiate EGFR signals (Egan et al., 2002; Hall et al., 2003; Impagnatiello et al., 2001; Lim et al., 2002; Pelletier et al., 2003; Sasaki et al., 2003). Previous reports have provided experimental evidence that the N-terminal tyrosine residue of sprouty-2, Tyr55, functions as a docking site for the SH2 domain of c-Cbl (Fong et al., 2003; Hall et al., 2003; Pelletier et al., 2003). Sprouty-2 can compete with EGFR for binding to c-Cbl and thereby block EGFR ubiquination and degradation (Egan et al., 2002; Fang et al., 1999; Lim et al., 2002). As a consequence, EGFR fails to down-regulate and can promote sustained activation of the MAPK pathway (Egan et al., 2002; Fang et al., 1999; Lim et al., 2002). Specifically, in Ras-transformed fibroblasts, sprouty-2 sustains the level and signaling activity of EGFR and is necessary for tumor formation (Lito et al., 2008). In addition, sprouty-1 and -2 uncouple RTK signaling from Ras activation, possibly by sequestering Grb-2, an adaptor protein required for Ras activation (Brett et al., 2001; Hanafusa et al., 2002).
The roles of Sprouty proteins, however, have never been investigated in colon cancer. In our studies sprouty-2 up-regulation in K-ras mutant HCT-116 colon cancer cells enhanced cell proliferation, migration and invasion. Furthermore, the RTK c-Met was upregulated in sprouty-2 transfectants. Future studies will be required to elucidate how sprouty-2 increases c-Met expression in colon cancer cells. Sprouty-2 might increase synthesis by stimulating c-Met transcription or decrease degradation, as Cbl-dependent receptor ubiquitination and degradation by the proteosomal/lysosomal pathways also regulate c-Met expression (Li et al., 2007).
Sprouty-2 inhibited proliferation and migration of HeLa cells (Yigzaw et al., 2001) and human umbilical vein endothelial cells (HUVEC) (Impagnatiello et al., 2001) in response to a number of growth factor receptor agonists. Similarly, sprouty-2 was shown to inhibit proliferation of NIH3T3 cells (Gross et al., 2001) and rat intestinal epithelial cells (Poppleton et al., 2004) by suppressing Ras activation. In contrast, in the present studies we demonstrated for the first time that sprouty-2 up-regulation in HCT-116 colon cancer cells increased cell proliferation and enhanced HGF-induced invasion and migration. The underlying mechanisms that mediate increased proliferation and enhanced migration will require further study but appear to involve c-Met up-regulation. Alternatively, sprouty-2 might drive both inhibitory signals by inhibiting the Ras pathway and activating signals by other pathways (c-Met for example). The presence of Ras mutations might circumvent the inhibitory effects, allowing the stimulatory signals to be dominant. Sprouty-2 knockdown by siRNA in K-ras wild-type HT-29 and K-ras mutated LS-174T cells significantly reduced cell invasion, indicating that the oncogenic effects of sprouty-2 in colon cancer cells is not K-ras dependent or unique to one specific cell type.
Metastatic disease is the major cause of colon cancer-related death. For this reason, identifying individuals with stage II or III locally resectable disease who are at increased risk for metastasis is of great importance. Our studies suggest that sprouty-2 up-regulation increases the risk of cells forming metastasis. In part c-Met up-regulation by sprouty-2 might account for this increased metastatic potential since c-Met is known to increase proliferation, migration and invasion (Corps et al., 1997; Kermorgant et al., 2001; Nakanishi et al., 1999). In tumor cells, c-Met can be activated in a ligand independent manner through c-Met mutation, over-expression and amplification (Trusolino & Comoglio, 2002). Recent studies have failed to find c-Met mutations in colon cancer (Zeng et al., 2008). Several studies indicate, however, that c-Met over-expression contributes to invasion and metastasis and over-expression was significantly associated with increased risk for local invasion and lymph-node metastasis (Fujita & Sugano, 1997; Kammula et al., 2007; Schmidt et al., 1999; Takeuchi et al., 2003; Zeng et al., 2004). Further studies are needed to dissect how sprouty-2 up-regulates c-Met in colon cancer. It will also be of interest to examine sprouty-2 expression levels in other tumor types with elevated c-Met expression. Thus in colon cancer sprouty-2 over-expression enhances the transformed phenotype and its effects are mediated in part by c-Met up-regulation.
Acknowledgments
These studies were funded in part by the following grants: CA036745 (M. Bissonnette) and VA merit award (S. Khare)
Footnotes
Conflict of Interest: The authors declare no conflict of Interest
References
- Bloethner S, Chen B, Hemminki K, Muller-Berghaus J, Ugurel S, Schadendorf D, Kumar R. Carcinogenesis. 2005;26:1224–32. doi: 10.1093/carcin/bgi066. [DOI] [PubMed] [Google Scholar]
- Brett D, Kemmner W, Koch G, Roefzaad C, Gross S, Schlag PM. Oncogene. 2001;20:4581–5. doi: 10.1038/sj.onc.1204610. [DOI] [PubMed] [Google Scholar]
- Cabrita MA, Christofori G. Angiogenesis. 2008;11:53–62. doi: 10.1007/s10456-008-9089-1. [DOI] [PubMed] [Google Scholar]
- Cerda SR, Bissonnette M, Scaglione-Sewell B, Lyons MR, Khare S, Mustafi R, Brasitus TA. Gastroenterology. 2001;120:1700–12. doi: 10.1053/gast.2001.24843. [DOI] [PubMed] [Google Scholar]
- Corps AN, Sowter HM, Smith SK. Int J Cancer. 1997;73:151–5. doi: 10.1002/(sici)1097-0215(19970926)73:1<151::aid-ijc23>3.0.co;2-i. [DOI] [PubMed] [Google Scholar]
- Dougherty U, Cerasi D, Taylor I, Kocherginsky M, Tekin U, Badal S, Aluri L, Sehdev A, Cerda S, Mustafi R, Delgado J, Joseph L, Zhu H, Hart J, Threadgill D, Fichera A, Bissonnette M. Clin Cancer Res. 2009;15:6780–9. doi: 10.1158/1078-0432.CCR-09-1678. [DOI] [PMC free article] [PubMed] [Google Scholar]
- Edwin F, Singh R, Endersby R, Baker SJ, Patel TB. J Biol Chem. 2006;281:4816–22. doi: 10.1074/jbc.M508300200. [DOI] [PubMed] [Google Scholar]
- Egan JE, Hall AB, Yatsula BA, Bar-Sagi D. Proc Natl Acad Sci U S A. 2002;99:6041–6. doi: 10.1073/pnas.052090899. [DOI] [PMC free article] [PubMed] [Google Scholar]
- Fang X, Yu S, Eder A, Mao M, Bast RC, Jr, Boyd D, Mills GB. Oncogene. 1999;18:6635–40. doi: 10.1038/sj.onc.1203076. [DOI] [PubMed] [Google Scholar]
- Fong CW, Chua MS, McKie AB, Ling SH, Mason V, Li R, Yusoff P, Lo TL, Leung HY, So SK, Guy GR. Cancer Res. 2006;66:2048–58. doi: 10.1158/0008-5472.CAN-05-1072. [DOI] [PubMed] [Google Scholar]
- Fong CW, Leong HF, Wong ES, Lim J, Yusoff P, Guy GR. J Biol Chem. 2003;278:33456–64. doi: 10.1074/jbc.M301317200. [DOI] [PubMed] [Google Scholar]
- Fujita S, Sugano K. Jpn J Clin Oncol. 1997;27:378–83. doi: 10.1093/jjco/27.6.378. [DOI] [PubMed] [Google Scholar]
- Gross I, Bassit B, Benezra M, Licht JD. J Biol Chem. 2001;276:46460–8. doi: 10.1074/jbc.M108234200. [DOI] [PubMed] [Google Scholar]
- Guy GR, Wong ES, Yusoff P, Chandramouli S, Lo TL, Lim J, Fong CW. J Cell Sci. 2003;116:3061–8. doi: 10.1242/jcs.00652. [DOI] [PubMed] [Google Scholar]
- Hacohen N, Kramer S, Sutherland D, Hiromi Y, Krasnow MA. Cell. 1998;92:253–63. doi: 10.1016/s0092-8674(00)80919-8. [DOI] [PubMed] [Google Scholar]
- Hall AB, Jura N, DaSilva J, Jang YJ, Gong D, Bar-Sagi D. Curr Biol. 2003;13:308–14. doi: 10.1016/s0960-9822(03)00086-1. [DOI] [PubMed] [Google Scholar]
- Hanafusa H, Torii S, Yasunaga T, Nishida E. Nat Cell Biol. 2002;4:850–8. doi: 10.1038/ncb867. [DOI] [PubMed] [Google Scholar]
- Harris RE. Inflammopharmacology. 2009;17:55–67. doi: 10.1007/s10787-009-8049-8. [DOI] [PubMed] [Google Scholar]
- Huerta S, Goulet EJ, Livingston EH. Am J Surg. 2006;191:517–26. doi: 10.1016/j.amjsurg.2005.11.009. [DOI] [PubMed] [Google Scholar]
- Impagnatiello MA, Weitzer S, Gannon G, Compagni A, Cotten M, Christofori G. J Cell Biol. 2001;152:1087–98. doi: 10.1083/jcb.152.5.1087. [DOI] [PMC free article] [PubMed] [Google Scholar]
- Kammula US, Kuntz EJ, Francone TD, Zeng Z, Shia J, Landmann RG, Paty PB, Weiser MR. Cancer Lett. 2007;248:219–28. doi: 10.1016/j.canlet.2006.07.007. [DOI] [PubMed] [Google Scholar]
- Kanayama M, Takahara T, Yata Y, Xue F, Shinno E, Nonome K, Kudo H, Kawai K, Kudo T, Tabuchi Y, Watanabe A, Sugiyama T. Am J Physiol Gastrointest Liver Physiol. 2007;293:G230–9. doi: 10.1152/ajpgi.00068.2007. [DOI] [PubMed] [Google Scholar]
- Kermorgant S, Aparicio T, Dessirier V, Lewin MJ, Lehy T. Carcinogenesis. 2001;22:1035–42. doi: 10.1093/carcin/22.7.1035. [DOI] [PubMed] [Google Scholar]
- Khare S, Cerda S, Wali RK, von Lintig FC, Tretiakova M, Joseph L, Stoiber D, Cohen G, Nimmagadda K, Hart J, Sitrin MD, Boss GR, Bissonnette M. Cancer Res. 2003;63:3517–23. [PubMed] [Google Scholar]
- Khare S, Mustafi R, Cerda S, Yuan W, Jagadeeswaran S, Dougherty U, Tretiakova M, Samarel A, Cohen G, Wang J, Moore C, Wali R, Holgren C, Joseph L, Fichera A, Li YC, Bissonnette M. Nutr Cancer. 2008;60:389–400. doi: 10.1080/01635580701883003. [DOI] [PubMed] [Google Scholar]
- Kim HJ, Bar-Sagi D. Nat Rev Mol Cell Biol. 2004;5:441–50. doi: 10.1038/nrm1400. [DOI] [PubMed] [Google Scholar]
- Kwabi-Addo B, Wang J, Erdem H, Vaid A, Castro P, Ayala G, Ittmann M. Cancer Res. 2004;64:4728–35. doi: 10.1158/0008-5472.CAN-03-3759. [DOI] [PubMed] [Google Scholar]
- Lee CC, Putnam AJ, Miranti CK, Gustafson M, Wang LM, Vande Woude GF, Gao CF. Oncogene. 2004;23:5193–202. doi: 10.1038/sj.onc.1207646. [DOI] [PubMed] [Google Scholar]
- Lee M. Biochem Biophys Res Commun. 2006;350:450–6. doi: 10.1016/j.bbrc.2006.09.067. [DOI] [PubMed] [Google Scholar]
- Li N, Lorinczi M, Ireton K, Elferink LA. J Biol Chem. 2007;282:16764–75. doi: 10.1074/jbc.M610835200. [DOI] [PubMed] [Google Scholar]
- Lim J, Yusoff P, Wong ES, Chandramouli S, Lao DH, Fong CW, Guy GR. Mol Cell Biol. 2002;22:7953–66. doi: 10.1128/MCB.22.22.7953-7966.2002. [DOI] [PMC free article] [PubMed] [Google Scholar]
- Lito P, Mets BD, Kleff S, O’Reilly S, Maher VM, McCormick JJ. J Biol Chem. 2008;283:2002–9. doi: 10.1074/jbc.M709046200. [DOI] [PubMed] [Google Scholar]
- Lo TL, Fong CW, Yusoff P, McKie AB, Chua MS, Leung HY, Guy GR. Cancer Lett. 2006;242:141–50. doi: 10.1016/j.canlet.2005.12.032. [DOI] [PubMed] [Google Scholar]
- Lo TL, Yusoff P, Fong CW, Guo K, McCaw BJ, Phillips WA, Yang H, Wong ES, Leong HF, Zeng Q, Putti TC, Guy GR. Cancer Res. 2004;64:6127–36. doi: 10.1158/0008-5472.CAN-04-1207. [DOI] [PubMed] [Google Scholar]
- McKie AB, Douglas DA, Olijslagers S, Graham J, Omar MM, Heer R, Gnanapragasam VJ, Robson CN, Leung HY. Oncogene. 2005;24:2166–74. doi: 10.1038/sj.onc.1208371. [DOI] [PubMed] [Google Scholar]
- Minowada G, Miller YE. Am J Respir Cell Mol Biol. 2009;40:31–7. doi: 10.1165/rcmb.2008-0147OC. [DOI] [PMC free article] [PubMed] [Google Scholar]
- Nakanishi K, Fujimoto J, Ueki T, Kishimoto K, Hashimoto-Tamaoki T, Furuyama J, Itoh T, Sasaki Y, Okamoto E. Clin Exp Metastasis. 1999;17:507–14. doi: 10.1023/a:1006685218766. [DOI] [PubMed] [Google Scholar]
- Nigg EA. Bioessays. 1995;17:471–80. doi: 10.1002/bies.950170603. [DOI] [PubMed] [Google Scholar]
- Pelletier G, Roulot D, Davion T, Masliah C, Causse X, Oberti F, Raabe JJ, Van Lemmens C, Labadie H, Serfaty L. Hepatology. 2003;37:887–92. doi: 10.1053/jhep.2003.50118. [DOI] [PubMed] [Google Scholar]
- Poppleton HM, Edwin F, Jaggar L, Ray R, Johnson LR, Patel TB. Biochem Biophys Res Commun. 2004;323:98–103. doi: 10.1016/j.bbrc.2004.08.070. [DOI] [PubMed] [Google Scholar]
- Rozen S, Skaletsky H. Methods Mol Biol. 2000;132:365–86. doi: 10.1385/1-59259-192-2:365. [DOI] [PubMed] [Google Scholar]
- Rubin C, Litvak V, Medvedovsky H, Zwang Y, Lev S, Yarden Y. Curr Biol. 2003;13:297–307. doi: 10.1016/s0960-9822(03)00053-8. [DOI] [PubMed] [Google Scholar]
- Sasaki A, Taketomi T, Kato R, Saeki K, Nonami A, Sasaki M, Kuriyama M, Saito N, Shibuya M, Yoshimura A. Nat Cell Biol. 2003;5:427–32. doi: 10.1038/ncb978. [DOI] [PubMed] [Google Scholar]
- Schmidt L, Junker K, Nakaigawa N, Kinjerski T, Weirich G, Miller M, Lubensky I, Neumann HP, Brauch H, Decker J, Vocke C, Brown JA, Jenkins R, Richard S, Bergerheim U, Gerrard B, Dean M, Linehan WM, Zbar B. Oncogene. 1999;18:2343–50. doi: 10.1038/sj.onc.1202547. [DOI] [PubMed] [Google Scholar]
- Shoji T, Konno H, Tanaka T, Sakaguchi T, Sunayama K, Baba M, Kamiya K, Ohta M, Kaneko T, Igarashi A, Nakamura S. Cancer Lett. 2003;195:235–41. doi: 10.1016/s0304-3835(02)00108-8. [DOI] [PubMed] [Google Scholar]
- Su AI, Cooke MP, Ching KA, Hakak Y, Walker JR, Wiltshire T, Orth AP, Vega RG, Sapinoso LM, Moqrich A, Patapoutian A, Hampton GM, Schultz PG, Hogenesch JB. Proc Natl Acad Sci U S A. 2002;99:4465–70. doi: 10.1073/pnas.012025199. [DOI] [PMC free article] [PubMed] [Google Scholar]
- Sutterluty H, Mayer CE, Setinek U, Attems J, Ovtcharov S, Mikula M, Mikulits W, Micksche M, Berger W. Mol Cancer Res. 2007;5:509–20. doi: 10.1158/1541-7786.MCR-06-0273. [DOI] [PubMed] [Google Scholar]
- Takeuchi H, Bilchik A, Saha S, Turner R, Wiese D, Tanaka M, Kuo C, Wang HJ, Hoon DS. Clin Cancer Res. 2003;9:1480–8. [PubMed] [Google Scholar]
- Teranishi N, Naito Z, Ishiwata T, Tanaka N, Furukawa K, Seya T, Shinji S, Tajiri T. Int J Oncol. 2007;30:593–603. [PubMed] [Google Scholar]
- Trusolino L, Comoglio PM. Nat Rev Cancer. 2002;2:289–300. doi: 10.1038/nrc779. [DOI] [PubMed] [Google Scholar]
- Vaculova A, Hofmanova J, Soucek K, Kozubik A. FEBS Lett. 2006;580:6565–9. doi: 10.1016/j.febslet.2006.11.004. [DOI] [PubMed] [Google Scholar]
- Wang L, Chen W, Xie X, He Y, Bai X. Exp Oncol. 2008;30:42–51. [PubMed] [Google Scholar]
- Wong ES, Lim J, Low BC, Chen Q, Guy GR. J Biol Chem. 2001;276:5866–75. doi: 10.1074/jbc.M006945200. [DOI] [PubMed] [Google Scholar]
- Yigzaw Y, Cartin L, Pierre S, Scholich K, Patel TB. J Biol Chem. 2001;276:22742–7. doi: 10.1074/jbc.M100123200. [DOI] [PubMed] [Google Scholar]
- Yuan JS, Reed A, Chen F, Stewart CN., Jr BMC Bioinformatics. 2006;7:85. doi: 10.1186/1471-2105-7-85. [DOI] [PMC free article] [PubMed] [Google Scholar]
- Zeng Z, Weiser MR, D’Alessio M, Grace A, Shia J, Paty PB. Clin Exp Metastasis. 2004;21:409–17. doi: 10.1007/s10585-005-1617-4. [DOI] [PubMed] [Google Scholar]
- Zeng ZS, Weiser MR, Kuntz E, Chen CT, Khan SA, Forslund A, Nash GM, Gimbel M, Yamaguchi Y, Culliford ATt, D’Alessio M, Barany F, Paty PB. Cancer Lett. 2008;265:258–69. doi: 10.1016/j.canlet.2008.02.049. [DOI] [PMC free article] [PubMed] [Google Scholar]