

Abstract
Objective:
To examine the validity of central venous oxygen saturation (ScvO2) as a numerical substitution of mixed venous oxygen saturation (SvO2) in adult patients undergoing normothermic on pump beating coronary artery bypass grafting (CABG).
Materials and Methods:
Prospective clinical observational study was done at King Khalid University Hospital, King Saud University, Riyadh, Kingdom of Saudi Arabia. Thirty four adult patients scheduled for coronary artery surgery were included. Patients were monitored by a pulmonary artery catheter (PAC) as a part of our routine intraoperative monitoring. SvO2 and ScvO2 were simultaneously measured 15 minutes (T1) and 30 minutes (T2) after induction of anesthesia, 15 and 30 minutes after initiation of cardiopulmonary bypass (T3 and T4), and 15 and 30 minutes after admission to intensive care unit (T5 and T6).
Results:
ScvO2 showed higher reading than SvO2 all through our study. Our results showed perfect positive statistically significant correlation between SvO2 and ScvO2 at all data points. Individual mean of difference (MOD) between both the readings at study time showed MOD of 1.34 and 1.44 at T1 and T2 simultaneously. This MOD was statistically insignificant, but after on pump beating normothermic bypass was initiated; MOD was 5.2 and 4.4 at T3 and T4 with high statistical significance. In ICU, MOD continues to have high statistical significance, MOD was 6.3 at T5 and at T6 it was 4.6.
Conclusions:
In on pump beating CABG patients; ScvO2 and SvO2 are not interchangeable numerically. ScvO2 is useful in the meaning of trend; our data suggest that ScvO2 is equivalent to SvO2 , only in the course of clinical decisions as long as absolute values are not required.
Keywords: Coronary artery bypass grafting, mixed venous oxygen saturation, coronary artery bypass grafting, mixed venous oxygen saturation, central venous oxygen saturation
INTRODUCTION
Mixed venous oxygen saturation (SvO2) is a valuable measurement in hemodynamically unstable patients during cardiac surgery.[1,2] SvO2 has been used to assess to what extent the cardiopulmonary system meets the metabolic demands of the various tissues and to provide an index of tissue oxygenation.[3] Furthermore, it allows calculation of tissue oxygen consumption, oxygen extraction ratio, and the degree of pulmonary venous admixture.[4] However, SvO2 measurement is obtained only from a correctly positioned pulmonary artery catheter (PAC).
Significant complications are associated with the use of a PAC.[5,6] As such, central venous oxygen saturation (ScvO2) represents an attractive alternative to SvO2 because central venous catheterization is easier and less invasive than pulmonary artery (PA) catheterization.[7]
The clinical applicability of substituting ScvO2 for SvO2 in different clinical situations is still not fully studied. Open heart surgery is a unique clinical situation where there is a great variation during the surgery in hemodynamic and filling indices.
In a previous study,[8] we aimed to examine the correlation between ScvO2 sampled from a standalone central venous line (CVL) and SvO2 sampled from PAC port, to test the validity of the clinical applicability of substituting ScvO2 from CVL for SvO2 in adult patients with poor myocardial function undergoing open heart coronary artery bypass grafting surgery (CABG).[8] In the current study, we are testing the same hypothesis in patients with normal functioning myocardium undergoing CABG using the on pump beating technique, while measuring the ScvO2 from a proximal PAC port.
MATERIALS AND METHODS
After obtaining approval from the Institutional Review Board at the College of Medicine, King Saud University, Riyadh, KSA, and informed consent from each participant, we studied 34 patients scheduled to undergo CABG using on pump beating normothermic cardiopulmonary bypass.
The present study is a prospective observational study. Thirty four adult patients of either sex, aged above 40 years, suffering from coronary heart disease with normal myocardial function, scheduled for elective CABG surgery were included in the study.
A standardized balanced anesthetic technique was used for all the patients; patients were premedicated with lorazepam 2 mg orally at the night of surgery and morphine 0.1 mg/kg IM preoperatively. On receiving the patient in operating room, standard monitoring was instituted. Peripheral venous as well as radial artery cannulae were inserted. Induction is with sufentanil 1-1.5 μg/kg, midazolam 0.05-0.1 mg/kg, and rocuronium 0.9 mg/kg, then a maintenance infusion of the same induction agents, that is, sufentanil 0.2 μg/kg/h, midazolam 1.5 μg/kg/h and rocuronium 0.5 mg/kg/h supplemented with sevoflurane was given as required. Induction doses as well as anesthetic maintenance supplementation were guided by BIS® monitoring (Aspect medical Systems, inc, Norwood, Massachusetts, USA ), and signs of lack of analgesia correlated with hemodynamic changes were managed as appropriate. A PAC was inserted after induction of anesthesia enabling monitoring of SvO2, ScvO2 as well as other derived parameters. The lungs were mechanically ventilated with a tidal volume of 8 mL/kg and FiO2 of 0.4 oxygen in air mixture, while ventilatory rate was adjusted to maintain a PaCO2 of 32–36 mmHg.
A 7.5F PAC (Edwards Lifesciences; Irvine, CA, USA) that was 110 cm in length and had the right atrial lumen positioned 30 cm from the tip was inserted through the internal jugular vein using a percutaneous 8.5F sheath introducer (Edwards Lifesciences). A pressure tracing obtained from the proximal PAC port was used to ascertain correct positioning in the right atrium (RA). Postoperative portable chest radiograph and the presence of PA pressure tracings confirmed the location of the distal port in the PA.
Immediately after the insertion of the PAC, each patient had one set of paired blood samples drawn in random order simultaneously from the distal and proximal ports of PAC. The first 2 mL blood drawn for each sample was discarded to prevent contamination with flushing fluid. Blood was sampled from distal PAC port while the catheter balloon deflated. We then measured the pulmonary artery occlusive pressure (PAOP) and cardiac output (CO) by the thermo dilution method as well as other hemodynamic calculations.
Previous data were collected 15 and 30 minutes after induction of anesthesia (T1, T2), 15 and 30 minutes after initiation of cardiopulmonary bypass (T3, T4) and 15 and 30 minutes postadmission to intensive care unit (T5 and T6).
Blood samples were drawn simultaneously from the PA and RA at six different data points mentioned. A standard volume of 1 mL blood was obtained from each site, and oxygen saturations per blood sample were determined using the blood gas analyzer (QS 50® ; Radiometer, Copenhagen, Denmark).
All surgeries were done by the same surgeon, using the on pump beating normothermic cardiopulmonary bypass.
Data analysis
Data were analyzed using statistical software package (Graph Pad In Stat® version 3.00 for Windows, Graph Pad Software Inc., San Diego, CA, USA) and presented as numbers, mean (standard deviation [SD]), or ratio. Data were compared using the parametric or the nonparametric versions of analysis of variance (ANOVA) followed by the appropriate post hoc analysis if significance was detected. P values < 0.05 were considered significant.
Demographic and hemodynamic data were compared using the Student‘s t-test with levels of significance adjusted according to the method of Bonferroni for multiple comparisons. P < 0.05 is deemed to denote a significant difference.
The correlation between SvO2 and ScvO2 was evaluated by linear regression analysis and Pearson test followed by the F test. Mean of difference (MOD) between simultaneously measured SvO2 and ScvO2 individual values were calculated. The Student‘s t-test was used to determine whether the mean difference was significantly different from zero.
RESULTS
Patients‘ demographic and operative data are shown inTable 1. The measured hemodynamic parameters and hemoglobin concentration values are listed inTable 2. Other parameters assessed such as Cardiac Index, PAOP and CVP were not applicable during bypass (T3 and T4).
Table 1.
Demographic and operative data
| Number of patients | 34 |
| Age (years) | 57.1 ± 5.2 |
| Sex M/F (n) | 25/9 |
| Preoperative Hb% (g/dL) | 12.1 ± 1.57 |
| No. of grafts | 2.9 ± 0.81 |
| LVEF(%) | 47.41 ± 5.92 |
| CPB time (minutes) | 109.4 ± 18.51 |
Data are expressed as mean ± SD.
Table 2.
Hemodynamic parameters and hemoglobin concentrations at the different data points
| T1 | T2 | T3 | T4 | T5 | T6 | P value | |
|---|---|---|---|---|---|---|---|
| SaO2 (%) | 99.21 ± 1.23 | 99.34 ± 0.81 | 99.49 ± 0.92 | 99.59 ± 0.72 | 99.3 ± 0.94 | 99.21 ± 0.69 | NS |
| CI (L/min/M2) | 3.32 ± 1.22 | 3.13 ± 1.14 | NA | NA | 4.32 ± 0.89 | 3.89 ± 0.81 | NA |
| PAOP (mmHg) | 17.12 ± 5.93 | 18.32 ± 5.16 | NA | NA | 13.33 ± 5.9 | 14.13 ± 5.44 | NA |
| CVP (mmHg) | 14.23 ± 8.15 | 11.62 ± 6.26 | NA | NA | 13.96 ± 7.34 | 12.93 ± 8.52 | NA |
| Hb (g/dL) | 12.41 ± 1.7 | 12.1 ± 1.42 | 10.1 ± 2.32 | 8.98 ± 2.56 | 9.67 ± 1.32 | 10.2 ± 3.44 | <0.001 |
Data are expressed as mean ± SD, significant (P < 0.05) NA, not applicable; NS, not significant.
ScvO2 showed higher values than SvO2 all through our study [Table 3]. Data showed perfect positive statistically significant correlation between SvO2 and ScvO2 at all study times, individual MOD between both the readings at study time showed MOD of 1.34 and 1.44 at T1 and T2 simultaneously, this MOD was statistically insignificant; but after bypass was initiated, MOD was 5.2 and 4.4 at T3 and T4 with high statistical significance; after bypass MOD continues to have high statistical significance, it was 6.3 at T5 and at T6 it was 4.6 [Table 3].
Table 3.
Correlation between SvO2 and ScvO2 at the different data points
| SvO2 | ScvO2 | MOD | P value (t test) | Correlation coefficient (r) | P (F test) | |
|---|---|---|---|---|---|---|
| T1 | 80.98 ± 5.26 | 82.32 ± 6.035 | 1.34 | 0.2140 | 0.752 | 0.001 |
| T2 | 82.93 ± 5.17 | 81.5 ± 3.47 | 1.43 | 0.1760 | 0.7914 | <0.0001 |
| T3 | 78.1 ± 6.31 | 83.3 ± 5.31 | 5.2 | <0.0005 | 0.6301 | 0.0099 |
| T4 | 80.8 ± 6.1 | 85.2 ± 4.93 | 4.4 | 0.0017 | 0.687 | 0.0009 |
| T5 | 79.12 ± 5.91 | 85.42 ± 6.3 | 6.3 | <0.001 | 0.7901 | 0.0001 |
| T6 | 76.7 ± 5.96 | 81.3 ± 5.67 | 4.6 | 0.0018 | 0.6901 | 0.0117 |
Data are expressed as mean ± SD, significant (P < 0.05).
DISCUSSION
In the present study, blood was taken from the RA to be representative of whole body central venous blood. Presumably, this position placed the ScvO2 sampling site sufficiently distal into the RA to allow for the mixing of blood from the superior and inferior venacavae.
Results showed a lower value of SvO2 compared to ScvO2, a possible explanation for the decrease in SO2 from ScvO2 to SvO2 is the myocardial extraction of O2 as blood flows through the right ventricle into the PA. Although, to our knowledge, the rate of O2 diffusion from ventricular blood into the myocardium has not been quantified, we consider this possibility unlikely. A more likely hypothesis is that atrial blood, as it moves toward the PA, mixes with blood of lower O2 content. It is also possible that decrease in SvO2 resulted from blood mixing with blood draining from coronary sinus in RA and the Thebesian veins in the right ventricle.[10]
Experimental studies in animals showed an excellent correlation between ScvO2 and SvO2 . Reinhart et al.[11] found a Spearman correlation coefficient of 0.97 in anesthetized dogs over a broad range of cardio-respiratory conditions, including hypoxia, hemorrhage, and resuscitation. Schou et al.[12] also found a correlation coefficient of 0.97 between ScvO2 and SvO2 in pigs that had been subjected to conditions of graded hypoxemia. Of note, both studies found SvO2 to be consistently lower than ScvO2.
Our data showed perfect positive statistically significant correlation between SvO2 and ScvO2 at all data points [Table 3 and Figure 1 a–f].
Figure 1.
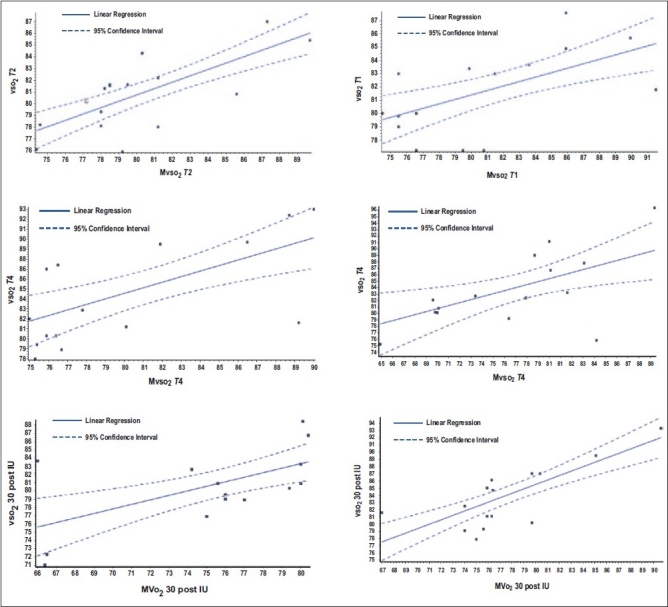
The correlation between SvOm2 and ScvO2 in all data points
In the present study, individual mean of difference between both the readings at data points showed MOD of 1.34 and 1.44 at T1 and T2 simultaneously. This MOD was statistically insignificant, meaning that they are interchangeable numerically; but after bypass was initiated, MOD was 5.2 and 4.4 at T3 and T4 with high statistical significance. In the ICU; MOD continues to have high statistical significance, MOD was 6.3 at T5 and 4.6 at T6. The poor agreement between the values of SvO2 and ScvO2 after initiation of cardiopulmonary bypass presented here may be secondary to the acute changes in hemodynamics accompanying the shift to CPB with hemodilution and the nonpulsatile flow pattern. Moreover, catheter position might be altered while cannulating the RA for bypass and by myocardial manipulation during surgery. This agrees with other studies[13,14] comparing measures of ScvO2 and SvO2 in critically ill patients. Similarly, poor agreement results appeared with other studies comparing SvO2 and ScvO2 in hemodynamically unstable patients. These studies were performed outside the context of cardiac surgery, with heterogeneous groups of patients in septic,[15] cardiogenic,[16] and neurogenic shock,[17] and all of them reported a poor agreement between SvO2 and ScvO2 individual values. Schmitz et al.[17] showed also that patients with normal cardiac index values, ScvO2, could not be substituted for SvO2 after cardiac surgery with cardiopulmonary bypass.
In our previous study,[8] we found the same pattern of oxygen saturation reduction while the blood moves from RA to the PA and a positive correlation between the readings obtained from the measured samples, but we could not find relation between RA and PA data.
Limitations of the study
In spite of the care taken to have the PAC positioned accurately, its position is bound to be altered by the insertion of atrial cannulae for bypass, and by cardiac mobilization during surgery.
CONCLUSIONS
In CABG patients; ScvO2 and SvO2 are not interchangeable numerically as they have failed to keep insignificant MOD when normothermic CPB was used, but had strong positive and significant correlations throughout the operative course. This makes ScvO2 useful in the meaning of trend; these data suggest that ScvO2 is equivalent to SvO2 in the course of clinical decisions as long as absolute values are not required.
Acknowledgments
We gratefully acknowledge the technical assistance of Mr. M Akbar Khan, Chief Cardiac Anesthesia Technician, King Fahad Cardiac Center, King Saud University, Riyadh, KSA, and Mr. Hasan Abo Kishk, Cardiac Anesthesia Technician, King Fahad Cardiac Center, King Saud University, Riyadh, KSA.
Footnotes
Source of Support: Nil
Conflict of Interest: None declared.
REFERENCES
- 1.O‘Connor JP, Townsend GE. Perioperative continuous monitoring of mixed venous oxygen saturation should be routine during high-risk cardiac surgery. J Cardiothorac Anesth. 1990;4:647–50. doi: 10.1016/0888-6296(90)90416-d. [DOI] [PubMed] [Google Scholar]
- 2.Pölönen P, Ruokonen E, Hippeläinen M, Pöyhönen M, Takala J. A prospective, randomized study of goal-oriented hemodynamic therapy in cardiac surgical patients. Anesth Analg. 2000;90:1052–9. doi: 10.1097/00000539-200005000-00010. [DOI] [PubMed] [Google Scholar]
- 3.Nelson LD. Continuous venous oximetry in surgical patients. Ann Surg. 1986;203:329–33. doi: 10.1097/00000658-198603000-00020. [DOI] [PMC free article] [PubMed] [Google Scholar]
- 4.McGrath RB. Invasive bedside hemodynamic monitoring. Prog Cardiovasc Dis. 1986;29:129–44. doi: 10.1016/0033-0620(86)90022-8. [DOI] [PubMed] [Google Scholar]
- 5.Ducatman BS, McMichan JC, Edwards WD. Catheter-induced lesions of the right side of the heart.A one-year prospective study of 141 autopsies. JAMA. 1985;253:791–5. [PubMed] [Google Scholar]
- 6.McArthur CJ. Cardiovascular monitoring in sepsis: Why pulmonary artery catheters should not be used. Crit Care Resusc. 2006;8:256–9. [PubMed] [Google Scholar]
- 7.Djaiani G, Karski J, Yudin M, Hynninen M, Fedorko L, Carroll J, et al. Clinical outcomes in patients undergoing elective coronary artery bypass graft surgery with and without utilization of pulmonary artery catheter-generated data. J Cardiothorac Vasc Anesth. 2006;20:307–10. doi: 10.1053/j.jvca.2006.02.021. [DOI] [PubMed] [Google Scholar]
- 8.Ibrahim O, Alshaer A, Elegued MA, Sheta S. Correlation between mixed venous and central venous oxygen saturation in patients undergoing CABG. Egypt Heart J. 2009;61:2. [Google Scholar]
- 9.Edwards JD, Mayall RM. Importance of the sampling site for measurement of mixed venous oxygen saturation in shock. Crit Care Med. 1998;26:1356–60. doi: 10.1097/00003246-199808000-00020. [DOI] [PubMed] [Google Scholar]
- 10.Scheinman MM, Brown MA, Rapaport E. Critical assessment of use of central venous oxygen saturation as a mirror of mixed venous oxygen in severely ill cardiac patients. Circulation. 1969;40:165–72. doi: 10.1161/01.cir.40.2.165. [DOI] [PubMed] [Google Scholar]
- 11.Reinhart K, Kuhn HJ, Hartog C, Bredle DL. Continuous central venous and pulmonary artery oxygen saturation monitoring in the critically ill. Intensive Care Med. 2004;30:1572–8. doi: 10.1007/s00134-004-2337-y. [DOI] [PubMed] [Google Scholar]
- 12.Schou H, Perez de Sá V, Larsson A. Central and mixed venous blood oxygen correlate well during acute normovolemic hemodilution in anesthetized pigs. Acta Anaesthesiol Scand. 1998;42:172–7. doi: 10.1111/j.1399-6576.1998.tb05104.x. [DOI] [PubMed] [Google Scholar]
- 13.Krafft P, Steltzer H, Hiesmayr M, Klimscha W, Hammerle AF. Mixed venous oxygen saturation in critically ill septic shock patients.The role of defined events. Chest. 1993;103:900–6. doi: 10.1378/chest.103.3.900. [DOI] [PubMed] [Google Scholar]
- 14.Pölönen P, Ruokonen E, Hippeläinen M, Pöyhönen M, Takala J. A prospective, randomized study of goal-oriented hemodynamic therapy in cardiac surgical patients. Anesth Analg. 2000;90:1052–9. doi: 10.1097/00000539-200005000-00010. [DOI] [PubMed] [Google Scholar]
- 15.Faber T. Central venous versus mixed venous oxygen content. Acta Anaesthesiol Scand Suppl. 1995;107:33–6. doi: 10.1111/j.1399-6576.1995.tb04327.x. [DOI] [PubMed] [Google Scholar]
- 16.Lee J, Wright F, Barber R, Stanley L. Central venous oxygen saturation in shock: A study in man. Anesthesiology. 1972;36:472–8. doi: 10.1097/00000542-197205000-00012. [DOI] [PubMed] [Google Scholar]
- 17.Lequeux PY, Bouckaert Y, Sekkat H, Van der Linden P, Stefanidis C, Huynh CH, et al. Could central venous oxygen saturation be an attractive alternative to mixed venous oxygen saturation in cardiac surgery with cardiopulmonary bypass. Eur J Anaesthesiol. 2005;22:A74. doi: 10.1097/EJA.0b013e3283315ad0. [DOI] [PubMed] [Google Scholar]