

Abstract
Many siderophores used for the uptake and intracellular storage of essential iron contain hydroxamate chelating groups. Their biosyntheses are typically initiated by hydroxylation of the primary amine side chains of l-ornithine or l-lysine. This reaction is catalyzed by members of a widespread family of FAD-dependent monooxygenases. Here the kinetic mechanism for a representative family member has been extensively characterized by steady state and transient kinetic methods, using heterologously expressed N5-l-ornithine monooxygenase from the pathogenic fungus Aspergillus fumigatus. Spectroscopic data and kinetic analyses suggest a model in which a molecule of hydroxylatable substrate serves as an activator for the reaction of the reduced flavin and O2. The rate acceleration is only ∼5-fold, a mild effect of substrate on formation of the C4a-hydroperoxide that does not influence the overall rate of turnover. The effect is also observed with the bacterial ornithine monooxygenase PvdA. The C4a-hydroperoxide is stabilized in the absence of hydroxylatable substrate by the presence of bound NADP+ (t½ = 33 min, 25 °C, pH 8). NADP+ therefore is a likely regulator of O2 and substrate reactivity in the siderophore-associated monooxygenases. Aside from the activating effect of the hydroxylatable substrate, the siderophore-associated monooxygenases share a kinetic mechanism with the hepatic microsomal flavin monooxygenases and bacterial Baeyer-Villiger monooxygenases, with which they share only moderate sequence homology and from which they are distinguished by their acute substrate specificity. The remarkable specificity of the N5-l-ornithine monooxygenase-catalyzed reaction suggests added means of reaction control beyond those documented in related well characterized flavoenzymes.
Keywords: Antibiotics, Flavin, Fungi, Iron Metabolism, Oxidase
Introduction
Pathogenic microbes have evolved a range of strategies for co-opting, transporting, and storing the iron they scavenge from their hosts (1, 2). Central to iron trafficking in many microbes are siderophores, small molecular weight secondary metabolites that competitively chelate and repackage host iron for uptake and/or intracellular storage by the pathogen (3, 4). Structural diversity in siderophores is important for their specific recognition by membrane transporters (4, 5). The iron-ligating portions themselves, however, are far less diverse. Siderophores most often contain one of three bidentate chelating moieties: hydroxamate, catecholate, or α-hydroxycarboxylate.
Hydroxamate-dependent siderophores have special significance in pathogenic contexts. First, they are not bound by siderocalins, mammalian immunoproteins that selectively trap and thereby remove catecholate siderophores from circulating blood (6, 7). Hydroxamates are consequently associated with virulent forms of many bacteria, although they are usually weaker iron-binders than catecholates (7–11). Second, hydroxamate siderophores are acutely important to pathogenic fungi, which are not known to make catecholate or other types of chelating moieties. Many fungi, lacking ferritin, use variants of the same hydroxamate siderophore for both uptake and subsequent intracellular trafficking and storage functions (12–14). For viability and virulence, Aspergillus species, including deadly strains of Aspergillus fumigatus, have been shown to depend on functional pathways for biosynthesis of ferricrocin and fusarinine, siderophores involved in extracellular iron uptake and intracellular storage. Significantly, reductive pathways for mobilizing host iron, identified in some fungi, cannot compensate for the lost siderophore in many Aspergillus species (15–17).
Hydroxamate biosynthesis is therefore an attractive target for medicinally controlling A. fumigatus and possibly other pathogenic species. Antifungal targets are critically needed in light of recent sharp increases in hospital-associated infections, a paucity of effective treatments, and the consequent high mortality associated with invasive forms of Aspergillus (18–21). Iron trafficking compounds are often proposed for antimicrobial targeting in principle, but specific molecular targets have been difficult to identify in practice (22). Many pathogens, for example, have multiple iron uptake pathways; if one is inhibited, another may or may not compensate. However, recent work demonstrated that Mycobacterium tuberculosis cultures are susceptible to picomolar levels of chemical inhibitors of MbtA, an enzyme catalyzing biosynthesis of the aryl cap of mycobactin siderophores (23–25). Like Aspergillus sp., mycobacteria have been predicted to depend on variants of the same siderophore for multiple steps in the uptake, internalization, and storage of iron and hence may be especially susceptible to chemical inhibition of mycobactin biosynthesis.
The biosynthesis of siderophores by A. fumigatus begins with the hydroxylation of l-ornithine (l-Orn),2 which is the first committed step (Scheme 1). This reaction is catalyzed by l-ornithine monooxygenase (OMO), a flavin-adenine dinucleotide (FAD)-dependent enzyme. l-Lysine monooxygenase, the first described siderophore-associated monooxygenase (SMO), was initially identified by McDougal and Nielands (26) as part of the aerobactin biosynthesis operon. More recently, it was recognized that homologs of OMO and lysine monooxygenase are found in dozens of siderophore biosynthesis gene clusters (27).
SCHEME 1.

Fusarinine biosynthesis, with initiating step catalyzed by OMO.
The SMOs have only moderate global homology with the well characterized families of flavin-dependent monooxygenases, such as the hepatic microsomal flavin-containing monooxygenases (FMOs), nucleophilic Baeyer-Villiger monooxygenases (BVMOs), and aromatic hydroxylases (28–31). The FMO and BVMO families share a similar domain organization with the siderophore-associated monooxygenases and with the functionally related amine-hydroxylating YUCCA enzymes from plants (32). These all have FAD- and NADPH-binding sequence motifs (associated with Rossmann folds) near the N termini and the centers of their sequences as well as a hydrophobic region near their C termini. Phylogenetic analysis places the SMOs nearest the FMO and BVMO families but within a novel subclass (33). However, among the flavin monooxygenases, the SMOs serve chemically distinct roles, being involved in biosynthetic rather than degradative processes. They almost certainly require unique ways of promoting highly substrate-specific hydroxylations. Early work on aerobactin biosynthesis established that SMOs have remarkable specificity for their substrates (e.g. they can discriminate between l-lysine and l-ornithine, molecules that differ only by one methylene unit) (34–41).
Prior work with a bacterial OMO (PvdA) by Lamb and co-workers (35, 42) led to the conclusion that PvdA might have mechanistic differences from the cohort of known FAD-dependent monooxygenases. This report provides the most detailed kinetic mechanistic studies, including both steady state and transient kinetic data, for any enzyme in the widespread SMO family. These data and information about the chemical mechanism that were derived spectroscopically allow us to suggest how this class of enzyme controls access of hydroxylatable substrates and O2 to the active site and to begin to devise inhibition strategies that may have medicinal value.
EXPERIMENTAL PROCEDURES
Standard Methods, Chemicals, and Equipment
All solvents and reagents were obtained from commercial sources and used without further purification unless otherwise stated. α-N-Benzyloxycarbonyl-l-ornithine (1; see supplemental Scheme S1) was purchased from Chem-Impex. meta-Chloroperoxybenzoic acid (ACROS, technical grade) was dried under vacuum over P2O5 until m.p. >90 °C before use. Benzaldehyde (Fisher) was filtered through basic alumina and distilled before use. Molecular biology reagents were from New England Biosciences. An Eppendorf PCR thermocycler was used for PCRs. Spectrophotometric and steady state-kinetic measurements were made using a Varian Cary 50 spectrophotometer equipped with a Peltier-style thermostat. Additional steady state kinetic measurements were made using a Clark-type O2 electrode (Yellow Springs Instruments). Transient kinetics were measured using a Hi-Tech Scientific DX-2 stopped flow spectrometer with diode array or photomultiplier tube detection, as described in further detail below. All reactions were carried out in 100 mm Tris-SO4 buffer at pH 8, unless otherwise noted. Protein concentrations were routinely measured by the Bradford assay. Ultrapure Milli-Q water was used in the preparation of all reagents. All data plots shown in the paper were produced using Kaleidagraph. Data fits by non-linear regression were produced by the same software for the steady state data and by KinetAssyst for the stopped-flow data.
1H NMR and 13C NMR spectra were obtained on a 600-MHz Varian DirectDrive spectrometer, and free induction decays were processed using ACD/ChemSketch version 10.04. Chemical shifts (δ) are given in ppm and are referenced to residual solvent. Coupling constants (J) are reported in Hz. High resolution, accurate mass measurements were obtained with a Bruker microTOF II electrospray ionization time-of-flight mass spectrometer in positive ion mode. Sample was introduced via flow injection at a rate of 4 μl/min, and mass spectra were accumulated from 50–3000 m/z for 2 min. Infrared spectra were recorded on a Thermo Nicolet IR200 FT-IR, and signals are reported as wave numbers in reciprocal centimeters (cm−1). Specific rotations were measured with a Rudolf Research Autopol III polarimeter at 589 nm and 20 °C. Melting points were determined in capillary tubes using a Thomas Hoover melting point apparatus and are uncorrected. Elemental microanalyses were performed by Midwest Microlab, LLC (Indianapolis, IN) and are reported as percentages relative to the total mass of material.
Cloning and Engineering of sidA
Genomic DNA from A. fumigatus was received as a gift from Dr. Ute Möllmann of the Hans Knöll Institute (Jena, Germany). The sidA gene encoding OMO (accession AY819708) contains one intron that was removed for recombinant expression in E. coli. The exons were amplified in separate PCRs from genomic DNA. The forward primer for exon 1 (5′-GGCTCTCATATGGAATCTGTTGAACGG-3′) included an NdeI site (underlined). The reverse primer was 5′-GGTTGAAGATCTCATTCACAAAAGGCGAGTCGTCACTG-3′. Another forward primer (5′-CAGTGACGACTCGCCTTTTGTGAATGAGATCTTCAACC-3′) was utilized for exon 2; the reverse primer (5′-CTCGAGTTATTACAGCATGGCTCGTAG-3′) includes an XhoI site (underlined). A mixture of the two exons served as the DNA template in a subsequent PCR, with the intron-free fragment (1561 base pairs) as the product. The amplified fragment was digested with NdeI and XhoI and ligated into complementary sites on the pET15b plasmid (AmpR, Novagen). The resultant plasmid encodes the sidA cDNA with a thrombin-cleavable, N-terminal 6-histidine tag. The plasmid was transformed into the Rosetta 2 (DE3) E. coli strain (Novagen) for overexpression of the OMO protein.
Overexpression and Purification of OMO
Cultures were grown on an Innova shaker incubator (220 rpm) in Fernbach flasks containing LB medium (1.5 liters) supplemented with 100 μg/ml ampicillin at 30 °C. The cells were harvested after 30 h by centrifugation (6000 × g, 10 min, 4 °C). The cell pellet was resuspended in 4 ml/g pellet of column binding buffer (100 mm Tris-SO4, pH 7.4, 500 mm NaCl, and 50 mm imidazole). Cells were sonicated (Branson Ultrasonifier), and the debris was removed by centrifugation (17,000 × g, 50 min, 4 °C). The supernatant was sterile-filtered and applied to a column packed with 10 ml of Ni2+-Sepharose high performance (GE Healthcare) resin pre-equilibrated with Ni2+ ions and washed in binding buffer. The filtered lysate was passed over the resin (4 °C), and the column was washed with 10 column volumes of binding buffer and eluted in a gradient of 0–800 mm imidazole in binding buffer. The most active fractions were collected and concentrated in an Amicon Ultra-15 centrifugal filter device (30,000 molecular weight cut-off). The protein was further purified and buffer-exchanged on a 300-ml Sephacryl S-200 high resolution (GE Healthcare) gel filtration column run at 0.4 ml/min. The protein solution was then concentrated in an Amicon Ultra-15 centrifugal filter device (30,000 molecular weight cut-off) to >2 mg/ml and flash-frozen with liquid N2 for storage at −80 °C. Protein concentrations were routinely determined by the Bradford assay. Bound FAD was determined as described below.
Analytical Gel Filtration
Analytical gel filtration used a Sephacryl S-200 high resolution (GE Healthcare) column (26 mm × 60 cm) equilibrated with 100 mm Tris-SO4 buffer, pH 8.0. A standard curve was generated using gel filtration standard (Bio-Rad) consisting of protein aggregates (void peak), thyroglobulin (bovine; Mr = 670,000), γ-globulin (bovine; Mr = 158,000), ovalbumin (chicken; Mr = 44,000), myoglobin (horse; Mr = 17,000), and vitamin B-12 (Mr = 1350).
Quantification of Bound Flavin
Denaturant (0.1% SDS from 10% stock) was incubated with a sample of enzyme for which a spectrum had been measured. Spectra were taken until no changes were observed, the sample was centrifuged in a microcentrifuge filter (molecular weight cut-off = 10,000) to near dryness, and the spectrum of the flow-through was recorded. The molar amount of released FAD was determined using λmax and ϵ values for free/aqueous oxidized FAD (λmax = 450, ϵ = 11,300 m−1 cm−1) (43).
Influence of Halides on the Reaction
Because the amino acid substrate was supplied as the chloride salt and the hydroxyornithine product as the dibromide (see below), the possible dependence of the measured rates on [Cl−] and [Br−] was determined. The initial velocity of NADPH oxidation by OMO was monitored spectrophotometrically at fixed, subsaturating concentrations of l-Orn (1 mm, ∼2 × Km) and NADPH (75 μm) in air. Subsaturation in the substrate would permit competition between it and the halide. Halide concentrations in the reactions were varied over 160 μm to 1.0 m, and dose-response curves were generated.
Equilibrium Binding of NADP+
The dissociation constant for NADP+ to the oxidized enzyme was determined by optical titration. Fractional equivalents of NADP+ were added to enzyme. To account for the possibility of slow equilibration, spectra were recorded for several minutes until no further changes were observed. Following corrections for dilution, changes in absorbance at the spectral region of maximal difference were plotted versus [titrant] and fit to a quadratic equation (see supplemental Fig. S3).
Steady State Kinetic Studies
All reactions were initiated with enzyme, in the absence of added FAD. Rates were referenced to the concentration of flavin-containing enzyme subunit, where the FAD titer was determined as described above. Reactions were monitored continuously via the oxidation of NADPH or the consumption of O2. The reactions used to determine the steady state mechanism were carried out at 37 °C.
Oxygen consumption was measured using a Clark-type O2 electrode equilibrated to 37 °C for ∼1 h and calibrated to the dissolved [O2] in air-saturated water at the given atmospheric pressure. Desired O2 concentrations were obtained via first mixing O2 and N2 gases and then equilibrating the samples to those gas concentrations by purging the enclosed headspace for 3 min, followed by a 2-min equilibration of the solution in contact with the probe (headspace gas was displaced by the probe). The oxygen probe was used to measure the actual [O2]. Reaction volumes were 1.6 ml, enzyme was added via a gas-tight syringe, and continuous mixing was provided from a magnetic stirrer. Additionally, NADPH was essentially held constant throughout the reaction with the use of an enzymatic system for continuous regeneration of NADPH (11 units of glucose 6-phosphate dehydrogenase and 4 mm glucose 6-phosphate) (44). NADPH oxidation was monitored via UV-visible spectrophotometry (ϵNADPH,340 nm = 6220 cm−1 m−1). The enzyme was added to a cuvette, and the spectrophotometer was zeroed at 340 nm. NADPH was added and mixed by pipetting (final volume, 160 μl). The slow NADPH oxidase activity of OMO was monitored for 10 s, and the reaction was initiated by adding a small volume of l-Orn stock (HCl salt, Sigma). Rates were determined from linear regression fits to the initial linear portion of the curves. Initial rate measurements were performed in triplicate or greater. Average values are plotted with ± 1 S.D. as the error bar.
Kinetic parameters were determined from plots of initial rate (vi) versus substrate concentration fit to the Michaelis-Menten equation, vi/[E] = kcat[S]/(Km + [S]), where [E] represents the concentration of FAD-bound subunit. In order to obtain the most unbiased fit results, unweighted curves were fit by nonlinear regression to the full collection of data points, with three replicates at each [S] (45, 46). Errors reported in values for kcat or Km are sums of the least square differences between the computed and actual curves. By examining the dependence of kcat and kcat/Km on the concentration of a fixed variable substrate, it can be established whether the enzyme forms with which the fixed variable substrate and the variable substrate combine are reversibly or irreversibly connected in the kinetic mechanism. If Km/kcat and 1/kcat values vary with 1/[fixed variable substrate], it can be concluded that there is a reversible connection. For an irreversible connection, 1/kcat varies, whereas Km/kcat stays the same. This approach is analogous to traditional linearization of data through double reciprocal plots, where intersecting line patterns indicate a reversible connection between the variable and fixed variable, and parallel line patterns indicate an irreversible connection. However, comparing parameters derived directly from fits to Michaelis plots avoids the errors associated with double reciprocal plots (47).
Rapid Reaction Studies
Reduction of the enzyme by NADPH and reoxidation by O2 in the presence/absence of substrate were studied by stopped-flow spectrophotometric techniques at 25 °C in single and sequential mixing modes. For all experiments, the enzyme was placed inside a gas-tight tonometer and made anaerobic via repeated cycles of evacuation and purging with purified and hydrated argon gas. Solutions before mixing consisted of 20–40 μm FAD-containing enzyme subunit. These were mixed with an equal volume of reactant solution prepared in the same buffer from a second syringe. For anaerobic experiments, the solution in the second syringe was equilibrated with argon via bubbling; alternatively, this solution was equilibrated with air or bubbled with a defined N2/O2 gas mixture.
Reactions with NADPH
The anaerobic reduction of OMO (10 μm enzyme plus 10–200 μm NADPH, final concentrations) was monitored at 440 nm via a photomultiplier tube detector. Additional measurements were made with 200 μm NADPH plus either 200 μm NADP+ or 5 mm (saturating) l-Orn, in order to determine their effect on the reduction rate. For subsequent experiments, reduced enzyme solutions were prepared anaerobically in a tonometer by titrimetric addition of 1 eq of NADPH via a titration syringe.
Reactions of Reduced OMO with O2
All measurements were made using diode array detection. The single mixing mode was initially used to monitor reduced enzyme after mixing with buffer that contained defined concentrations of either O2 alone or O2 and l-Orn in combination. Subsequently, the sequential mixing mode was used for two types of experiments. In the first, NADPH-reduced enzyme was mixed with anaerobic solutions of l-Orn (0.5 and 5 mm). Following a set delay time (≥15 ms), the reaction was mixed with aerated buffer. This type of experiment was used to determine the binding rate of l-Orn. In the second type, NADPH-reduced enzyme and aerated buffer were mixed and incubated for 5 s in order to allow for the formation of the flavin-oxygen reaction intermediate. The resulting solution was mixed with buffers containing various [l-Orn]. Details of individual experiments, including the concentrations used, are given in “Results” (Rapid Kinetic Studies) and figure legends.
Synthesis of l-Orn Derivatives
Amino acid derivatives 2–5 (supplemental Scheme S1) were prepared according to a literature protocol. All characterization data matched the previously reported data (48).
N5-Hydroxy-l-ornithine Dihydrobromide (6)
Hydroxylamine 5 (400 mg, 1.26 mmol) was dissolved in a mixture of 33% (w/v) hydrogen bromide-acetic acid (10 ml) and stirred for 1.5 h at room temperature. The product was precipitated as an off-white solid by the slow addition of diethyl ether (50 ml). The solid was washed several times with diethyl ether and then dissolved in water (50 ml) and washed with diethyl ether (2 × 25 ml). The water was removed using high vacuum rotary evaporation (1 mm Hg), which gave 6 as a hydroscopic white foam (363 mg, 93%): 1H NMR (600 MHz, CD3OD, δ) 4.09 (t, J = 6.08 Hz, 1H), 3.33 (t, J = 7.38 Hz, 2H), 2.11–1.90 (m, 4H); 13C-NMR (150 MHz, CD3OD, δ) 171.23, 53.35, 51.27, 28.61, 20.85; IR (KBr): 3427, 2949, 1738, 1617, 1501 cm−1; HRMS-ESI (m/z): [M + H]+ Calcd. for C5H13N2O3, 149.0921; found 149.0929; [α]20D +7.5° (c 0.53, H2O).
N5-Hydroxy-l-ornithine Monohydrobromide (7)
The dihydrobromide salt 6 (150 mg, 0.484 mmol) was dissolved in water (1.0 ml), and the solution was adjusted to pH 4.5 with pyridine. The water was removed using high vacuum rotary evaporation (1 mm Hg), which gave a clear oil. The oil was dissolved in methanol, and after the addition of diethyl ether, the monohydrobromide salt 7 precipitated as a white solid (105 mg, 95%): m.p. 161–164 °C dec (lit. 174–176 °C dec, crystals from water-ethanol); 1H NMR (600 MHz, CD3OD, δ): 3.69 (t, J = 5.72 Hz, 1H), 3.27–3.20 (m, 2H), 1.97–1.81 (m, 4H); 13C NMR (150 MHz, CD3OD, δ): 174.07, 55.22, 51.89, 29.52, 21.36; IR (KBr): 3423, 2987, 2854, 1614, 1544 cm−1; HRMS-ESI (m/z): [M + H]+ Calcd. for C5H13N2O3, 149.0921; found 149.0935; [α]20D +9.6° (c 0.52, H2O); Anal. Calcd. for C5H13BrN2O3: C, 26.22; H, 5.72; N, 12.23. Found: C, 26.03; H, 5.43; N, 11.90.
RESULTS
Protein Characterization
Soluble OMO was overexpressed in E. coli with typical yields of 20 mg of pure protein per liter of culture (supplemental Fig. S1 and Table S1). Bright yellow purified OMO was isolated with ∼0.6 FAD released (per subunit, as determined by Bradford assay) following incubation of the protein with 0.1% SDS. Previously isolated siderophore-associated monooxygenases, by contrast, had almost no bound FAD, consistent with the relatively low measured affinities of those SMOs for FAD: KD = 26 μm (41), 9.9 μm (35), and 30 μm (36). In earlier work with SMOs, 10 eq of FAD were routinely added immediately prior to activity measurements in order to increase the concentration of active enzyme (34–36, 38–41), possibly leading to off-enzyme reactions of free FAD and NADPH.
The UV-visible spectra for free and enzyme-bound FAD were similar in appearance (supplemental Fig. S2), although the extinction coefficient determined for the enzyme-bound FAD (12,500 m−1) is larger than that for the free flavin (11,300 m−1). Analytical gel filtration (against globular protein standards) gave an estimated native molecular mass of 105 kDa, suggesting that, if globular, OMO exists as a homodimer (expressed monomer = 58.9 kDa). The average specific activity over three separate purifications for OMO was 657 ± 55 nmol of NADPH min−1 mg−1 (50 mm Tris-SO4, pH 8, 37 °C). This value is comparable with the specific activity measured for the expressed P. aeruginosa ornithine monooxygenase (528 ± 8 nmol of NADPH min−1 mg−1, 100 mm potassium phosphate, pH 8, 24 °C) (35).
Dissociation Constant for NADP+
The affinity of the oxidized enzyme for NADP+ was determined by spectrophotometric titration. Difference spectra (at 390 nm) were fit to a quadratic equation, yielding KD = 4.6 ± 0.34 μm (supplemental Fig. S3).
Influence of Halides on the Reaction
Some FAD-dependent enzymes, including PvdA (35), are inhibited by halides (49). Moreover, the substrate and product were used as amino acid salts (chloride and dibromide, respectively). In order to assess the possible inhibitory effects of either Cl− or Br−, specific activity was measured in the presence of increasing concentrations of each (potassium salt). Dose-response curves were obtained by plotting the enzyme fractional activity (vi/v0), where vi is the initial velocity in the presence of halide and v0 is velocity in its absence, as a function of log[halide] (supplemental Fig. S4). The resulting plots are sigmoidal in shape. The inflection point of the sigmoidal curve gives the concentration of halide at which activity is reduced by 50% (IC50). Each curve was fit to a sigmoidal function of the form y = ymin + (ymax − ymin)/(1 + (x/IC50)H), where H represents Hill slope. This yielded IC50(Cl−) = 59 mm; IC50(Br−) = 108 mm (50). Hence, neither halide is expected to have an appreciable influence on the reaction at the concentrations used in this study.
Synthesis of N5-Hydroxy-l-ornithine (l-Orn-OH)
The synthesis of N5-hydroxy-l-ornithine (l-Orn-OH) followed an indirect heteroatom oxidation method starting from commercially available α-N-benzyloxycarbonyl-l-ornithine, 1 (supplemental Scheme S1) (48, 51–53). Because full spectroscopic characterization of l-Orn-OH has not been reported, it was isolated and fully characterized as the dihydrobromide salt, 6, and the corresponding monohydrobromide salt, 7 (54, 55). The dihydrobromide salt, 6, was used as the source of l-Orn-OH for all experiments in this report (supplemental Fig. S5 and S6).
Steady State Kinetics of the Forward Reaction
As expected for a monooxygenase, the reaction was essentially irreversible in the forward direction. Km values for each substrate were first estimated at 25 °C from plots of the initial rate (vi/[E], where [E] = [enzyme-bound FAD]) versus [substrate] with the other two substrates at very high concentrations (Table 1). The very low Km values for NADPH and O2 were near the measurable limits using either the UV-visible (NADPH) or polarographic (O2) assays. More accurate values for these numbers (at 37 °C) were derived from replots of 1/kcat values (determined from fits to hyperbolic plots measured at several fixed variable concentrations of a second substrate) against 1/[S]. The x intercept of the 1/kcat replot is 1/Km,S (where S represents fixed variable substrate) and the y intercept gave 1/kcat at an extrapolated infinite concentration of S (Table 1, top). Using the initially measured Km, saturating concentrations for each substrate were set to be ≥10 Km in the experiments described below. Note that air-saturated pure water at 25 °C and 1 atm has an [O2] = 260 μm. Nearly the same [O2] was measured for 50 mm Tris-SO4 buffer, pH 8, at the same temperature.
TABLE 1.
Steady state kinetic parameters for OMO measured at 37 and 25 °C
| Variable substrate | Km | kcat | kcat/Km |
|---|---|---|---|
| m | s−1 | m−1s−1 | |
| Measured at 37 °C | |||
| l-Ornithine | 4.9 ± 0.7 × 10⁻⁴ | 1.7 ± 0.1 | 3.4 ± 0.5 × 10³ |
| NADPH | 4.6 ± 0.5 × 10⁻⁶ | 1.9 ± 0.4 | 4.2 ± 0.5 × 10⁵ |
| O2 | 1.8 ± 0.1 × 10⁻⁵ | 1.9 ± 0.1 | 1.1 ± 0.1 × 10⁵ |
| Measured at 25 °C | |||
| l-Ornithine | 5.8 ± 0.4 × 10⁻⁴ | 0.611 | 1.1 ± 0.1 × 10³ |
| NADPH | 2.6 ± 0.6 × 10⁻⁶ | 0.599 | 2.3 ± 0.5 × 10⁵ |
| O2 | 1.6 ± 0.1 × 10⁻⁵ | 0.614 | 3.8 ± 0.5 × 10⁴ |
In order to determine the nature and order of substrate interactions with the enzyme, initial rates were plotted as a function of the concentration of one of the substrates at each of several fixed concentrations of the second substrate with the third substrate fixed at an essentially saturating concentration. Each of the plots was fit to the Michaelis-Menten equation (supplemental Figs. S7–S10). Values for Km, kcat, and Km/kcat (and their associated errors) from the fit to each plot are tabulated in supplemental Tables S2–S5, and the conclusions are summarized here. When [NADPH] was varied and O2 was the fixed variable ([l-Orn] was fixed at the saturating concentration of 13 mm), the resulting double reciprocal plots appeared parallel; however, the relationship among the measured values of Km,NADPH/kcat was difficult to determine accurately due to the low Km,NADPH and the rapid initial rates (supplemental Fig. S7 and Table S2). The value for 1/kcat clearly increases with 1/[O2]. When the same data were measured in the presence of a fixed, subsaturating [l-Orn] (0.6 mm), the measured values of Km,NADPH/kcat clearly increased with 1/[O2] (supplemental Fig. S8 and Table S3). Hence, NADPH and O2 appeared to react with irreversibly connected forms of enzyme when l-Orn is saturating, and this changes to reversibly connected enzyme forms in the presence of subsaturating l-Orn. These results are consistent with a sequential mechanism with NADPH reacting with the enzyme (to reduce the flavin), followed by the binding of [l-Orn] and then O2. Alternatively, l-Orn and O2 could react randomly with the enzyme following its reaction with NADPH. In the latter case, saturation with l-Orn would enforce the NADPH, l-Orn, O2 order and, as in the sequential case, cause the other two substrates to appear irreversibly connected.
When [l-Orn] was varied, [NADPH] was the fixed variable, and O2 was saturating (air), the resulting values of Km,l-Orn/kcat decreased, and 1/kcat increased with 1/[NADPH] (supplemental Fig. S9 and Table S4). This indicates that the two varied substrates bind enzyme forms that are reversibly connected in the reaction. The fact that at saturating concentrations of O2 there was not a parallel pattern suggests that O2 is either the first or (more likely) last substrate to add or that the enzyme form to which it adds is irreversibly separated from the NADPH- and l-Orn-combining forms. Because Km,l-Orn/kcat also decreased with 1/[O2] at saturating NADPH (supplemental Fig. S10 and Table S5), the O2- and l-Orn-combining enzyme forms must also be reversibly connected. Collectively, the data indicate that the substrates most likely add sequentially in the order NADPH, l-Orn, and O2, a conclusion further corroborated below. Steady state patterns and conclusions are listed in Table 2.
TABLE 2.
Summary of steady state kinetic patterns observed for substrate interactions
Dead End and Product Inhibition
True product inhibition occurs when the product combines with the product-releasing enzyme form and backs up the forward reaction, altering the steady state concentrations of the various reactive enzyme forms. By contrast, when a product simply mimics and thereby competes with its cognate substrate, pure competitive dead end inhibition is observed. Saturation in the cognate substrate eliminates the dead end inhibitory effect. If a product acts as both a dead end and product inhibitor, it should bind to both the product-releasing and cognate substrate-binding enzyme forms. Saturation in the cognate substrate in that case should eliminate dead end but not product inhibition.
We sought first to determine whether NADP+ acts as a dead end inhibitor relative to NADPH, as a product inhibitor, or both. When NADP+ was used as a fixed variable inhibitor against NADPH ([l-Orn-OH] = 0, O2 saturating, and l-Orn (5 mm) saturating), a pure competitive pattern was clearly observed, indicating that NADP+ and NADPH bind exclusively to the same enzyme form (supplemental Fig. S11). This result is consistent with NADP+ being the last product to leave the enzyme and NADPH the first to add, such that both species bind to the oxidized enzyme (Scheme 2, species 1). If a second, product-releasing enzyme form could also reversibly bind NADP+ (e.g. the FAD-C4a-hydroxide that is converted to E-FADox by dehydration; Scheme 2, species 6), a noncompetitive pattern would have been observed.
SCHEME 2.

Kinetic mechanism for OMO.
Inhibition by l-Orn-OH is likewise purely competitive (KI = 475 μm; Table 3) with the cognate l-Orn substrate ([NADP+] = 0, O2 = air saturation, and [NADPH] ≥ 10Km) (supplemental Fig. S12B). These measurements were carried out by monitoring spectrophotometrically for NADPH disappearance. Slope and intercept replots (Km/kcat and 1/kcat versus [l-Orn-OH]) in this case were linear. The simplest interpretation of these results is that competition between l-Orn and l-Orn-OH occurs via a single site on the same enzyme form under the given conditions, presumably the E-FADred(NADP+) complex (Complex 1).
TABLE 3.
Summary of product inhibition patterns and inhibition constants
| Variable | Product inhibitor | Conditions | Pattern/Mode | KIia (αKIs) | KIsa | Figure |
|---|---|---|---|---|---|---|
| μm | μm | |||||
| NADPH | NADP+ | 6 mml-ornithine, air O2 | Competitive/Intersecting on y axis | NAb | 156.5 ± 11.8 | S11A |
| l-Orn | NADP+ | 70 μm NADPH, air O2 | Uncompetitive/Parallel | 343.6 ± 18.6 | NA | S11B |
| l-Orn | l-Orn-OH | 150 μm NADPH, air O2 | Competitive/Intersecting on y axis | NA | 474.5 ± 83.3 | S12A |
| NADPH | l-Orn-OH | 1.5 mml-ornithine, air O2 | Uncompetitive/Parallel | 1433.2 ± 36.4 | NA | S12B |
a Inhibition constants for the intercepts (Kii) and the slopes (Kis) were determined by taking the horizontal intercept of linear replots of the intercepts and slopes against inhibitor concentration.
b NA, not applicable.
COMPLEX 1.

When l-Orn is at 3Km (1.5 mm), uncompetitive inhibition by l-Orn-OH against varied [NADPH] is observed (supplemental Fig. S12B) with KI = 1400 μm (Table 3). Therefore, under these conditions, l-Orn-OH binds an enzyme form that is not reversibly connected to the NADPH-binding form (i.e. neither E-FADox nor the E-FADred(NADP+) complex). l-Orn-OH therefore appears to be able to interact with two forms of the enzyme. The higher affinity interaction (with E-FADred(NADP+)) appears to be mostly saturated with l-Orn when [l-Orn] = 1.5 mm, and was consequently not evident in the NADPH/l-Orn-OH inhibition experiments. The lower affinity site is also not apparent in the l-Orn/l-Orn-OH experiments, possibly because the two values for KI are close in magnitude (∼0.5 mm and 1.4 mm). It is unclear from these experiments which enzyme form is responsible the lower affinity l-Orn-OH/enzyme interaction. However, because the l-Orn hydroxylation step is probably not reversible, it is unlikely that l-Orn-OH binds the product-releasing form to bring about reversal of the reaction and true product inhibition. l-Orn-OH more likely inhibits the enzyme via binding to some other enzyme form, which we propose is the C4a-hydroperoxide (see below).
NADPH Oxidase Activity
Slow NADPH Oxidase activity was observed in the absence of l-Orn. This occurred with a measured kcat = 0.90 min−1 or 0.015 s−1 (25 °C, pH 7.4). Km values were below the estimated threshold for which either could be measured by UV-visible or O2-electrode methods Km(O2) ≤ 10 μm; Km,NADPH ≤ 5 μm (data not shown).
Rapid Kinetic Studies of OMO with NADPH
Anaerobic samples of oxidized OMO (10 μm FAD) were reduced with a large stoichiometric excess of NADPH (200 μm final concentration, also anaerobic) in the stopped-flow instrument in order to determine the pseudo-first order rate constant for the reduction (Fig. 1). After a lag time that may correspond to NADPH associating with the enzyme, conversion to the reduced form was observed via the loss of absorbance due to oxidized flavin (i.e. at 450 nm). A rate constant kobs = 0.67 s−1 for reduction was determined by fitting a sum of two exponentials to the curve, where the first exponential function is for the lag and the second is for the reduction. The value for reduction was very close to the turnover number for the complete reaction measured at 25 °C (kcat = 0.6 s−1, 25 °C; Table 1 (bottom) and Scheme 2). The rate constant and the apparent first order character of the reaction were unchanged when lower and even slightly substoichiometric (compared with FAD) amounts of NADPH were used. The lack of a response to changes in [NADPH], even when slightly less than 1 eq is used, suggests that the Kd for oxidized enzyme/NADPH is very small relative to the [NADPH] used and can be estimated as ≤ 1 μm. The rate of reduction was also measured in the presence of a saturating amount (5 mm) of l-Orn and 100 mm NADPH. l-Orn had minimal effects on the reduction. The reaction and equation below describe the interactions.
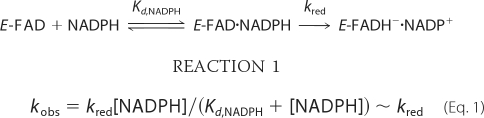 |
FIGURE 1.

Reduction of OMO by NADPH. The reaction mixture contained 10 μm enzyme at 25 °C. Absorbance was measured in photomultiplier mode at 450 nm, and traces were fit to the sum of two exponentials. Observed rates were 0.58, 0.67, and 0.60 s−1 at 10 (long dashed line), 100 (solid line), and 200 (short dashed line) μm NADPH, where the trace at 100 μm NADPH contained 5 mm l-ornithine.
Rapid Kinetic Studies of the Reaction of Reduced OMO with O2 in the Absence of l-Orn
The formation and decay of the hydroperoxide intermediate were both monitored by stopped-flow UV-visible spectroscopy. A two-peaked spectrum with a λmax near 450 nm is characteristic of oxidized flavin on the enzyme. Reduction of the enzyme with 1 eq of NADPH causes the yellow sample to turn clear, leading to a relatively featureless spectrum (data not shown). Anaerobic samples of OMO (10–20 μm FADH−) reduced with stoichiometric quantities of NADPH were mixed with buffer that had been equilibrated with various concentrations of O2. The C4a-hydroperoxide (typically monitored at 370 nm) was subsequently seen to form relatively slowly (Fig. 2), with a kobs that varied linearly with [O2] and passed through the origin (second order k = 2.5 × 10⁴ m−1 s−1; Fig. 2, inset). A very similar rate constant was measured for FMO (k = 2 × 10⁴ m−1 s−1) at pH 8.0 and 15 °C (56). By contrast, at 0.6 mm O2, the analogous BVMO intermediate was observed to form within the mixing time of the stopped-flow instrument (1–2 ms) (57).
FIGURE 2.

A, formation of the C4a-hydroperoxyflavin·NADP+ complex. Spectra are shown at 0.004, 0.071, 0.139, 0.307, 0.577, 0.960, and 2.355 s after mixing the NADPH-reduced enzyme with air-saturated buffer (final [O2] = 0.130 mm) in the stopped-flow instrument. Inset, oxygen dependence of the rate of C4a-hydroperoxyflavin formation in the absence of l-Orn. C4a-hydroperoxide formation was monitored at 370 nm under pseudo-first order conditions with varying [O2]. Values for kobs determined from fitting single exponentials to the data are plotted versus [O2]. The second order rate constant determined from this plot was 2.5 × 10⁴ m−1 s−1. Reaction mixtures contained 10 μm reduced enzyme·NADP+ at 25 °C. B, conversion of the C4a-hydroperoxyflavin·NADP+ complex to oxidized FAD. Spectra at 2.63, 11.25, 18.6, 29.4, 60.3, and 142.5 s after mixing from the experiment in Fig. 2 are shown.
The apparent C4a-hydroperoxide converted to the oxidized flavin with an isosbestic point near 400 nm and a first order rate constant kobs = 0.021 s−1 (Fig. 2). This value is independent of [O2] and very close to the turnover number for the uncoupled reaction measured at 25 °C (kcat = 0.025 s−1). Therefore, this step appears to limit the rate of the futile cycling that would lead to H2O2 production. The lifetime for the C4a-hydroperoxide in pig liver FMO has been measured at pH 7.2 and 4 °C at >100 min (56). When the OMO C4a-hydroperoxide was generated at pH 7 and 4 °C, we noted that conversion to the oxidized form was complete within 2.5 h (data not shown). Hence, the OMO intermediate can also be described as long lived. Adding excess NADP+ (150 μm or about 10Km,NADPH, 5 KD,NADP+ measured relative to the oxidized enzyme) only slightly increased the measured half-life (data not shown). Finally, the dependence of the half-life for C4a-hydroperoxyflavin/FAD conversion on bound NADP+ was examined by chemically reducing an anaerobic sample of OMO with an equivalent of dithionite. Upon re-exposure to air, the reduced enzyme appears to convert directly and swiftly to FADox without an observable hydroperoxide intermediate (supplemental Fig. S13).
Rapid Kinetic Studies of the Reaction of Reduced OMO with O2 in the Presence of l-Orn
The formation and decay of intermediates were monitored during the reaction of O2 with OMO that had been stoichiometrically reduced with NADPH, this time in the presence of l-Orn. Mixtures with varied [l-Orn] in O2-saturated buffer or varied [O2] in the presence of 5 mm l-Orn, were used. The formation of the C4a-hydroperoxide was in each case slow enough to detect but was ∼5-fold faster in the presence of 5 mm ornithine than without ornithine. Each time course fit well (at 370 nm) to a single exponential curve. The measured values for kobs showed a linear dependence on [O2] (Fig. 3A and inset) and a hyperbolic dependence on [l-Orn], with half-maximal kobs occurring at Kd(app) = 680 μm ornithine (maximal kobs = 82 s−1) (Fig. 3B). This apparent Kd is close to the Km,l-Orn measured in the steady state (580 μm). The second order rate constant describing the O2 dependence at saturating l-Orn was k = 1.3 × 10⁵ m−1 s−1 (Fig. 2).
FIGURE 3.

A, formation of the C4a-hydroperoxyflavin·NADP+ complex in the presence of l-Orn. Spectra are shown at 0.004, 0.019, 0.034, 0.049, 0.071, 0.079, 0.011, and 0.026 s after mixing the NADPH-reduced enzyme with air-saturated buffer containing 5 mm l-Orn (final [O2] = 0.130 mm). The reaction mixture contained ∼10 μm reduced enzyme·NADP+ complex at 25 °C. Inset, oxygen dependence of the rate of C4a-hydroperoxyflavin formation in the presence of saturating l-Orn. The conversion of the reduced enzyme·NADP+ complex to the C4a-hydroperoxyflavin was monitored at 370 nm in the presence of 5 mm l-Orn and varying (pseudo-first order) [O2]. Values for kobs were determined from fits of single exponential curves to the data and plotted versus [O2]. The second order rate constant determined from this plot was 1.3 × 10⁵ m−1s−1. B, kinetic traces illustrating the O2 dependence of the reaction of reduced enzyme·NADP+ complex with O2 in the presence of l-Orn. Absorbance traces at 370 nm show the reduced enzyme·NADP+ complex reacting with varying [O2] to form the C4a-hydroperoxyflavin. Final oxygen concentrations were 0.06, 0.13, 0.3, and 0.6 mm. The kinetic trace at 450 nm illustrates the formation of the oxidized FAD that occurs as the C4a-hydroperoxyflavin disappears, a reaction that shows no dependence on [O2]. C, dependence of the rate of C4a-hydroperoxide formation on [l-Orn] at fixed oxygen. The conversion of reduced enzyme·NADP+ complex to the C4a-hydroperoxyflavin was monitored at 370 nm at various (pseudo-first order) [l-Orn] at fixed/saturating O2. Rate constants were determined from single exponential fits to the first portion of the curves. The apparent Kd and maximal kobs determined from this plot were 680 μm and 82 s−1. Each reaction mixture contained 10 μm reduced enzyme·NADP+ complex with 0.3 mm O2 at 25 °C.
The conversion of the C4a-hydroperoxide species to the oxidized flavin (Fig. 4A) occurred in what appeared to be three consecutive exponential phases that were most easily observed near 390 nm (time course data not shown). It was not possible to cleanly deconvolute all three phases in all of the experiments. However, in the presence of high concentrations of O2 and l-Orn, the individual rates could be distinguished sufficiently that the first two rate constants could be reasonably well fit. The values obtained are reported in Scheme 2. The initial phase probably corresponds to hydroxylation of the amine with concomitant formation of the C4a-hydroxyflavin species. This species has a λmax slightly blue-shifted relative to that of the C4a-hydroperoxide. Notably, the apparent (but not genuine) isosbestic point linking the C4a-hydroperoxide (λmax = 370 nm) and FAD shifts from 400 to 380 nm when l-Orn is present (Figs. 2B and 4A), suggesting the presence of an intermediate with a shorter wavelength λmax. At ∼0.6 mm O2, the rate constant for the hydroxylation varies between 5 and 8 s−1, depending on [l-Orn].
FIGURE 4.

A, conversion of the C4a-hydroperoxyflavin·NADP+ complex to oxidized OMO in the presence of l-Orn. 10 μm reduced enzyme·NADP+ complex containing 5 mm l-Orn was mixed with air-saturated buffer (final [O2] = 0.3 mm at 25 °C). The C4a-hydroperoxyflavin species (λmax = 370 nm) formed and subsequently converted to the oxidized flavin. Only the spectra showing the latter conversion are shown (recorded 0.04, 0.30, 0.50, 1.10, 2.00, and 7.00 s after mixing). B, dependence of the conversion of the C4a-hydroperoxide to oxidized FAD on l-Orn at fixed/saturating O2. The conversion of the C4a-hydroperoxyflavin to the oxidized FAD shown in A was monitored at 450 nm at various (pseudo-first order) l-Orn concentrations. Values for kobs were determined from single exponential fits to the curves. The apparent Kd and maximal kobs determined from this plot were 2.2 mm and 1.8 s−1.
The second phase corresponds to the dehydration of the hydroxyflavin to yield FAD. This step also appears to have some dependence on [l-Orn] and occurs at 1.5–3 s−1. This apparent dependence is probably caused by the similarity in the rates of hydroxylation and dehydration, making the two steps difficult to parse, particularly at lower [l-Orn]. The last phase occurs with only a very small absorbance change and consequently could not be fit accurately. This step could correspond to release of the hydroxylated product and/or the oxidized NADP+ cofactor. A single exponential was also fit to the 450 nm traces over the entire time course between the maximization of the C4a-hydroperoxide and FAD peaks, in an effort to quantify the dependence on [l-Orn] of the composite interaction of l-Orn with C4a-hydroxperoxide. A similar fitting procedure was used for data recorded for analogous experiments with FMO (57). A plot of the resulting kobs values versus [l-Orn] can be fit to a hyperbolic curve with an apparent Kd of 2.2 mm (Fig. 4B). Hence, both the rates of formation and the subsequent conversion of the C4a-hydroperoxy species to the oxidized FAD demonstrated dependence on [l-Orn]. We note that this Kd, which is for the binding of l-Orn to the C4a-flavin hydroperoxide, is ∼3-fold larger than the apparent Kd for binding to reduced OMO (0.68 mm).
In order to further define the interactions of l-Orn with both the reduced enzyme and the C4a-hydroperoxide species, two types of sequential mixing stopped-flow experiments were carried out. First, reduced enzyme was mixed anaerobically with saturating (5 mm) l-Orn and allowed to age for various times before mixing with O2-saturated buffer. If equilibration of the reduced enzyme·l-Orn complex were incomplete in the selected time delay, the subsequent reaction with O2 should not all occur at the faster, l-Orn-promoted rate. However, the rate of C4a-hydroperoxide formation was unaffected by an enzyme·l-Orn incubation time as short as 15 ms, even when a lower concentration of l-Orn (0.5 mm or ∼Km) was used (data not shown). Hence, the reduced enzyme and l-Orn must equilibrate very rapidly (i.e. within 15 ms).
Second, the reaction of l-Orn with a preformed C4a-hydroperoxide intermediate was probed directly (Figs. 5 and 6). Reduced enzyme was mixed with air-saturated buffer, and the solution was aged until the C4a-intermediate completely formed (5 s). It was then mixed with buffer containing various concentrations of l-Orn, and the subsequent reactions were monitored. The data appeared to be very similar to the conversion of the C4a-flavinhydroperoxide to oxidized flavin observed in the single mixing experiments described above (Figs. 3 and 4), in which reduced enzyme was simultaneously mixed with l-Orn and O2. Three consecutive exponential phases were also apparent in the data. Traces at 393 nm following formation of the C4a-hydroxide at various l-Orn concentrations are shown in Fig. 6A. The first phase was most pronounced near 390 nm. The second phase was slower and corresponded to a large change in the absorbance near 450 nm (oxidized FAD) (as seen in Fig. 5B). The third phase again resulted in only subtle absorbance changes and most likely corresponds to product release from the oxidized enzyme. Traces at 393 nm fit well to three exponentials with rate constants identical to those identified from the single mixing data above (Figs. 3 and 4). Singular value decomposition of the entire data set (via SpecFit) using the measured rate constants yielded a set of three component spectra that bear remarkable similarity to those measured here for the C4a-hydroperoxide and the oxidized flavin as well as a blue-shifted spectrum typical of a C4a-flavin hydroxide (Figs. 5B and 6).
FIGURE 5.

A, conversion of a preformed C4a-hydroperoxyflavin·NADP+ complex to oxidized OMO in the presence of l-Orn. 10 μm reduced enzyme·NADP+ complex in the absence of l-Orn was mixed with air-saturated buffer (final [O2] = 0.3 mm at 25 °C) and aged until the C4a-hydroperoxyflavin intermediate fully formed (5 s). The preformed intermediate was then mixed with 5 mm l-Orn in the same buffer. Spectra shown were recorded 0.161, 0.352, 0.487, 0.622, 1.050, and 7.125 s after the second mixing. B, kinetic traces showing the reaction of C4a-hydroperoxide to oxidized FAD at 450 nm. Reactions were monitored at 450 nm. Final [l-Orn] = 0.0625, 0.25, 0.5 1.25, 2.5, 5.0, and 25.0 mm. C, dependence of the conversion of the C4a-hydroperoxide to oxidized FAD on l-Orn at fixed/saturating O2. The conversion of the C4a-hydroperoxyflavin to the oxidized FAD shown in A was monitored at 450 nm at various (pseudo-first order) l-Orn concentrations. Values for kobs were determined from single exponential fits to the curves. The apparent Kd and maximal kobs determined from this plot were 2.3 mm and 2.5 s−1, respectively.
FIGURE 6.

A, kinetic traces illustrating the reaction of a preformed C4a-hydroperoxide with variable concentrations of l-Orn. The C4a-hydroperoxide was generated by mixing 10 μm reduced enzyme·NADP+ complex (in the absence of l-Orn) with air-saturated buffer (final [O2] = 0.3 mm, 25 °C) and aged 5 s. It was then mixed with various l-Orn concentrations in the same buffer. The data measured at 393 nm are shown, illustrating three consecutive exponential processes. Final [l-Orn] for the traces shown is 1.25, 2.5, 5.0, and 25.0 mm. B, singular value decomposition of the complete set of data shown in Fig. 5A, using the rate constants fit to the three kinetic phases highlighted in A. Three constituent spectra were determined, resembling previously measured spectra for C4a-hydroperoxide (dotted line), C4a-hydroxide (solid line), and oxidized FAD (dashed line).
The rate constants for the hydroxylation and dehydration steps, obtained with this double mixing experiment and in the single mixing experiments described above, both were dependent on [l-Orn]. Single exponentials were fit independently over the full time course of these experiments at 450 nm, where kobs depended hyperbolically on [l-Orn] (apparent Kd = 2.1 mm; Fig. 5, B and C). The apparent Kd for the C4a-hydroperoxide and l-Orn measured in both this experiment and the analogous single mixing experiment in which l-Orn and O2 were added to the reduced enzyme concurrently are nearly the same. These results suggest that the hydroxylation reaction in either case is the same, occurring after the binding of l-Orn to the C4a-hydroperoxide.
In further support of this conclusion, experiments in which l-Orn and O2 were independently presented to the reduced enzyme showed that either the Ered·l-Orn complex or the reduced enzyme alone is capable of reacting with O2. These two pathways yield the C4a-hydroperoxide at rates equal to 1) k[Ered·l-Orn][O2] and 2) k′[Ered][O2], where k/k′ is ∼5. Given the apparent Kd for Ered·l-Orn of 0.68 mm, [Ered·l-Orn] = 1470 m−1 [Ered][l-Orn]. The ratio of rate 1 to rate 2 is therefore equal to [l-Orn] (7350 m−1). This suggests that the two rates are equal and their associated pathways are equally populated at [l-Orn] = 140 μm or when ∼20% of the reduced enzyme is occupied by l-Orn (according to the measured Kd). The l-Orn-facilitated pathway gains importance proportionally at concentrations above 140 μm. For example, at Km,l-Orn = 0.5 mm, the l-Orn pathway would be preferred ∼3.7:1. This suggests that the pathway in which l-Orn associates with the reduced enzyme and facilitates O2 activation is preferentially in use over much of the l-Orn concentration range probed in this paper.
DISCUSSION
Flavin monooxygenases that catalyze the N-hydroxylation of the side chain of ornithine, lysine, or other primary amines are essential for the biosynthesis of hydroxamic acids. These acids act as bidentate chelating moieties in the siderophores used by hundreds of organisms (27). Although these enzymes are now known to be widespread and appear to constitute a distinct subclass of flavin monooxygenases (28), they have undergone little mechanistic study until recently (35, 42). Their encoding genes are essential for survival and/or virulence in many species of pathogenic fungi, notably deadly strains of A. fumigatus and intracellular Histoplasma capsulatum (15–17). Serious fungal infections, particularly in their invasive forms, are associated with high mortality rates due to a dearth of effective treatments (18). We consequently chose to examine the OMO enzyme from A. fumigatus as a representative of its class. The larger family of N-hydroxylating monooxygenases also includes enzymes involved in the biosynthesis of the plant hormone, auxin. Low overall sequence conservation between these enzymes and other flavin monooxygenases, their roles in biosynthetic rather than degradative processes, and their unusually acute substrate specificity suggest that they may be mechanistically or structurally distinct from either of the known families of flavin monooxygenases. We therefore undertook an extensive mechanistic study of OMO to define the place of NMOs in the larger scheme of flavin enzymes and to begin to address the feasibility of using the enzyme as an antifungal target.
All known flavin monooxygenases activate dioxygen to produce the substrate-hydroxylating species, a flavin C4a-hydroperoxide (or peroxide) adduct. The reactive species must then be directed toward the desired substrate and at the same time protected from releasing H2O2 to form oxidized flavin. The two major classes of well characterized flavin monooxygenases differ according to how they achieve the regulatory functions that avoid releasing H2O2. In the aromatic hydroxylases, of which para-hydroxybenzoate hydroxylase is the best studied example (58), regulation occurs at the level of flavin reduction. Rapid reduction occurs only following the binding and deprotonation of the substrate, an event that triggers a protein conformational change that brings FAD and NADPH into an optimal position for hydride transfer. Thus, unless a substrate is present, the flavin is not effectively reduced, and reaction with O2 cannot occur. Additional movements of the flavin enclose it and the substrate into a solvent-protected pocket, where the C4a-hydroperoxide can safely form and react with substrate. By contrast, the hepatic FMOs and bacterial BVMOs regulate their reactivity at the level of the C4a-hydroperoxide itself, which when formed is quite stable and releases H2O2 only very slowly in the protein's interior (56–57, 59–61). Such a mechanism suits the biological role of the FMOs in hydroxylating and thereby increasing the aqueous solubility of xenobiotic compounds. Consistent with this role, these enzymes hydroxylate a broad variety of nitrogen- and sulfur-containing nucleophiles and even halides (37). The reactive species is understood to sit in a solvent-protected pocket that is able to exclude charged (and therefore endogenous) metabolites in favor of a broad spectrum of neutral xenobiotics.
By contrast, SMOs are generally known to have acute substrate specificity, even distinguishing l-ornithine from l-lysine despite the fact that the two differ by just one methylene group (35, 41). It therefore came as a surprise that OMO shared so many mechanistic features with the decidedly omnivorous FMOs. OMO, like the bacterial PvdA (42) and the FMO/BVMO enzymes, showed no substrate-dependent enhancement in the rate of FAD reduction, ruling out a possible substrate-gated regulatory mechanism of the kind identified in para-hydroxybenzoate hydroxylase. Furthermore, retention of NADP+ on the enzyme following reduction stabilizes the C4a-hydroperoxide intermediate in the hepatic FMOs and the BVMOs (56–57, 59–60) and, as shown here, also in OMO. A quasi-stable hydroperoxide was observed only in the presence of NADP+ (Fig. 2). In the absence of hydroxylatable substrate, decomposition of this species to form oxidized FAD and H2O2 is rate-limiting and slow in all of these enzymes. Exposure of dithionite-reduced FMO (56) or OMO to air resulted in the rapid production of oxidized FAD without observable intermediates (supplemental Fig. S13). Consistent with retention of NADP+ on the enzyme throughout the oxidative half-reaction, NADP+ showed a pattern of pure competitive inhibition with NADPH, indicating that the NADP+-releasing and NADPH-binding enzyme forms are the same. The same pattern was observed by Poulsen and Ziegler (44) in early work with FMO.
Both steady state and transient studies of OMO also indicated important differences in the way it and the FMO or BVMO enzymes interact with their hydroxylatable substrates. Steady state kinetic data for OMO showed a pattern of substrate interactions suggesting ordered binding of NADPH, l-Orn, and O2. This is different from what was observed or would be predicted for either the FMO-like or aromatic hydroxylases and initially appeared to indicate a unique mechanism. Transient kinetic and product inhibition data subsequently shed light on these results. First, as in PvdA, it was noted that the rate of formation of the C4a-hydroperoxide is regulated by the presence of substrate (42). The effect is mild, however, particularly when compared with the 105-fold enhancement in the rate of FAD reduction in the presence of substrate observed for para-hydroxybenzoate hydroxylase (62). Studies of the reaction between E-FADred(NADP+) and O2 showed that the second order rate constant increased roughly 5-fold in the presence of saturating l-Orn. However, because formation of the C4a-hydroperoxide is not the rate-limiting step in catalysis (see Scheme 2), enhancing the rate of this step has no effect on the rate of turnover. It is therefore unclear whether the observed rate acceleration serves a biological role. The dependence of the rate constant for formation of the C4a-hydroperoxide on [l-Orn] was hyperbolic with an apparent Kd = 0.6 mm, very similar to the measured KI (0.5 mm) for l-Orn/l-Orn-OH inhibition (see below) as well as Km,l-Orn. (0.5 mm). This similarity suggests that each measured quantity is due to the same interaction between protein and l-Orn. In the case of Km, identity with the apparent Kd and KI could be observed if l-Orn achieves equilibrium with E-FADred(NADP+) rapidly. A rapid equilibrium was indeed identified via double mixing kinetic experiments.
Evidence for the interaction of a second enzyme form with l-Orn likewise came from both transient kinetics and product inhibition. The reaction of a preformed C4a-hydroperoxide with l-Orn resulted in generation of hydroxylated product, demonstrating that the intermediate formed in the absence of l-Orn is catalytically competent. Moreover, the intermediate reacted with l-Orn with identical kinetics whether l-Orn was present prior to C4a-hydroperoxide formation or was added to the preformed intermediate. In either case, the reaction demonstrated a saturable dependence on [l-Orn] (Kd(app) = 2.1 mm). The conversion of the C4a-hydroperoxide to the hydroxide and then to oxidized flavin occurred via a series of single exponential processes that were identical in each type of experiment. These observations, coupled with the fast off-rate for l-Orn from the FADred(NADP+) complex, suggest that with low concentrations of l-Orn present, the molecule that is hydroxylated most likely adds to the enzyme in its C4a-hydroperoxide form.
Further evidence for the interaction of l-Orn with both FADred(NADP+) and a second enzyme form came from product inhibition. The N5-hydroxyornithine product of the reaction was shown to act as a competitive inhibitor with l-Orn, indicating that the two vie for the same reduced, NADP+-bound enzyme form. By contrast, at higher but non-saturating concentrations of l-Orn, l-Orn-OH is uncompetitive with NADPH, suggesting that a second enzyme form can also bind l-Orn-OH. This form is presumably the C4a-hydroperoxide. The KI for l-Orn-OH and this enzyme form is 1.6 mm, very similar to the measured Kd(app) of 2.1 mm cited above, suggesting that these two constants indeed describe the interaction of the same enzyme form with l-Orn/l-Orn-OH. Notably, the affinity of the substrate/product for this form is somewhat less than for the reduced enzyme.
A simple analysis of the relative rates of the l-Orn-promoted and -unpromoted pathways for C4a-hydroperoxide formation suggests that the former pathway is preferred at [l-Orn] ≥ 140 μm, which includes all of the concentration range probed in this study. The ambient concentrations of l-Orn inside the cytosol of A. fumigatus are not known, although ornithine is produced exclusively in the mitochondrion and actively transported into the cytosol, where siderophore biosynthesis takes place. It is possible that concentrations in this range could be reached, particularly if ornithine transport occurred in response to iron stress. It is unclear whether the l-Orn binding sites on the FADred(NADP+) and C4a-hydroperoxide species are physically in the same or different locations. The kinetic and spectroscopic data are consistent with either two physically independent binding sites for l-Orn, one allosteric and the other catalytic, or a single binding site that has differing l-Orn affinities depending on whether the enzyme is in its FADred(NADP+) or C4a-hydroperoxide (NADP+) form. If the former description is true, then it is possible that other effectors that could stimulate C4a-hydroperoxide formation are available in the cell. If the latter is more accurate, then the reaction with l-Orn and O2 is best described as random. The observed dependences of both the rates of C4a-hydroperoxide formation and conversion to FAD on [l-Orn] are consistent with either description. Deciphering these two possibilities will be the subject of future work.
By the same token, the physical mechanism by which l-Orn accelerates C4a-hydroperoxide formation is unknown. It is possible that binding of the positively charged l-Orn could lower the barrier for the formation of the flavin semiquinone/superoxide radical pair (63). This would most likely require the regulatory and catalytic binding sites to be physically one and the same. It is also possible that l-Orn could dynamically induce a structural change that would promote access of the reduced flavin to O2 or that would bring the C4a position closer to an enzyme or NADP+-supplied positive charge. Interestingly, the turnover rates of FMOs have long been known to be accelerated by allosteric effectors, including octylamine (61). The nature of the effector interaction with substrate is unknown, but because it influences the turnover rate, it would need to have its effect on a rate-limiting step (i.e. either hydroxyflavin dehydration or NADP+ release at the end of each turnover). Studies of recombinant, chimeric forms of FMOs indicated that the substrate- and octylamine-binding portions of the FMO enzymes are probably remote from one another (64).
The ability of the C4a-hydroperoxide to form a measurable complex with its substrate is unusual. It has been demonstrated that the FMOs in their C4a-hydroperoxide forms do not reversibly form complexes with their hydroxylation substrates but instead react by a second order mechanism (57, 65). For OMO, saturation in the plot of kobs versus [l-Orn], measured under pseudo-first order conditions for the reaction of the C4a-hydroperoxide and l-Orn, indicates that a complex does indeed form. Moreover, this enzyme form is subject to inhibition via the binding of l-Orn-OH. The difference in pKa for the amine substrate (∼10) and hydroxylamine product (∼5) indicates that the latter has a neutral side chain, whereas the former is positively charged at neutral pH. The fact that l-Orn-OH is able to serve as an inhibitor with a KI similar to the substrate Kd (for either l-Orn binding interaction) suggests either that the substrate is deprotonated in the active site or that the side chain charge is not relevant to the binding interaction. Future work will focus on understanding the interaction of substrate-like molecules with the two l-Orn-binding enzyme forms. Such an understanding is essential for exploring possible inhibition strategies as well as for understanding the remarkable specificity of OMO and its homologs for their substrates.
CONCLUSIONS
The OMO from A. fumigatus is a representative N-hydroxylating monooxygenase involved in siderophore biosynthesis. We have shown that it forms a quasi-stable C4a-hydroperoxide solely in the presence of bound NADP+. The formation of this species is modestly accelerated by the interaction of the reduced enzyme with a molecule of substrate. Although the effect is easily detected, it is probably insufficient to explain how OMO achieves its remarkable substrate selectivity or how it regulates the reaction with O2. The effect could be more pronounced in other NMOs. On the other hand, in contrast to FMOs, the C4a-hydroperoxide of OMO appears to bind l-Orn reversibly, potentially offering a means of screening for appropriate substrates.
Supplementary Material
Acknowledgments
We thank Prof. Marvin J. Miller for intellectual and material contributions toward the synthesis and characterization of l-Orn-OH. We thank Dr. Alexander Gehrke of the Hans Knöll Institute (Jena, Germany) for the kind gift of A. fumigatus from which genomic DNA was extracted. Amy Zercher gave technical assistance in cloning the sidA gene. We thank Garrett Moraski for technical assistance and for helpful discussions and Barrie Entsch (University of New England, New South Wales, Australia) for critical reading of the manuscript. NMR facilities were provided by the Lizzadro Magnetic Resonance Research Center at the University of Notre Dame, and mass spectrometry was provided by the University of Notre Dame Mass Spectrometry and Proteomics Facility (N. Sevova, Dr. W. Boggess, and Dr. M. V. Joyce; supported by National Science Foundation Grant CHE-0741793).
This work was supported, in whole or in part, by National Institutes of Health Grants T32GM075762 (a Chemistry-Biochemistry-Biology Interface Program Training Grant, which funded fellowships for T. A. W. and R. E. F.) and GM20877 (to D. P. B.).

The on-line version of this article (available at http://www.jbc.org) contains supplemental Figs. S1–S13, Scheme S1, and Tables S1–S5.
- l-Orn
- l-ornithine
- l-Orn-OH
- N5-hydroxy-l-ornithine
- OMO
- N5-l-ornithine monooxygenase
- SMO
- siderophore-associated monooxygenase
- FMO
- microsomal flavin-containing monooxygenase
- BVMO
- Baeyer-Villiger monooxygenase.
REFERENCES
- 1.Ong S. T., Ho J. Z., Ho B., Ding J. L. (2006) Immunobiology 211, 295–314 [DOI] [PubMed] [Google Scholar]
- 2.Jurado R. L. (1997) Clin. Infect. Dis. 25, 888–895 [DOI] [PubMed] [Google Scholar]
- 3.Wandersman C., Delepelaire P. (2004) Annu. Rev. Microbiol. 58, 611–647 [DOI] [PubMed] [Google Scholar]
- 4.Andrews S. C., Robinson A. K., Rodríguez-Quiñones F. (2003) FEMS Microbiol. Rev. 27, 215–237 [DOI] [PubMed] [Google Scholar]
- 5.Crosa J. H., Walsh C. T. (2002) Microbiol. Mol. Biol. Rev. 66, 223–249 [DOI] [PMC free article] [PubMed] [Google Scholar]
- 6.Strong R. K. (2005) in Lipocalins (Åkerström B., Borregaard N., Flower D. R., Salier J.-P. eds) p. 204, Landes Bioscience, Austin, TX [Google Scholar]
- 7.Fischbach M. A., Lin H., Liu D. R., Walsh C. T. (2006) Nat. Chem. Biol. 2, 132–138 [DOI] [PubMed] [Google Scholar]
- 8.Abergel R. J., Clifton M. C., Pizarro J. C., Warner J. A., Shuh D. K., Strong R. K., Raymond K. N. (2008) J. Am. Chem. Soc. 130, 11524–11534 [DOI] [PMC free article] [PubMed] [Google Scholar]
- 9.Abergel R. J., Wilson M. K., Arceneaux J. E., Hoette T. M., Strong R. K., Byers B. R., Raymond K. N. (2006) Proc. Natl. Acad. Sci. U.S.A. 103, 18499–18503 [DOI] [PMC free article] [PubMed] [Google Scholar]
- 10.Fischbach M. A., Lin H., Zhou L., Yu Y., Abergel R. J., Liu D. R., Raymond K. N., Wanner B. L., Strong R. K., Walsh C. T., Aderem A., Smith K. D. (2006) Proc. Natl. Acad. Sci. U.S.A. 103, 16502–16507 [DOI] [PMC free article] [PubMed] [Google Scholar]
- 11.Flo T. H., Smith K. D., Sato S., Rodriguez D. J., Holmes M. A., Strong R. K., Akira S., Aderem A. (2004) Nature 432, 917–921 [DOI] [PubMed] [Google Scholar]
- 12.Haas H., Eisendle M., Turgeon B. G. (2008) Annu. Rev. Phytopathol. 46, 149–187 [DOI] [PubMed] [Google Scholar]
- 13.Haas H. (2003) Appl. Microbiol. Biotechnol. 62, 316–330 [DOI] [PubMed] [Google Scholar]
- 14.Johnson L. (2008) Mycol. Res. 112, 170–183 [DOI] [PubMed] [Google Scholar]
- 15.Eisendle M., Oberegger H., Zadra I., Haas H. (2003) Mol. Microbiol. 49, 359–375 [DOI] [PubMed] [Google Scholar]
- 16.Schrettl M., Bignell E., Kragl C., Joechl C., Rogers T., Arst H. N., Jr., Haynes K., Haas H. (2004) J. Exp. Med. 200, 1213–1219 [DOI] [PMC free article] [PubMed] [Google Scholar]
- 17.Hissen A. H., Wan A. N., Warwas M. L., Pinto L. J., Moore M. M. (2005) Infect. Immun. 73, 5493–5503 [DOI] [PMC free article] [PubMed] [Google Scholar]
- 18.Marr K. A., Patterson T., Denning D. (2002) Infect. Dis. Clin. North Am. 16, 875–894 [DOI] [PubMed] [Google Scholar]
- 19.Latgé J. P. (2001) Trends Microbiol. 9, 382–389 [DOI] [PubMed] [Google Scholar]
- 20.Stevens D. A., Kan V. L., Judson M. A., Morrison V. A., Dummer S., Denning D. W., Bennett J. E., Walsh T. J., Patterson T. F., Pankey G. A. (2000) Clin. Infect. Dis. 30, 696–709 [DOI] [PubMed] [Google Scholar]
- 21.Latgé J. P. (1999) Clin. Microbiol. Rev. 12, 310–350 [DOI] [PMC free article] [PubMed] [Google Scholar]
- 22.Frederick R. E., Mayfield J. A., DuBois J. L. (2009) Biometals 22, 583–593 [DOI] [PMC free article] [PubMed] [Google Scholar]
- 23.Ferreras J. A., Ryu J. S., Di Lello F., Tan D. S., Quadri L. E. (2005) Nat. Chem. Biol. 1, 29–32 [DOI] [PubMed] [Google Scholar]
- 24.Neres J., Labello N. P., Somu R. V., Boshoff H. I., Wilson D. J., Vannada J., Chen L., Barry C. E., 3rd, Bennett E. M., Aldrich C. C. (2008) J. Med. Chem. 51, 5349–5370 [DOI] [PMC free article] [PubMed] [Google Scholar]
- 25.Somu R. V., Boshoff H., Qiao C., Bennett E. M., Barry C. E., 3rd, Aldrich C. C. (2006) J. Med. Chem. 49, 31–34 [DOI] [PubMed] [Google Scholar]
- 26.McDougal S., Neilands J. B. (1984) J. Bacteriol. 159, 300–305 [DOI] [PMC free article] [PubMed] [Google Scholar]
- 27.Challis G. L. (2005) Chembiochem 6, 601–611 [DOI] [PubMed] [Google Scholar]
- 28.Cashman J. R., Zhang J. (2006) Annu. Rev. Pharmacol. Toxicol. 46, 65–100 [DOI] [PubMed] [Google Scholar]
- 29.Walsh C. T., Chen Y. C. (1988) Angew. Chem. Int. Ed. Engl. 27, 333–343 [Google Scholar]
- 30.Palfey B. A., Massey V. (1998) in Comprehensive Biological Catalysis (Sinnott M. ed) pp. 83–154, Academic Press, Inc., New York [Google Scholar]
- 31.Ballou D. P. (1982) in Flavins and Flavoproteins: Proceedings of the Seventh International Symposium on Flavins and Flavoproteins, Ann Arbor, Michigan, June 21–26, 1981 (Massey V., Williams C. H. eds) pp. 301–310, Elsevier, New York [Google Scholar]
- 32.Zhao Y., Christensen S. K., Fankhauser C., Cashman J. R., Cohen J. D., Weigel D., Chory J. (2001) Science 291, 306–309 [DOI] [PubMed] [Google Scholar]
- 33.Fraaije M. W., Kamerbeek N. M., van Berkel W. J., Janssen D. B. (2002) FEBS Lett. 518, 43–47 [DOI] [PubMed] [Google Scholar]
- 34.Putignani L., Ambrosi C., Ascenzi P., Visca P. (2004) Biochem. Biophys. Res. Commun. 313, 245–257 [DOI] [PubMed] [Google Scholar]
- 35.Meneely K. M., Lamb A. L. (2007) Biochemistry 46, 11930–11937 [DOI] [PMC free article] [PubMed] [Google Scholar]
- 36.Macheroux P., Plattner H. J., Romaguera A., Diekmann H. (1993) Eur. J. Biochem. 213, 995–1002 [DOI] [PubMed] [Google Scholar]
- 37.Jones K. C., Ballou D. P. (1986) J. Biol. Chem. 261, 2553–2559 [PubMed] [Google Scholar]
- 38.Thariath A., Socha D., Valvano M. A., Viswanatha T. (1993) J. Bacteriol. 175, 589–596 [DOI] [PMC free article] [PubMed] [Google Scholar]
- 39.Marrone L., Viswanatha T. (1997) Biochim. Biophys. Acta 1343, 263–277 [DOI] [PubMed] [Google Scholar]
- 40.Dick S., Marrone L., Duewel H., Beecroft M., McCourt J., Viswanatha T. (1999) J. Protein Chem. 18, 893–903 [DOI] [PubMed] [Google Scholar]
- 41.Ge L., Seah S. Y. (2006) J. Bacteriol. 188, 7205–7210 [DOI] [PMC free article] [PubMed] [Google Scholar]
- 42.Meneely K. M., Barr E. W., Bollinger J. M., Jr., Lamb A. L. (2009) Biochemistry 48, 4371–4376 [DOI] [PMC free article] [PubMed] [Google Scholar]
- 43.Macheroux P. (1999) in Flavoprotein Protocols (Chapman S. K., Reid G. A. eds) pp. 1–7, Humana Press, Totowa, NJ [Google Scholar]
- 44.Poulsen L. L., Ziegler D. M. (1979) J. Biol. Chem. 254, 6449–6455 [PubMed] [Google Scholar]
- 45.Little D. I., Poat P. C., Giles I. G. (1982) Eur. J. Biochem. 124, 499–505 [DOI] [PubMed] [Google Scholar]
- 46.Storer A. C., Darlison M. G., Cornish-Bowden A. (1975) Biochem. J. 151, 361–367 [DOI] [PMC free article] [PubMed] [Google Scholar]
- 47.Cook P. F., Cleland W. W. (2007) Enzyme Kinetics and Mechanism, pp. 1–404, Garland Science, New York, NY [Google Scholar]
- 48.Lin Y. M., Miller M. J. (1999) J. Org. Chem. 64, 7451–7458 [Google Scholar]
- 49.Steennis P. J., Cordes M. M., Hilkens J. H., Müller F. (1973) FEBS Lett. 36, 177–180 [DOI] [PubMed] [Google Scholar]
- 50.Copeland R. A. (2000) Enzymes: A Practical Introduction to Structure, Mechanism, and Data Analysis, pp. 1–397, Wiley-VCH, New York [Google Scholar]
- 51.Naegeli H. U., Kellerschierlein W. (1978) Helv. Chim. Acta 61, 2088–2095 [Google Scholar]
- 52.Polonski T., Chimiak A. (1974) Tetrahedron Lett. 28, 2453–2456 [Google Scholar]
- 53.Walz A. J., Möllmann U., Miller M. J. (2007) Org. Biomol. Chem. 5, 1621–1628 [DOI] [PubMed] [Google Scholar]
- 54.Isowa Y., Ohmori M., Mori K., Sato K., Takashim T., Kurita H. (1972) Bull. Chem. Soc. Jpn. 45, 1461–1464 [Google Scholar]
- 55.Tomlinson G., Cruickshank W. H., Viswanatha T. (1971) Anal. Biochem. 44, 670–679 [DOI] [PubMed] [Google Scholar]
- 56.Beaty N. B., Ballou D. P. (1981) J. Biol. Chem. 256, 4619–4625 [PubMed] [Google Scholar]
- 57.Sheng D., Ballou D. P., Massey V. (2001) Biochemistry. 40, 11156–11167 [DOI] [PubMed] [Google Scholar]
- 58.Entsch B., Cole L. J., Ballou D. P. (2005) Arch. Bhiochem. Biophys. 433, 297–311 [DOI] [PubMed] [Google Scholar]
- 59.Beaty N. B., Ballou D. P. (1980) J. Biol. Chem. 255, 3817–3819 [PubMed] [Google Scholar]
- 60.Alfieri A., Malito E., Orru R., Fraaije M. W., Mattevi A. (2008) Proc. Natl. Acad. Sci. U.S.A. 105, 6572–6577 [DOI] [PMC free article] [PubMed] [Google Scholar]
- 61.Poulsen L. L., Ziegler D. M. (1995) Chem. Biol. Interact. 96, 57–73 [DOI] [PubMed] [Google Scholar]
- 62.Husain M., Massey V. (1979) J. Biol. Chem. 254, 6657–6666 [PubMed] [Google Scholar]
- 63.Roth J. P., Klinman J. P. (2003) Proc. Natl. Acad. Sci. U.S.A. 100, 62–67 [DOI] [PMC free article] [PubMed] [Google Scholar]
- 64.Wyatt M. K., Overby L. H., Lawton M. P., Philpot R. M. (1998) Biochemistry 37, 5930–5938 [DOI] [PubMed] [Google Scholar]
- 65.Jones K. C. (1985) Nature of the 4a-Flavinhydroperoxide of Microsomal Flavin-containing Monooxygenase (Flavoprotein, Hydroperoxide, Oxygen, Oxygenation, Flavinhydroxide), Ph.D. dissertation, University of Michigan, Ann Arbor, MI [Google Scholar]
Associated Data
This section collects any data citations, data availability statements, or supplementary materials included in this article.