Abstract
Spiral imaging is vulnerable to spatial and temporal variations of the static magnetic field (B0) caused by susceptibility effects, eddy currents, chemical shifts, subject motion, physiological noise, and system instabilities, resulting in image blurring. Here, a novel off-resonance correction method is proposed to address these issues. A k-space energy spectrum analysis (KESA) algorithm is first applied to inherently and dynamically generate a B0 map from the k-space data at each time point, without requiring any additional data acquisition, pulse sequence modification, or phase unwrapping. A simulated phase evolution rewinding (SPHERE) algorithm and an automatic residual deblurring algorithm are then used to correct for the blurring caused by both spatial and temporal B0 variations, resulting in a high spatial and temporal fidelity. This method is validated against conventional B0 mapping and deblurring methods and its advantages for dynamic MRI applications are demonstrated in functional MRI studies.
Keywords: K-space energy spectrum analysis (KESA), B0 mapping, simulated phase evolution rewinding (SPHERE), automatic deblurring, spiral imaging
Introduction
Spiral imaging is a fast MRI technique, which benefits from an efficient k-space coverage and a low sensitivity to flow artifacts, with applications ranging from cardiovascular to functional MRI (fMRI). It is, however, vulnerable to static magnetic field (B0) inhomogeneities caused by susceptibility differences at air/tissue interfaces, eddy currents, and chemical shifts, which result in blurring and severely degrade the image quality, particularly at high field strengths.
Many deblurring methods have been developed, but require the acquisition of a B0 map (1–7), which increases the scan time and precludes the correction of temporal B0 variations due to subject motion, physiological noise (e.g., respiration), and system instabilities (e.g., resonance frequency drift). Automatic deblurring methods, which estimate the off-resonance frequencies directly from the data (8–10), are usually less robust. Dynamic B0 mapping methods, which generate a series of B0 maps by acquiring the central k-space twice (11) or by using a dual-echo spiral-in/out sequence (12) with different echo times (TEs), either provide low-resolution B0 maps, which are inaccurate in regions with large B0 inhomogeneities, or are limited by a reduced throughput, an increased gradient duty cycle, and the inability to accommodate contrast preparation modules such as diffusion-weighting gradients.
To address these limitations, we propose a novel off-resonance correction method based on k-space energy spectrum analysis (KESA) (13). KESA was originally developed for inherent B0 mapping and distortion correction in echo-planar imaging (EPI). Here, we further develop it for inherent and dynamic B0 mapping and deblurring in spiral imaging. This method can generate a B0 map from the k-space data at each time point, without requiring any additional data acquisition, pulse sequence modification, or phase unwrapping (which is problematic in the presence of large B0 inhomogeneities or low signal-to-noise ratio). A simulated phase evolution rewinding (SPHERE) method (14) and an automatic residual deblurring method are then used to correct for the blurring in the spiral images caused by both spatial and temporal B0 variations.
Theory
KESA B0 Mapping
In gradient-echo spiral imaging, the ideal k-space trajectory is:
| [1] |
where γ̵ is the gyromagnetic ratio, Gx and Gy the readout gradients, Tacq the readout duration, and Tpre the time between the radiofrequency (RF) excitation and the acquisition window (see Fig. 1a for the case of a spiral-in sequence). In a homogeneous B0 field, the echo occurs at the center of k-space, whereas in the presence of B0 inhomogeneities, the B0 gradients along x and y, G′x(x, y) = ∂B0(x, y)/∂x and G′y(x, y) = ∂B0(x, y)/∂y, cause deviations of the k-space trajectory:
| [2] |
resulting in a shift of the echo peak from the center of k-space (Fig. 1b):
| [3] |
FIG. 1.
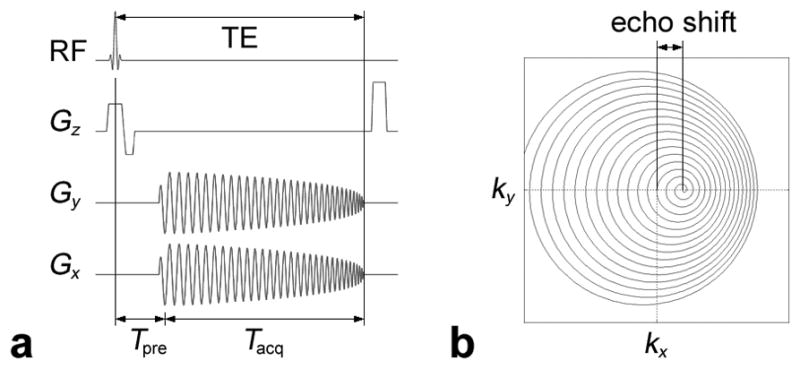
a: Spiral-in imaging pulse sequence. b: Distorted k-space trajectory (for a given pixel) in the presence of a B0 gradient G′x(x, y), resulting in a spatially dependent echo shift in k-space.
(since kj(TE) = 0) and blurring in the reconstructed image. Note that if the B0 inhomogeneities are spatially nonlinear, the echo shift varies with pixel location.
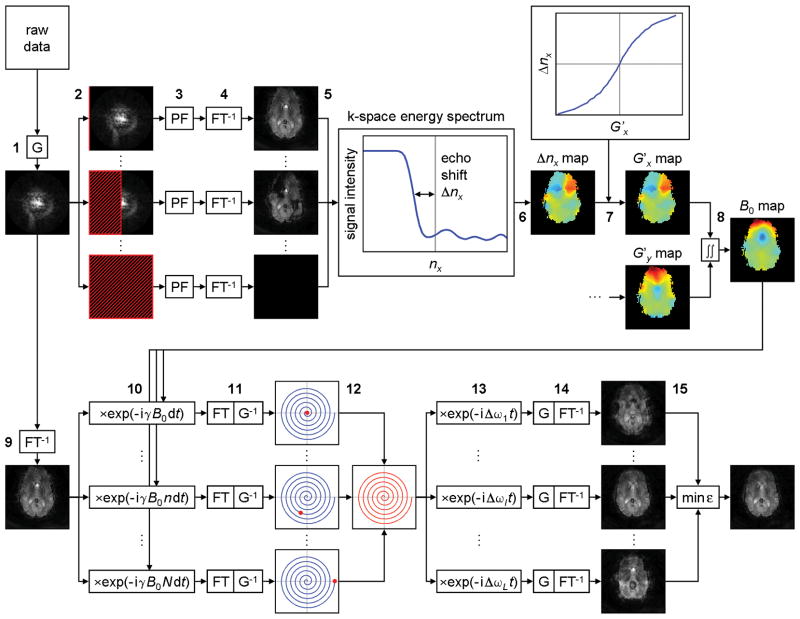
Here, we propose a novel KESA method for spiral imaging, which measures this B0-induced spatially dependent echo shift to generate a B0 map from the k-space data. Specifically, the spiral k-space data is first regridded to a Cartesian Nx × Ny k-space (Fig. 2, step 1). A number nx = 1, …, Nx of kx lines are truncated (step 2) and replaced by values computed with partial Fourier reconstruction (15) (step 3). Each resulting k-space is then reconstructed into a partial Fourier image (step 4).
FIG. 2.
Schematic diagram of the proposed off-resonance correction method for spiral imaging, consisting of KESA B0 mapping (steps 1–8), SPHERE deblurring (steps 9–12), and automatic residual deblurring (steps 13–15). G: gridding, PF: partial Fourier, FT: Fourier transform.
The signal intensity of a given pixel is extracted from these Nx images and plotted as a function of nx to form a k-space energy spectrum (step 5). A sudden drop of signal intensity occurs when the echo peak is truncated, and the echo shift can be quantified as Δnx, the number of kx lines between this transition point and the center of k-space. This procedure is repeated for each pixel to generate a Δnx map (step 6).
This Δnx map is then converted to a G′x map. In EPI, this step is straightforward because the spacing between kx lines is uniform, so that G′x can be expressed as a function of Δnx (13). In spiral imaging, the spacing between successive turns in the spiral trajectory, and hence between kx lines in the regridded k-space, does not remain uniform in the presence of B0 inhomogeneities (Fig. 1b), making it difficult to derive an analytical expression for G′x. However, there is still a 1:1 correspondence between G′x and Δnx, which we determine numerically as follows.
For a given G′x value, the distorted spiral k-space trajectory is computed with Eq. [2], and the corresponding echo shift Δnx is determined by counting the number of turns between the shifted echo and the center of k-space (e.g., Δnx = 3 in Fig. 1b). This procedure is repeated for a range of G′x values to generate a G′x vs. Δnx curve, which is then used to convert the Δnx map to a G′x map (step 7). This calibration only needs to be performed once for a given spiral trajectory, after which the G′x vs. Δnx values can be stored for subsequent calculations. Steps 2–7 are repeated along ky to generate a G′y map. Finally, the G′x and G′y maps are integrated along x and y to generate a B0 map including both linear and nonlinear B0 inhomogeneities (step 8). Note that the images reconstructed from the spiral k-space data and the resulting Δnx, Δny, G′x, G′y, and B0 maps are all in distorted coordinates.
SPHERE Deblurring
In conventional deblurring methods such as conjugate phase (CP) reconstruction (1), a series of images are reconstructed at different off-resonance frequencies and the corrected image is formed by selecting each pixel from the appropriate image, according to the B0 value in that pixel. Such methods therefore require an undistorted B0 map. Since the KESA B0 maps are in distorted coordinates, we instead use the SPHERE algorithm (14), in which the demodulation is performed in image space rather than k-space using a distorted rather than undistorted B0 map. Otherwise, misregistration between the undistorted object and the B0 map would cause errors in the corrected image, particularly near the boundaries (14).
Specifically, an image is reconstructed from the regridded k-space data (step 9) and multiplied by exp(−i γ B0(x, y) n dt), for n = 1, …, N, where dt is the dwell time and N the number of points in the spiral trajectory (step 10). Each resulting image is transformed back to k-space (step 11) and the nth data point is extracted from the nth k-space to generate a new k-space (step 12) and reconstruct the corrected image. In practice, the computation time can be drastically reduced by performing step 10 only for n = s, 2s, 3s, …, and extracting the nth data segment in step 12. Here, we use s = 50, which provides an efficient, yet accurate, deblurring.
Automatic Residual Deblurring
The KESA B0 maps are generated by integration and still contain an unknown global B0 offset. In EPI, such an offset causes a global image shift in the phase-encoding direction, which can be corrected with rigid-body registration. In spiral imaging, it leaves a residual image blurring, which we correct using an automatic deblurring approach (8–10).
The idea is to reconstruct a series of images at different off-resonance frequencies Δωl and to choose the one that has the least amount of blurring, as characterized by an objective function. Specifically, the k-space data obtained after deblurring is multiplied by exp(− i Δωl t), for l = 1, …, L (step 13). Each resulting k-space is reconstructed into an image Il(x, y) (step 14) and the following objective function is computed:
| [4] |
where α = 0.5 and f(·) = abs(·) × ang(·) (16). The corrected image is then chosen as the image demodulated at the frequency that minimizes this objective function (step 15). Incidental phase variations φ(x, y) due to imperfect RF excitation, timing errors, or flow are measured by reconstructing a low-pass filtered image from the central k-space data and removed from Il before calculation of εl.
An important difference with previous automatic deblurring methods is that the latter need to account for nonuniform off-resonance frequencies across the image, so that the summation in Eq. [4] is performed only over a local window around each pixel, resulting in a trade-off between the occurrence of spurious minima in the objective function and a reduced accuracy in the estimated field map. Here, since we only correct for a residual global B0 offset, the summation is performed over the whole image without such a limitation.
Methods
We studied five healthy volunteers, who provided written informed consent as approved by our Institutional Review Board, on a 3 T Excite MRI scanner (GE Healthcare, Milwaukee, WI) using an eight-channel phased array RF coil. Single-shot spiral-in gradient-echo images of the brain were acquired with: repetition time (TR) = 2 s, TE = 28 ms, flip angle = 60°, field-of-view = 24 cm, matrix size = 64×64, slice thickness = 3.8 mm, and 20 slices. The spiral trajectory was designed based on the maximum gradient amplitude (40 mT/m) and slew rate (150 T/m/s) of the scanner (17), resulting in 32 turns, N = 5844, and Tacq = 23.4 ms. High-order shimming was applied to minimize the global B0 inhomogeneity. For the automatic residual deblurring, the last 3 ms of the spiral-in acquisition (i.e., the central k-space corresponding to an image size of 16×16) was used to reconstruct the low-pass filtered images.
The proposed off-resonance correction method was validated against conventional multiecho B0 mapping (18) and CP deblurring (1) methods. Accurate and undistorted B0 maps with the same voxel size as the spiral images were generated by acquiring a train of asymmetric spin-echo images in a multiecho sequence, followed by pixel-wise phase unwrapping and linear regression along the echo dimension. The number of off-resonance frequencies used in the CP reconstruction was determined as L = ceil(32 Δωmax Tacq/π), where Δωmax is the maximum off-resonance frequency in absolute value.
To demonstrate the effectiveness of the proposed method in dynamic MRI applications, fMRI studies were performed using a breathholding task, which induces a global blood oxygenation level-dependent (BOLD) response over the whole brain. The activation paradigm was a block design consisting of three 20-s blocks of end-expiration breathholding interleaved within four 20-s blocks of self-paced breathing.
Four runs were performed, each consisting of four dummy scans and 70 image volumes. Runs 1–2 were performed under a well-shimmed condition and runs 3–4 with the application of a ±7.4 Hz/cm x-shim gradient offset. By applying external in-plane B0 gradients, well-controlled spatial and temporal B0 variations can be achieved without requiring the subject to move or varying the through-plane B0 gradient, which would otherwise necessitate a careful registration procedure or introduce confounding signal intensity changes.
The KESA method was compared with a dynamic B0 mapping method using temporally alternating TEs. To this end, all runs were acquired with a TE alternating between 28 and 29 ms. The images were then corrected using the B0 maps generated with the KESA method at each time point or the B0 maps derived from successive pairs of images acquired at different TEs.
The image volume time series were linearly detrended, temporally realigned to account for the interleaved slice acquisition, averaged across all runs, and cross-correlated with a hemodynamic response function corresponding to the paradigm. The resulting Z-score maps were thresholded at Z > 3 and with a cluster size of 5 voxels, and overlaid on coregistered high-resolution T1-weighted anatomical images. Subject motion was negligible and no spatial normalization or smoothing was performed. All image reconstruction and analysis was done in Matlab (The MathWorks, Natick, MA) on a 3.4 GHz workstation.
Results
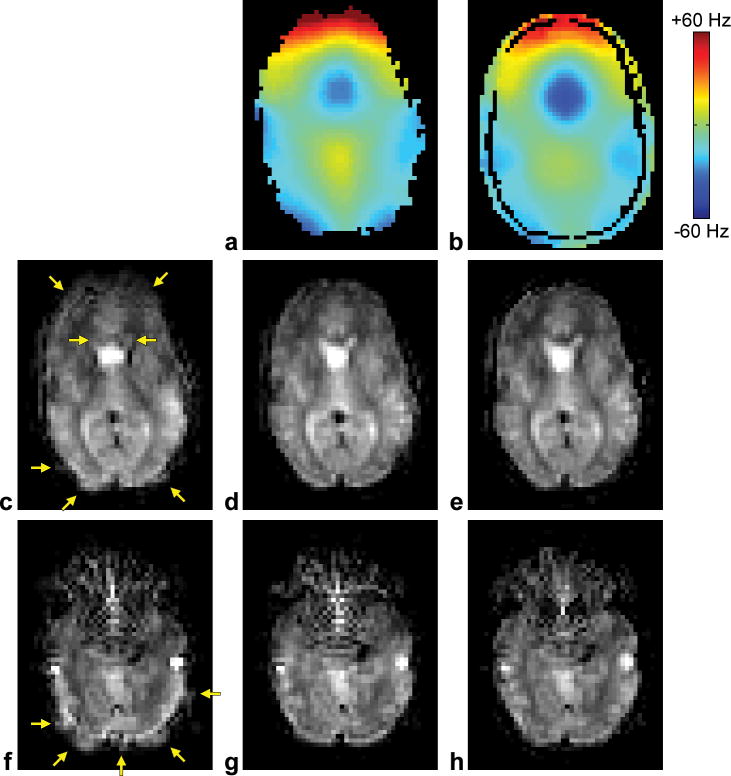
Representative results are shown in Figure 3a–e. The uncorrected image is affected by blurring due to susceptibility-induced B0 inhomogeneities (Fig. 3c, arrows). The proposed off-resonance correction method can inherently generate a B0 map from the k-space data (Fig. 3a) and use it to correct for these artifacts (Fig. 3d), while providing comparable results as a separately acquired B0 map (Fig. 3b) and conventional CP deblurring (Fig. 3e). Similar results are obtained in a more inferior slice (Fig. 3fh), although, as expected, both methods only correct for the blurring due to in-plane B0 inhomogeneities, but not the signal intensity changes due to through-plane B0 inhomogeneities. Pixelization artifacts in the frontal lobes may be further reduced by using regularization, as demonstrated for EPI (19).
FIG. 3.
a: KESA B0 map. b: Multiecho B0 map. c,f: Uncorrected images. d,g: Images corrected using the proposed method (KESA B0 mapping, SPHERE deblurring, and automatic residual deblurring). e,h: Images corrected using a conventional method (multiecho B0 mapping and CP deblurring). Images a–e correspond to one slice and images f–h correspond to another slice. Note that the KESA and multiecho B0 maps are in distorted and undistorted coordinates, respectively.
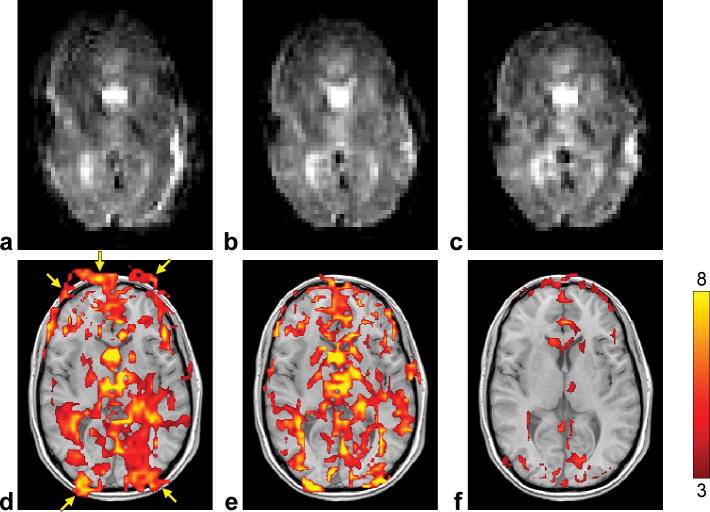
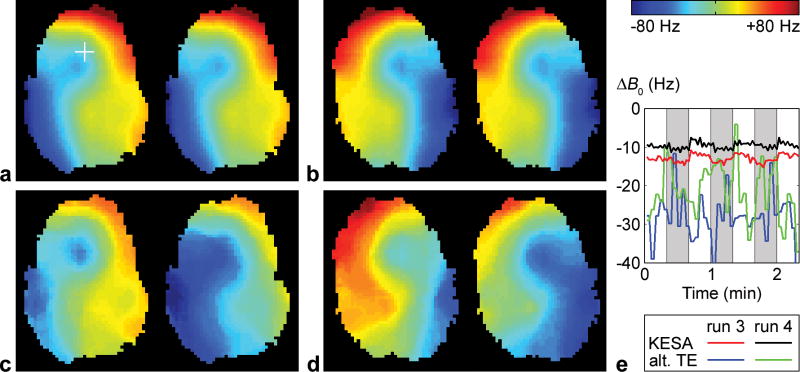
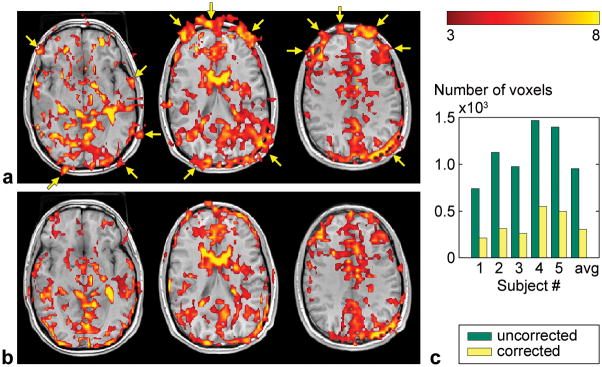
Representative fMRI results are shown in Figure 4. The uncorrected image is affected by severe blurring artifacts (Fig. 4a) and the corresponding activation map shows a widespread BOLD response with large clusters of activated voxels within the brain, but also extending outside the brain at the anterior and posterior edges (Fig. 4d, arrows). The proposed method can inherently and dynamically generate a B0 map from the k-space data at each time point (Fig. 5a,b) to characterize the spatial and temporal B0 variations, such as those due to different x-shim gradient offsets (which explains the left/right asymmetry between Figs. 5a and 5b) or to chest motion between the breathholding and rest periods (Fig. 5e). These B0 maps can then be used to significantly reduce the blurring (Fig. 4b), resulting in a BOLD activation that is more focal and better restricted to the brain (Fig. 4e). In contrast, the B0 maps derived using the alternating TE method suffer from a low spatial and temporal fidelity (Fig. 5c–e), because of temporal B0 variations between successive TRs, resulting in a substantially reduced activation (Fig. 4f).
FIG. 4.
Representative images (from run 4) (a–c) and activation maps (d–f) uncorrected (left), corrected using the proposed method (KESA B0 mapping, SPHERE deblurring, and automatic residual deblurring) (middle), and corrected using a conventional method (alternating-TE B0 mapping and SPHERE deblurring) (right).
FIG. 5.
KESA B0 maps (a,b) and alternating-TE B0 maps (c,d) at two different time points of runs 3 (a,c) and 4 (b,d). e: Corresponding B0 time courses in a representative pixel (crosshair in a). The slice is the same as in Fig. 4 and the left images in b,d correspond to the same time point as in Fig. 4. The global B0 offsets determined from the automatic residual deblurring have been added to the KESA B0 maps.
Similar results are obtained across the whole brain (Fig. 6a,b). To demonstrate the effectiveness of the proposed method across slices and subjects, we computed the number of activated voxels outside the brain, which was segmented from the high-resolution T1-weighted anatomical images. The results show that this number is systematically reduced for every subject (Fig. 6c).
FIG. 6.
Activation maps uncorrected (a) and corrected using the proposed method (b) in three different slices. c: Number of activated voxels outside the brain across all slices for each subject and averaged across subjects.
Discussion and Conclusions
The proposed off-resonance correction method was validated against conventional B0 mapping and CP deblurring methods, and compared to a dynamic B0 mapping method using alternating TEs in fMRI studies. The results show that our method leads to a much higher spatial and temporal fidelity, thus demonstrating its advantages for dynamic MRI applications. The spiral-in/out dynamic B0 mapping method (12) can potentially provide similar results, but with the limitations mentioned earlier.
For the spiral trajectory used in this work, the maximal detectable B0 gradient (i.e., when the echo peak is shifted to the edge of k-space) can be obtained from the calibration procedure (step 7) and is about 200 Hz/cm, which is above most values typically seen in the human brain (20). In comparison, for an EPI acquisition with identical TE, field-of-view, and matrix size, the maximal detectable B0 gradients are 25 Hz/cm along the phase-encoding direction and 46 Hz/cm along the readout direction (Eqs. [3–4] in (13)). Since the KESA B0 maps are generated by integration of the G′x and G′y maps, some smoothing may be introduced in regions with very sharp B0 transitions across adjacent pixels. However, this effect should be limited, since the B0 field is generally smoothly varying.
Transmit and receive phase variations across the image may in theory affect the KESA B0 maps. However, experiments performed in a homogeneous phantom under well-controlled B0 gradients and the observation that B0 maps generated from different channels of a phased array RF coil are virtually identical suggest that such contributions are not significant in practice. The KESA method can further be combined with parallel imaging by applying reconstruction algorithms such as GRAPPA (21) to the undersampled spiral k-space data to generate a fully sampled k-space before computation of the k-space energy spectrum. Typical computation times (per image) are 7.0 s for the KESA B0 mapping, 1.2 s for the SPHERE deblurring, and 0.5 s for the automatic residual deblurring, but can be substantially reduced with more efficient programming (e.g., C/C++) for routine use in dynamic MRI applications.
In conclusion, we have developed a novel off-resonance correction method for spiral imaging, integrating a KESA algorithm, which inherently and dynamically generates a B0 map from the k-space data at each time point, without requiring any additional data acquisition, as well as a SPHERE algorithm and an automatic residual deblurring algorithm, which then correct for the blurring caused by both spatial and temporal B0 variations, resulting in a high spatial and temporal fidelity. This method should be particularly useful for dynamic applications such as fMRI, resting-state functional connectivity analysis, perfusion MRI, or dynamic contrast enhanced MRI, as well as uncooperative pediatric, geriatric, and patient populations.
Acknowledgments
We thank Natalie Goutkin for her assistance with MRI scanning. This work was supported by grants NS 050329, EB 005690, and NS 065344 from the National Institutes of Health.
References
- 1.Noll DC, Meyer CH, Pauly JM, Nishimura DG, Macovski A. A homogeneity correction method for magnetic resonance imaging with time-varying gradients. IEEE Trans Med Imaging. 1991;10:629–637. doi: 10.1109/42.108599. [DOI] [PubMed] [Google Scholar]
- 2.Irarrazabal P, Meyer CH, Nishimura DG, Macovski A. Inhomogeneity correction using an estimated linear field map. Magn Reson Med. 1996;35:278–282. doi: 10.1002/mrm.1910350221. [DOI] [PubMed] [Google Scholar]
- 3.Man LC, Pauly JM, Macovski A. Multifrequency interpolation for fast off-resonance correction. Magn Reson Med. 1997;37:785–792. doi: 10.1002/mrm.1910370523. [DOI] [PubMed] [Google Scholar]
- 4.Harshbarger TB, Twieg DB. Iterative reconstruction of single-shot spiral MRI with off resonance. IEEE Trans Med Imaging. 1999;18:196–205. doi: 10.1109/42.764889. [DOI] [PubMed] [Google Scholar]
- 5.Ahunbay E, Pipe JG. Rapid method for deblurring spiral MR images. Magn Reson Med. 2000;44:491–494. doi: 10.1002/1522-2594(200009)44:3<491::aid-mrm22>3.0.co;2-z. [DOI] [PubMed] [Google Scholar]
- 6.Moriguchi H, Dale BM, Lewin JS, Duerk JL. Block regional off-resonance correction (BRORC): a fast and effective deblurring method for spiral imaging. Magn Reson Med. 2003;50:643–648. doi: 10.1002/mrm.10570. [DOI] [PubMed] [Google Scholar]
- 7.Sutton BP, Noll DC, Fessler JA. Fast, iterative image reconstruction for MRI in the presence of field inhomogeneities. IEEE Trans Med Imaging. 2003;22:178–188. doi: 10.1109/tmi.2002.808360. [DOI] [PubMed] [Google Scholar]
- 8.Noll DC, Pauly JM, Meyer CH, Nishimura DG, Macovski A. Deblurring for non-2D Fourier transform magnetic resonance imaging. Magn Reson Med. 1992;25:319–333. doi: 10.1002/mrm.1910250210. [DOI] [PubMed] [Google Scholar]
- 9.Man LC, Pauly JM, Macovski A. Improved automatic off-resonance correction without a field map in spiral imaging. Magn Reson Med. 1997;37:906–913. doi: 10.1002/mrm.1910370616. [DOI] [PubMed] [Google Scholar]
- 10.Chen W, Meyer CH. Fast automatic linear off-resonance correction method for spiral imaging. Magn Reson Med. 2006;56:457–462. doi: 10.1002/mrm.20973. [DOI] [PubMed] [Google Scholar]
- 11.Nayak KS, Tsai CM, Meyer CH, Nishimura DG. Efficient off-resonance correction for spiral imaging. Magn Reson Med. 2001;45:521–524. doi: 10.1002/1522-2594(200103)45:3<521::aid-mrm1069>3.0.co;2-6. [DOI] [PubMed] [Google Scholar]
- 12.Sutton BP, Noll DC, Fessler JA. Dynamic field map estimation using a spiral-in/spiral-out acquisition. Magn Reson Med. 2004;51:1194–1204. doi: 10.1002/mrm.20079. [DOI] [PubMed] [Google Scholar]
- 13.Chen NK, Oshio K, Panych LP. Application of k-space energy spectrum analysis to susceptibility field mapping and distortion correction in gradient-echo EPI. Neuroimage. 2006;31:609–622. doi: 10.1016/j.neuroimage.2005.12.022. [DOI] [PubMed] [Google Scholar]
- 14.Kadah YM, Hu X. Simulated phase evolution rewinding (SPHERE): a technique for reducing B0 inhomogeneity effects in MR images. Magn Reson Med. 1997;38:615–627. doi: 10.1002/mrm.1910380416. [DOI] [PubMed] [Google Scholar]
- 15.Cuppen JJ, Groen JP, Konijn J. Magnetic resonance fast Fourier imaging. Med Phys. 1986;13:248–253. doi: 10.1118/1.595905. [DOI] [PubMed] [Google Scholar]
- 16.Lee D, Nayak KS, Pauly JM. Reducing spurious minima in automatic off-resonance correction for spiral imaging. Proceedings of the 12th Annual Meeting of the ISMRM; Kyoto, Japan. 2004. p. 2678. [Google Scholar]
- 17.Glover GH. Simple analytic spiral k-space algorithm. Magn Reson Med. 1999;42:412–415. doi: 10.1002/(sici)1522-2594(199908)42:2<412::aid-mrm25>3.0.co;2-u. [DOI] [PubMed] [Google Scholar]
- 18.Truong T-K, Chen B, Song AW. Integrated SENSE DTI with correction of susceptibility- and eddy current-induced geometric distortions. NeuroImage. 2008;40:53–58. doi: 10.1016/j.neuroimage.2007.12.001. [DOI] [PMC free article] [PubMed] [Google Scholar]
- 19.Zibetti MVW, De Pierro AR. A new distortion model for strong inhomogeneity problems in echo-planar MRI. IEEE Trans Med Imag. 2009;28:1736–1753. doi: 10.1109/TMI.2009.2022622. [DOI] [PubMed] [Google Scholar]
- 20.Truong T-K, Clymer BD, Chakeres DW, Schmalbrock P. Three-dimensional numerical simulations of susceptibility-induced magnetic field inhomogeneities in the human head. Magn Reson Imaging. 2002;20:759–770. doi: 10.1016/s0730-725x(02)00601-x. [DOI] [PubMed] [Google Scholar]
- 21.Heidemann RM, Griswold MA, Seiberlich N, Krüger G, Kannengiesser SA, Kiefer B, Wiggins G, Wald LL, Jakob PM. Direct parallel image reconstructions for spiral trajectories using GRAPPA. Magn Reson Med. 2006;56:317–326. doi: 10.1002/mrm.20951. [DOI] [PubMed] [Google Scholar]


