Abstract
With recent advances in animal models of disease, there has been great interest in capabilities for high-resolution contrast-enhanced ultrasound imaging. Microbubble contrast agents are unique in that they scatter broadband ultrasound energy because of their nonlinear behavior. For optimal response, it is desirable to excite the microbubbles near their resonant frequency. To date, this has been challenging with high-frequency imaging systems because most contrast agents are resonant at frequencies in the order of several megahertz. Our team has developed a unique dual-frequency confocal transducer which enables low-frequency excitation of bubbles near their resonance with one element, and detection of their emitted high-frequency content with the second element. Using this imaging approach, we have attained an average 12.3 dB improvement in contrast-to-tissue ratios over fundamental mode imaging, with spatial resolution near that of the high-frequency element. Because this detection method does not rely on signal decorrelation, it is not susceptible to corruption by tissue motion. This probe demonstrates contrast imaging capability with significant tissue suppression, enabling high-resolution contrast-enhanced images of microvascular blood flow. Additionally, this probe can readily produce radiation force on flowing contrast agents, which may be beneficial for targeted imaging or therapy.
I. Introduction
Ultrasound is a popular modality for imaging animal models of human diseases because of its portability, is a popular modality for imaging animal models of human diseases because of its portability, relatively low cost, and real-time imaging capability. Studies have demonstrated that high-resolution ultrasound imaging is an effective approach for non-invasive imaging in rodents, which are used extensively as pre-clinical models for understanding tumor development or response to therapy [1]–[4]. Lipid-encapsulated microbubbles are often implemented as contrast agents during these ultrasound studies to improve detection of blood flow [5]. Their use requires an intravascular injection of a solution of microbubbles immediately before an imaging exam. After their injection, the microbubble contrast agents (MCAs) traverse the circulatory system with similar rheology to erythrocytes [6]. The acoustic impedance mismatch between the gas cores of MCAs and the surrounding blood and tissue is approximately four orders of magnitude [7], causing them to scatter significantly more ultrasound energy than blood components, and thus enabling improved sensitivity of ultrasound to blood flow.
The most basic method of contrast enhanced ultrasound relies on receiving the acoustic signal scattered from microbubbles at the fundamental imaging frequency. One limitation to this detection method is that echoes from both tissue and MCAs are in the same frequency band. This necessitates a large quantity of injected MCAs to compete with the inherent and unwanted tissue backscatter. However, owing to the broadband and nonlinear acoustic responses of these gas-filled spheres it is possible to overcome this limitation with other detection strategies.
The most powerful MCA imaging methods are derived from the nonlinear responses of microbubbles to ultrasound, providing distinct differences in microbubble echo signatures when compared with the linear responses of tissue and blood. Imaging modes such as harmonic imaging [8], subharmonic imaging [9], [10], phase inversion [11], [12], contrast pulse sequence [13], [14], and contrast harmonic imaging [15] exploit MCAs’ nonlinear response; all of these methods provide improved contrast-to-tissue ratios compared with the previously described fundamental mode imaging. Although these nonlinear imaging methods are now widely utilized in commercial ultrasound systems operating in the 1 to 15 MHz range, they are more challenging to implement in high-frequency ultrasound systems. One likely reason for this is that optimal MCA response requires excitation near the resonant frequency [16], which is approximately 14 to 1.5 MHz for lipid-encapsulated bubbles that are 0.8 to 4 μm in diameter, respectively. Most commonly available commercially produced MCAs fall within this diameter range.
Recently, dual-frequency excitation-detection been demonstrated by using either two confocal transducers [17], or alternating elements in a linear array [18]. Bouakaz demonstrated that a contrast-to-tissue ratio of 40 dB over conventional b-mode imaging could be attained using a dual-frequency imaging technique with excitation at 0.8 MHz and detection at 2.8 MHz [17]. Kruse demonstrated that when the bubbles were excited with several hundred kilo- pascals at 2.25 MHz, broadband frequency content could be detected from the contrast agents as high as 45 MHz [18]. These initial studies by Kruse provided the proof-of-concept for implementing the dual-frequency imaging method with higher frequencies suitable for implementation in small animal imaging studies. A dual-frequency approach enables the use of low frequencies to excite MCAs, with simultaneous detection of the broadband backscatter produced by oscillating or fragmenting bubbles, preserving high spatial resolution while suppressing background from tissue.
For in vivo dual-frequency imaging, we have designed a prototype dual-frequency imaging transducer which has been integrated with a Vevo770 small animal imaging system (VisualSonics, Toronto, ON, Canada). In this manuscript, we present results from initial studies on the performance of the dual-frequency probe from several studies performed in rats. Our studies assess contrast-to-tissue ratios compared with traditional high-frequency b-mode imaging, and sensitivity to tissue motion compared with image subtraction and power-Doppler, common methods utilized to detect contrast agents at high frequencies. Our dual-frequency imaging strategy provides improved contrast over traditional high-frequency b-mode imaging as well as a reduction in sensitivity to animal motion compared with both image subtraction and power-Doppler methods. Additionally, we examine the capacity of the probe to produce acoustic radiation force, which is maximized on microbubbles when excited near their resonant frequency [19]. Radiation force has been demonstrated to enhance the delivery of acoustically-active drug delivery vehicles [20], [21], and to enhance the retention of targeted contrast agents [22], [23].
II. Materials and Methods
A. Experimental Equipment and Setup
1) The Dual-Frequency Probe
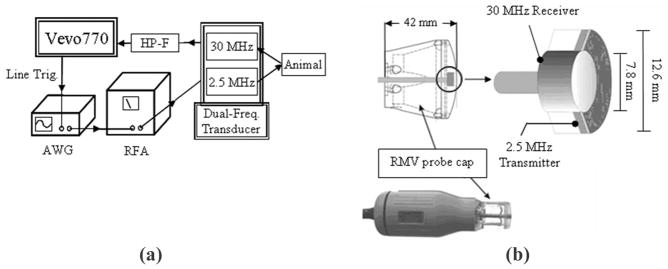
The confocal imaging probe designed by our group is an adaptation of a VisualSonics RMV707 ultrasound probe and is used with a VisualSonics Vevo 770 micro-imaging system, a commonly implemented preclinical ultrasound imaging system. Traditionally, the high-frequency piston transducer element within the RMV probe mechanically sweeps to obtain images. An additional 2.5 MHz transducer was added confocally outside the inner 30 MHz element in the adapted setup [Fig. 1(b)]. This outer low-frequency transducer enabled us to transmit at a frequency near MCA resonance, while receiving the emitted high-frequency signal content with the inner transducer. A schematic displaying how the waveforms were delivered and received by the setup can be seen in Fig. 1(a).
Fig. 1.
(a) Schematic for the operation of the prototype dual frequency transducer. The arbitrary waveform generator (AWG) (Sony Tektronix) was triggered to send 512 low-frequency pulses through the RF amplifier (RFA) within each frame of image data by the Vevo770 line trigger. (b) A diagram displaying how the two confocal elements were constructed within the RMV probe scanhead.
After the low-frequency pulses are delivered into the animal, the 30-MHz inner element receives the reflected ultrasound signal. The unwanted backscatter of tissue is suppressed by sending each line of raw RF data through a seventh-order 10-MHz high-pass filter [HP-F, in the Fig. 1(a) schematic] (TTE Inc., Los Angeles, CA) before being displayed and saved by the ultrasound imaging system.
2) Characterizing the Probe
Using a 40-μm needle hydrophone (Precision Acoustic, Dorchester, UK) and a 3-D motion stage, the beam-fields of the dual-frequency probe’s two individual elements were measured at their foci. The pressure outputs of the two elements were also measured relative to the center of the high-frequency element.
To determine the resolution achievable with our dual-frequency imaging approach, two studies were performed. One of these studies was based on the collected RF data from single MCAs, which enabled us to make estimations about the theoretical limits, or best case for axial resolution using our imaging parameters. The second study was based on video data collected from single bubbles, which allowed us to determine the point spread function of our imaging system and thus determine the practical lateral and axial resolutions achievable in actual ultrasound studies implementing our parameters. Axial and lateral are defined as the parallel and orthogonal directions of wave propagation respectively. Within an image, axial represents the depth axis.
For the first resolution study, a dilute concentration of MCAs was pumped through a 27-gauge needle tip coupled to a 380-μm polyethylene tube (Becton Dickinson, Sparks, MD), which was then coupled to a 200-μm capillary tube (Spectrum Labs, Rancho Dominguez, CA) The transducer was set to acquire data with a frame rate of approximately 1 Hz and bubbles were pumped through the capillary tube at 1 mL/h, which corresponded to a linear flow velocity of 9 mm/s. RF data was collected with the 30 MHz element of individual bubble responses for single cycle excitations at 2.5 MHz and at peak negative pressure of 617 kPa. After more than 100 bubble responses were acquired, the time-domain signals were Fourier transformed and averaged together in the frequency domain. Once all pulses had been averaged, the mean frequency-domain signal was then inverse-Fourier transformed to yield a mean time-domain signal. The envelope of this mean signal was determined using Matlab (The MathWorks, Natick, MA), via the absolute value of the Hilbert transform, and the full-width at half-maximum (FWHM) of the envelope used to yield the theoretical limit of the axial resolution for dual-frequency imaging at our pulsing and receiving parameters.
For the second resolution study, a dilute concentration of bubbles was pumped through a setup similar to the one described for the first resolution study. The tube was oriented horizontally and imaged at 2.5 MHz at a 1 Hz rate. The video data were exported as uncompressed AVI files and analyzed offline in Matlab. Because the concentration of bubbles was dilute, not all frames contained images of bubbles, though in each video frame containing a bubble, its center was manually defined. The vertical and horizontal cross-sections through this point were extracted from the image data (representing the axial and lateral components of the point spread function, respectively), interpolated, and the FWHM in each dimension was determined. Thirty samples were collected and averaged. The mean FWHMs in each direction—lateral and axial—were taken as their respective directional resolutions.
3) Animal and Contrast Agent Preparation
A total of eight Sprague-Dawley rats (Harlan Laboratories, Indianapolis, IN) were imaged in the course of this study: three during the contrast-to-tissue comparison study and five during the sensitivity to motion study. Before all imaging studies, animals were prepared in the same way.
Each animal was first anesthetized in an induction chamber by introducing a 5% aerosolized isoflurane-oxygen mixture. Once sedated, the animal was removed from the induction chamber, the isoflurane concentration reduced from 5% to 2% and maintained via mask delivery. Its abdomen was shaved and a depilating cream was applied to the animal’s skin to dissolve any remaining hair. A 24-gauge catheter was inserted into the animal’s tail vein for the administration of MCAs. The animal was then placed in dorsal recumbancy on a heating pad. Finally, ultrasound coupling gel was placed between the imaging transducer and the animal’s skin to ensure the quality of signal transmission. Animals were handled according to National Institutes of Health guidelines and our study protocol was approved by the UNC Institutional Animal Care and Use Committee.
The MCAs used in this study were made with a lipid shell and perfluorocarbon core as described previously [24]. Contrast agents were diluted in sterile saline to result in a final concentration of 2.2 × 10⁹ bubbles/mL (unless otherwise stated) and a mean diameter of 0.8 ± 0.4 μm, determined with a particle-sizer (Accusizer 780A, Particle Sizing Systems, Santa Barbara, CA).
B. Determining Contrast-to-Tissue Ratios
Two studies were performed to examine how imaging pressure affected the probe’s sensitivity to contrast. This sensitivity was quantified with the measure of contrast-to-tissue ratio (CTR). The first study was performed in vitro, and was designed to determine the acoustic responses of both tissue and contrast agents when subjected to the imaging parameters utilized by our probe. The second study was an in vivo study, which compared the CTRs achieved by the probe operating in both high-frequency and dual-frequency imaging modes within an actual tissue environment.
1) In Vitro CTR Study
For the in vitro CTR study, individual MCAs in a flow phantom were imaged in dual-frequency mode at four different mechanical indices (MIs) between 0.33 and 0.57. Bovine muscle tissue was also imaged at the same parameters to simulate the acoustic response of non-perfused tissue. The lines of RF data from these scans were Fourier transformed and divided by the frequency bandwidth of the receiving element. This allowed us to appropriately weight the frequencies in the measured signal which were higher and lower than the probe’s 30 MHz fundamental frequency. By doing this, we were able to compare the spectral power of the true bubble and tissue signals and thus, to compute a theoretical CTR versus frequency plot for multiple imaging pressures (regardless of our specific receiving element’s sensitivity).
2) In Vivo CTR Study
Three animals were imaged for the CTR study. Their kidneys were selected as the imaging region of choice because of the organ’s high degree of vascularization, thus providing an opportune target to image large numbers of injected MCAs. Each animal had both kidneys imaged in both dual-frequency and high-frequency modes, resulting in six independent trials. Contrast agents were delivered at a continuous infusion rate of 3 mL/h using a syringe pump (Harvard Apparatus, Holliston, MA). The MCA solution was allowed one minute to reach equilibrium before any image data was collected. Approximately 20 video frames were acquired at 2 Hz in both high-frequency and dual-frequency modes at each of the six imaging locations. The dual-frequency mode was operated with a 2.5-MHz pulsing frequency and a 30-MHz receiver element. The high-frequency imaging mode was operated with pulse-echo only from the 30-MHz element. Both imaging modes used one-cycle sinusoidal driving pulses. Different image pulsing pressures were evaluated in both imaging modes, as summarized in Table I.
Table I.
A Summary of the Imaging Pressures and Mechanical Indices Used in the In Vivo Contrast-to-Tissue Study for Dual-Frequency and High-Frequency Imaging Modes.
| Dual-Frequency (Transmit 2.5 MHz) |
High-Frequency (Transmit 30 MHz) |
||
|---|---|---|---|
| PNP (kPa) | MI | PNP (kPa) | MI |
| 292 | 0.18 | 978 | 0.18 |
| 391 | 0.25 | 1318 | 0.24 |
| 492 | 0.31 | 1935 | 0.35 |
| 617 | 0.39 | 2347 | 0.43 |
| 716 | 0.45 | 2792 | 0.51 |
| 814 | 0.51 | 3295 | 0.60 |
| 900 | 0.57 | 3514 | 0.64 |
| 1030 | 0.65 | 3881 | 0.71 |
For analysis of CTR at each tested parameter, the onboard software of our ultrasound system was utilized after all data had been collected. Regions of interest (ROIs) were defined for both contrast and tissue regions for each kidney imaged. The centers of all ROIs were defined within 1 mm of the transducers’ foci to ensure that we were consistently sampling from imaged regions of tissue that had received a similar amount of acoustic energy. Although different ROIs for both tissue and contrast regions were defined for the six different kidneys imaged, the same ROIs were applied to the data sets collected in each of the kidneys at the different imaging parameters. B-mode images were acquired before and after each administration of contrast agents to ensure consistency of the contrast and tissue ROIs used for each kidney over time (i.e., to ensure they were not corrupted by global shifts in tissue). The mean pixel intensity in the ROIs were calculated at each imaging parameter and compared between animals.
C. Determining Sensitivity to Motion
To test the robustness of the dual-frequency method in the presence of respiratory motion, five animals were imaged with power-Doppler, image-subtraction, and dual-frequency imaging modes. The imaging protocol consisted of administering 150-μL bolus injections of MCAs, and observing the kidney without respiratory gating as the contrast washed out of the system. The goal was to examine the different imaging modes’ abilities to detect the sharp increase in video intensity following the introduction of MCAs into the renal volume, as well as their consistency in monitoring the steady decrease in intensity as the contrast agents were cleared from the different animals’ systems. To record the entire contrast washout curve, the left kidney of each animal was imaged for at least 6 min following each injection. All three imaging modes were tested within the same anatomical region of each animal (meaning neither the animal nor the transducer was moved between data acquisitions with different imaging modes). Following the collection of data, videos were exported and examined offline in Matlab for analysis of these curves.
D. Production of Radiation Force
The ability of the dual-frequency probe to produce radiation force was tested in vitro in a water bath. MCAs were prepared and pumped through a 200-μm cellulose tube using a syringe pump (Harvard Apparatus, Holliston, MA) at several different constant volumetric flow rates. These flow rates are summarized in Table II along with the corresponding linear flow velocities.
Table II.
A Summary of the Range of Blood Velocities in Different Vasculature Types.
| Volumetric flow rate (mL/h) | Linear flow velocity (mm/s) | Analogous blood vessel environment |
|---|---|---|
| 9.05 | 200 | Large artery |
| 1.81 | 40 | Small artery |
| 1.81 | 40 | Large vein |
| 0.90 | 20 | Arteriole |
| 0.45 | 10 | Small vein |
| 0.14 | 3 | Venule |
| 0.01 | 0.3 | Capillary |
Modified from [25]. These velocities formed the basis for the tested range of flow velocities of contrast agents undergoing radiation force.
The tube was oriented horizontally, and was located at the focus of both the dual-frequency probe and a high-speed camera (APX-RS, Photron, San Diego, CA) equipped with a 60× water immersion lens (LUMPlanFI/w, Olympus, Melville, NY). The axes of the camera and the transducer were perpendicularly aligned with the tube at the same location. This dual-focus setup was achieved by positioning a needle hydrophone in the optical focus, and aligning the pulsing transducer such that the measured signal from the hydrophone was maximized. The MCA solution was then pumped through a 200-μm tube at the different flow rates and exposed to 200-cycle low amplitude pulses [peak negative pressure (PNP) ~ 12.5 kPa] at 4 MHz and a pulse repetition frequency of 15 kHz. This frequency was out of the optimal bandwidth of the low-frequency element, but was chosen to reduce bubble destruction. The effects of these pulses were observed in real time as well as recorded to later confirm the efficiency of the radiation force pulses offline.
III. Results
A. Characterizing the Probe
The −6-dB beamwidth in the focal planes of the 30-MHz and 2.5-MHz transducers were determined to be 0.21 mm and 0.51 mm, respectively. The axial −6-dB focal regions (depths of field) were determined to be 2.7 mm and 10.3 mm for the two respective elements. The experimentally determined limit of axial resolution, measured using the FWHM of the RF data for averaged MCA bubble responses, was 95 ± 3.47 μm. The uncertainty in this measurement is the standard deviation of the FWHMs collected at the different mechanical indices tested (N = 8, between MI of 0.28 and 0.57). There was not a significant trend observed in this value with increasing low-frequency MI. The experimentally determined lateral resolution of the probe operating in dual-frequency mode, as estimated from the average FWHM of a horizontal profile taken through a bubble response in multiple frames of video data, was 296 ± 67 μm. Likewise, the experimentally determined axial resolution was determined to be 161 ± 31 μm via the mean FWHM in the vertical profiles acquired in the same method. The uncertainty in these measurements is the standard deviation of the FWHM values (N = 32 for both).
B. Contrast-to-Tissue Ratios
1) In Vitro CTR Study
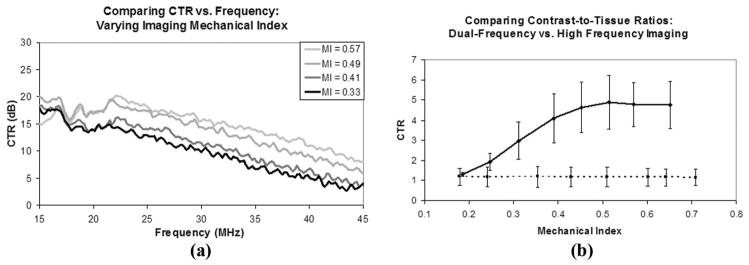
The acoustic responses of both bubbles and tissue were used to create a measure of CTR versus receive frequency at several different mechanical indices for the imaging pulses. A plot of this data can be seen in Fig. 2(a). The signals from both the MCAs and tissue were corrected for the receiving element’s bandwidth to measure the ratios of their spectral content irrespective of the imaging system used to detect the signals. The data shows improved CTR with increasing mechanical index. The CTR versus frequency plots also demonstrate this improved contrast sensitivity relative to tissue with increasing mechanical index. Between the mechanical indexes tested, a similarly decreasing slope of 1 dB/MHz is observed throughout the bandwidth of the probe. The decibel values in Fig. 2(a) are relative to the tissue responses at each frequency and MI.
Fig. 2.
(a) Contrast-to-tissue ratios measured in vitro as a function of frequency at several different mechanical indices of incident pulses. Decibel values are relative to the tissue response at each frequency and MI. (b) Contrast-to-tissue ratios measured in vivo in six different kidneys which were imaged in both high-frequency b-mode (dashed line) and dual-frequency mode (solid line).
2) In Vivo CTR Study
The video data collected from contrast enhanced ultrasound studies on both kidneys of three different animals in both traditional high-frequency b-mode and dual-frequency imaging modes were analyzed to determine CTR in an in vivo environment. Both a 2-D slice and a 3-D maximum intensity projection of a kidney imaged in dual-frequency mode can be seen in Fig. 3, providing a representative view of the extent of tissue suppression provided by this imaging method. In a 2-D image slice of each kidney, ROIs were selected around regions of tissue and contrast for both the dual-frequency and high-frequency imaging studies, and these values were used to determine the CTR at each imaging pressure. These values are plotted in Fig. 2(b).
Fig. 3.
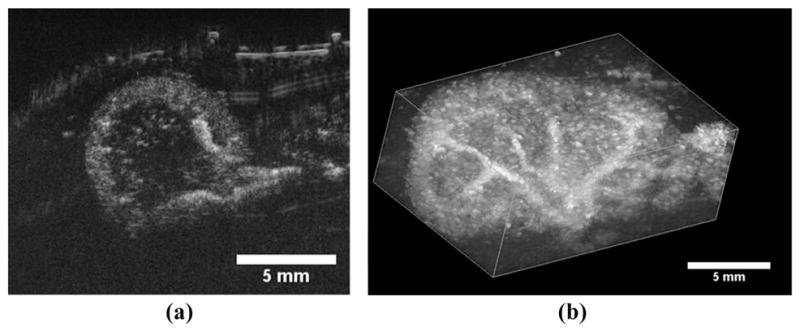
(a) A 2-D transverse slice through a rat kidney with contrast agents seen entering the volume through the large renal vasculature. (b) A 3-D maximum intensity projection through a rendered volume of sequential image slices as seen in (a). The multiple 2-D slices were acquired using a translational motor stage with step sizes of 200 μm. The images analyzed in the CTR portion of this study were identical to the cross-sectional slice seen in (a).
The CTR in the high-frequency in vivo imaging studies was nearly constant as a function of pressure, with an average value of 1.18 ± 0.01. Across the pressures studied (1000 to 4000 kPa), the mean pixel intensity within regions of contrast flow were only 18% greater than those of tissue. The mean in vivo CTR values obtained in the dual-frequency mode ranged between 1 and 5 for the pressures tested, with a linear increase between MI = 0.19 and 0.51 (290 and 813 kPa) with a slope of 0.0074 kPa−1 (R2 = 0.97). At dual-frequency imaging pressures higher than 813 kPa, the CTR data leveled off and approached an average value of 4.8.
Thus, at pressures greater than approximately 800 kPa, the dual-frequency imaging method resulted in an average 12.3 dB improvement in CTR, compared with high-frequency b-mode imaging, for this range of mechanical indices. The maximum improvement in CTR between two images acquired from the same anatomical location with dual-frequency imaging mode compared with high-frequency b-mode was 17.2 dB at a low-frequency MI of 0.51.
C. Sensitivity to Motion
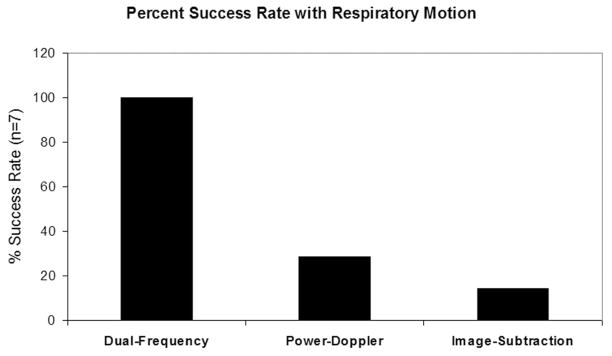
Within the seven sets of image data collected in five different animals with power-Doppler, image subtraction, and dual-frequency imaging modes without respiratory gating, dual-frequency imaging was significantly more robust at monitoring the presence of MCAs. Because of the artifacts in the video data resulting from respiratory motion, the image-subtraction method was unreliable without respiratory gating. In this mode, the changes in video intensity caused by tissue motion were approximately the same amplitude as the signal from the circulating contrast, and we were only able to observe a decay slope of the contrast washout in the kidney ROI in one of the animals.
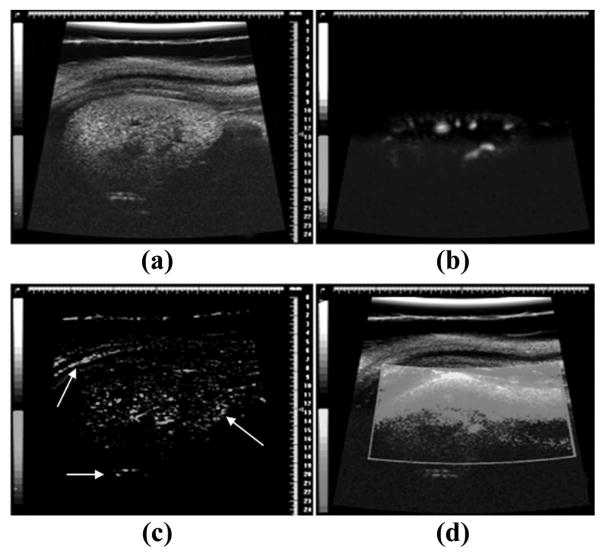
Similarly, 5 of 7 imaging studies using power-Doppler were corrupted to the point that a washout curve could not be acquired. Examples of how these imaging modes were corrupted by breathing motion can be seen in Fig. 4. In contrast, the dual-frequency imaging experiments (N = 7) produced a defined contrast washout curve in each case despite substantial respiratory motion. Fig. 5 illustrates the relative success rates for the different imaging strategies, with dual-frequency mode demonstrating a 3.5- and 7-fold improvement over power-Doppler and image-subtraction, respectively.
Fig. 4.
Example image data collected from the same animal without respiratory gating enabled. (a) B-mode imaging before the introduction of contrast agents. (b) Dual-frequency data while contrast is circulating. (c) Image-subtraction frame while contrast is circulating. Note the strong artifacts near the tissue borders (indicated by white arrows). (d) Power-Doppler with contrast circulating. Small regions of enhanced contrast can be seen near the bottom of the image, although most of ROI is washed out by motion artifact.
Fig. 5.
A plot comparing the abilities of the three different imaging modes to monitor contrast flow in the presence of respiratory motion. Values are expressed as a percentage of the seven attempted trials.
D. Production of Radiation Force
Using a dual optical-acoustic focus and contrast agents flowing in a 200-μm cellulose tube, we have verified that the probe is capable of applying radiation force in vitro. The transducer was aligned above the tube and the incident radiation force pulses were capable of pushing a polydisperse distribution of flowing MCAs perpendicular to their direction of motion against buoyancy. The proficiency of these sequences of radiation force pulses, administered with a single 3-second sweep, was tested at several different linear flow velocities between 0.3 and 200 mm/s, as summarized in Table II. The radiation force pulses from the probe were able to divert the flow of contrast agents a distance of 200 μm—the diameter of the tube—at all linear flow velocities less than 50 mm/s. At flow rates faster than this, the direction of the MCA stream was perturbed, though did not significantly divert within the viewing window of 500 μm. At 200 mm/s, the stream was only estimated to divert approximately 50 μm at our push parameters. The ability to divert the stream is well visualized with time-axis projections, an example of which is seen in Fig. 6. In this image, the mean intensities of movie pixels throughout the time of data collection are mapped to pixels in a single 2-D image.
Fig. 6.

A time-axis projection image produced from bright-field optical video data, which demonstrates the proficiency of the dual-frequency probe at diverting a moving stream of MCAs. The linear flow velocity in this image was 40 mm/s, a comparable speed to a human small artery or large vein.
IV. Discussion
Based upon the work of Kruse et al. [17], we hypothesize that the high-frequency energy that we are detecting from the microbubbles is generated during the rapid collapse of the gas core during the low-frequency driving pulse. In the frequency domain, these emitted acoustic transients were confirmed to be very broadband, as seen in Fig. 2(a), allowing them to be detected at frequencies far away from the fundamental.
The 3-D hydrophone scans performed to map the beam-fields of our dual-frequency probe’s two elements revealed that the inner and outer elements were misaligned. Neither transducers’ focus perfectly overlapped the center of the z-axis of the mechanically scanning arm, with the low-frequency element having an off-axis misalignment of 255 μm compared with the high-frequency element’s 16 μm. There were several consequences of this misalignment. One issue with this was that the focus of the 30-MHz element overlapped the 2.5-MHz element approximately −6 dB from the focus, and hence the signal intensity from the microbubbles detected during dual-frequency mode was substantially less than optimal. One other consequence was that the microbubbles were rapidly destroyed outside of the imaging region because of a higher pressure at the focus of the misaligned 2.5-MHz transducer. This resulted in differences in the contrast intensity depending on whether the transducer was scanning with the focus of the 2.5-MHz element preceding or following the imaging element.
Another limitation of the prototype probe compared with the standard mechanically scanned probes made by VisualSonics was the reduced maximum frame rate. The maximum sweep speeds of for RMV probes vary between 25 and 75 Hz, depending on the model of the probe and the imaging depth of field, however, the speed of the prototype probe was limited as a result of the increased mass incurred by the outer confocal element to 20 Hz.
For all imaging pressures tested, the CTR versus frequency curve peaked at approximately 15 MHz, and decreased from there with increasing frequency [Fig. 2(a)]. This decline in CTR was caused by the decrease in spectral power of the acoustical transients at the higher frequencies, because the spectral power of the tissue signal quickly approached the noise floor above the fundamental imaging frequency of 2.5 MHz. The CTR increased uniformly across all frequencies in the bandwidth of the receiving element with increasing imaging MI, which can be attributed to more violent collapses of the MCA gas cores at increasing pressures.
The results obtained during the in vivo CTR portion of the study showed that the dual-frequency imaging method could be used in animal studies to improve contrast sensitivity over conventional high-frequency imaging methods. High-frequency b-mode imaging showed little improved contrast signal over tissue signal regardless of imaging pulse pressure. The average CTR in high-frequency b-mode was 1.18. Dual-frequency imaging of the same animals and the same imaging locations showed a linearly increasing trend in average CTR ranging from 1.3 to 4.8, increasing as a function of increasing imaging pressure. After approximately 800 kPa, the rate of increase in the contrast signal was similar to that of the tissue signal and the CTR did not noticeably improve at higher imaging pressures.
There was an approximately 10-fold difference between the in vitro and in vivo CTR studies when implementing dual-frequency imaging at the pressures listed in Table II. It is important to note that the in vitro analysis of CTR was performed without consideration for several realities present in the in vivo study, and in all ultrasound imaging exams. The simplifying factors of the in vitro setup which artificially enhanced the measured CTR were, namely, the absence of signal attenuation expected to occur in a tissue medium, and the analysis of RF data mitigated the loss of signal information inherent in any imaging system’s compression and video-data display algorithms. Instead, this data served to provide a basic understanding of the dual-frequency acoustic responses of MCAs and tissue at frequencies higher than previously examined.
In Figs. 3 and 4(b), it is clear that the larger vasculature within the kidney is brighter and better delineated from the surrounding tissue than smaller blood vessels. Thus the contrast provided by our dual-frequency imaging method appears to be, predictably, a function the quantity of contrast agents present within the imaging ROI. If the probe is to be operated within a destructive pressure regime for MCAs (a range which provided the best contrast within our in vivo CTR study [26]), one potential limitation of our imaging strategy would be the need to delay imaging pulses to allow contrast refresh within the micro-vasculature. This decreased frame rate would be beneficial for imaging tissues with slow perfusion times.
The dual-frequency imaging method was compared with power-Doppler and image-subtraction, two common methods to monitor the presence and flow of contrast with ultrasound on high-frequency imaging systems. Power-Doppler is very effective at detection of contrast agents because of the high-amplitude post wall-filtered power produced by moving or breaking bubbles. However, as a result of this detection strategy, power-Doppler also proved very sensitive to tissue motion. Image-subtraction, another method to monitor contrast presence, compares a pre-contrast baseline image to contrast enhanced images on a pixel-by-pixel basis, and likewise proved very sensitive to tissue movement. This tissue motion resulted in many pixels differing from their original baseline values, yielding substantial artifacts, especially along boundaries between tissue types, as indicated by the white arrows in Fig. 4(c). Our results suggest that both of these methods require respiratory gating to produce consistent results in a high-tissue-motion environment. Even when respiratory gating was enabled, implementing these two imaging methods could be a challenge if tissue motion is excessive, because global tissue migration will invalidate the original pre-contrast baseline images. Dual-frequency imaging, on the other hand, exploits the non-linear response of MCAs to enhance contrast signal intensity and thus proved significantly more robust in the presence of respiration-induced tissue motion than either power-Doppler or image-subtraction methods.
Although not shown here, we were able to generate overlays of contrast data over the b-mode tissue by utilizing a relay circuit to toggle excitation of the low-frequency and high-frequency elements with successive imaging frames, and then displaying successive tissue and contrast frames together by color coding the contrast data.
Based on the results of the in vitro radiation force experiments, the dual-frequency probe could be utilized to direct microbubbles to the endothelial wall in targeted imaging studies over a range of physiologically relevant flow velocities. Additionally this ability could be implemented in acoustically-mediated drug delivery studies, because the probe is also capable of delivering acoustic energy above the bubble destruction threshold, which would facilitate site-specific release of therapeutic agents.
Although the studies within this manuscript were performed in rats, its resolution as well as its sensitivity makes its implementation in mice studies also highly attractive. However, the high-frequency components come at the cost of a loss in penetration depth (less than ~2 cm), and thus our specific parameters are less suitable for clinical application and more appropriate for translational research with small animal models. The combination of high contrast-to-tissue ratios and high spatial resolution achievable with our prototype probe make novel approaches to understanding and quantifying specific morphologies of pathologic vasculature an exciting possibility. For an additional perspective on our imaging strategy’s ability to visualize microvessels in vivo, the reader is referred to a supplemental video ( ) in which a volumetric rendering of the vasculature within a subcutaneous rat fibrosarcoma tumor model is displayed.
V. Conclusion
We have demonstrated that dual-frequency imaging can be utilized in vivo at higher frequencies than previously demonstrated to produce high-resolution images with high contrast-to-tissue ratios. Because of the substantial tissue suppression, this technique is robust in the presence of tissue motion. Additionally, the probe effectively produced radiation force in vitro on microbubbles with flow-rate parameters analogous to most types of environments found within a wide range of vasculature types.
Supplementary Material
Acknowledgments
This work was supported in part by the National Institutes of Health under grants 1R21EB005325 and 1R01EB009066, the Terry Fox Foundation, and the Canadian Cancer Society. R. Gessner is supported by a fellowship from the National Science Foundation. F.S. Foster discloses that he has a financial interest in VisualSonics. P. A. Dayton is on the Scientific Advisory Board for Targeson, LLC. Some materials in this manuscript were previously presented in the Proceedings of the 2009 IEEE Ultrasonics Symposium and are reprinted with permission from IEEE.
The authors thank I. Miles for her assistance with many of the animal imaging studies conducted during this study.
Biographies
Ryan C. Gessner received a B.S. degree in 2008 from the Physics Department at Acadia University in Nova Scotia, Canada. As an undergraduate, his honors research was based on improving the detection and awareness of radon gas in the homes of surrounding communities. After graduating, he began pursuing a Ph.D. degree in biomedical engineering from the Joint Biomedical Engineering Department at the University of North Carolina-Chapel Hill and North Carolina State University in 2008. His current research interests include ultrasound and the development of both 2-D and 3-D imaging techniques for microbubble contrast agents. In 2009, he was awarded a Graduate Research Fellowship from the National Science Foundation.
Marc Lukacs received his Ph.D. degree in applied physics from Queen’s University, Kingston, Ontario, Canada, in 1999. There, he developed PZT thick films, material characterization techniques, and laser micromachining processes, all for the fabrication of high-frequency linear and annular arrays. His interests are in the development of new devices and integrated module hardware. He has developed ultrasound linear array technology and IP for commercial devices above 20 MHz, and enjoys taking ideas from concept through to commercialization. He has also worked on the development of acoustic (SAW) and optical filters (power monitoring and gain equalization) for telecommunications. At present, he is a research associate at Sunnybrook and Women’s Health Sciences Centre pursuing the next good idea.
Mike H. Lee was born in Seoul, Korea, in 1984. He received his B.A.Sc. degree in engineering science from the University of Toronto, Toronto, ON, Canada, in May 2007. After graduation he began working as a research engineer at Sunnybrook Health Sciences Centre, Toronto, in the Department of Imaging Research, where he is currently continuing his research in fabricating various ultrasound transducers and developing high-frequency transducer arrays and beamformers.
Emmanuel Chérin received a Ph.D. degree in physical acoustics from the University of Paris VI, Paris, France, in 1998. Soon after, he joined the imaging research group at the Sunnybrook Health Sciences Centre, Toronto, ON, Canada, as a postdoctoral fellow. Since 2001, he has occupied the position of research associate with the ultrasound group, where he is involved in research projects related, in particular, to high-frequency transducer characterization, nonlinear acoustics, and contrast agent imaging.
F. Stuart Foster is currently a senior scientist at Sunnybrook Health Sciences Centre and Professor in the Department of Medical Biophysics at the University of Toronto, and Canada Research Chair in Ultrasound Imaging. His current research centers on the development of high-frequency clinical and preclinical imaging systems, array technology, intravascular imaging, and molecular imaging. Stuart is a fellow of the American Institute of Ultrasound in Medicine. He is the founder and CSO of VisualSonics Inc., a company aimed at preclinical imaging. Dr. Foster co-founded the Mouse Imaging Centre (MICe) now at the Toronto Centre for Phenogenomics. He has served on the Board of directors of the National Cancer Institute of Canada and as Chairman of its Committee on Research (ACOR). He has previously been the recipient of the Eadie Medal for major contributions to engineering in Canada and has recently been the recipient of the Queen’s Golden Jubilee Medal, the Manning Award of Distinction for Canadian Innovation, and the Ontario Premier’s Discovery Award. He serves on numerous advisory bodies and is currently on the editorial boards of Ultrasonic Imaging and Ultrasound in Medicine and Biology.

Paul Dayton received his B.S. degree in physics from Villanova University in 2005, his M.E. degree in electrical engineering from the University of Virginia in 1998, and his Ph.D. degree in biomedical engineering in 2001, also from the University of Virginia. He pursued post-doctoral research and was later research faculty at the University of California at Davis. Much of Dr. Dayton’s training was under the mentorship of Dr. Katherine Ferrara; his initial studies involved high-speed optical and acoustical analysis of individual contrast agent microbubbles. In 2007, Dr. Dayton accepted a faculty position in the Joint Department of Biomedical Engineering at UNC Chapel Hill and NC State University, Raleigh, where he is now Associate Professor and Director of the Graduate Program.
Dr. Dayton is a member of the technical program committee for IEEE UFFC, and a member of the editorial boards for the journals Molecular Imaging and Bubble Science, Engineering, and Technology. Dr. Dayton’s research interests involve ultrasound contrast imaging, ultrasound-mediated therapies, and medical devices.

Contributor Information
Ryan Gessner, University of North Carolina and North Carolina State University Joint Department of Biomedical Engineering, Chapel Hill, NC.
Marc Lukacs, University of Toronto and the Sunnybrook Health Science Centre, Sunnybrook Imaging Research, Toronto, ON, Canada.
Mike Lee, University of Toronto and the Sunnybrook Health Science Centre, Sunnybrook Imaging Research, Toronto, ON, Canada.
Emmanuel Cherin, University of Toronto and the Sunnybrook Health Science Centre, Sunnybrook Imaging Research, Toronto, ON, Canada.
F. Stuart Foster, University of Toronto and the Sunnybrook Health Science Centre, Sunnybrook Imaging Research, Toronto, ON, Canada.
Paul A. Dayton, Email: padayton@bme.unc.edu, University of North Carolina and North Carolina State University Joint Department of Biomedical Engineering, Chapel Hill, NC
References
- 1.Turnbull DH, Ramsay JA, Shivji GS, Bloomfield TS, From L, Sauder DN, Foster FS. Ultrasound backscatter microscope analysis of mouse melanoma progression. Ultrasound Med Biol. 1996;22(7):845–853. doi: 10.1016/0301-5629(96)00107-x. [DOI] [PubMed] [Google Scholar]
- 2.Chomas JE, Pollard RE, Sadlowski AR, Griffey SM, Wisner ER, Ferrara KW. Contrast-enhanced US of microcirculation of superficially implanted tumors in rats. Radiology. 2003 Nov;229(2):439–446. doi: 10.1148/radiol.2292020536. [DOI] [PubMed] [Google Scholar]
- 3.Elie N, Kaliski A, Péronneau P, Opolon P, Roche A, Lassau N. Methodology for quantifying interactions between perfusion evaluated by DCE-US and hypoxia throughout tumor growth. Ultrasound Med Biol. 2007 Apr;33(4):549–560. doi: 10.1016/j.ultrasmedbio.2006.09.011. [DOI] [PubMed] [Google Scholar]
- 4.Foster FS, Burns PN, Simpson DH, Wilson SR, Christopher DA, Goertz DE. Ultrasound for the visualization and quantification of tumor microcirculation. Cancer Metastasis Rev. 2000;19(1–2):131–138. doi: 10.1023/a:1026541510549. [DOI] [PubMed] [Google Scholar]
- 5.Sullivan JC, Wang B, Boesen EI, D’Angelo G, Pollock JS, Pollock DM. Novel use of ultrasound to examine regional blood flow in the mouse kidney. Am J Physiol Renal Physiol. 2009 Jul;297(1):228–235. doi: 10.1152/ajprenal.00016.2009. [DOI] [PMC free article] [PubMed] [Google Scholar]
- 6.Lindner JR, Song J, Jayaweera AR, Sklenar J, Kaul S. Microvascular rheology of Definity microbubbles after intra-arterial and intravenous administration. J Am Soc Echocardiogr. 2002 May;15(5):396–403. doi: 10.1067/mje.2002.117290. [DOI] [PubMed] [Google Scholar]
- 7.Dayton PA, Borden MA. Molecular Imaging in Oncology. New York, NY: Informa; 2008. Ultrasound Instrumentation and Techniques; p. 110. [Google Scholar]
- 8.Villanueva FS, Kaul S. Assessment of myocardial perfusion in coronary artery disease using myocardial contrast echocardiography. Coron Artery Dis. 1995 Jan;6(1):18–28. doi: 10.1097/00019501-199501000-00004. [DOI] [PubMed] [Google Scholar]
- 9.Cheung K, Couture O, Bevan PD, Cherin E, Williams R, Burns PN, Foster FS. In vitro characterization of the sub-harmonic ultrasound signal from Definity microbubbles at high frequencies. Phys Med Biol. 2008 Mar;53(5):1209–1223. doi: 10.1088/0031-9155/53/5/004. [DOI] [PubMed] [Google Scholar]
- 10.Forsberg F, Shi WT, Goldberg BB. Subharmonic imaging of contrast agents. Ultrasonics. 2000 Mar;38(1–8):93–98. doi: 10.1016/s0041-624x(99)00148-1. [DOI] [PubMed] [Google Scholar]
- 11.Burns PN, Wilson SR, Simpson DH. Pulse inversion imaging of liver blood flow: Improved method for characterizing focal masses with microbubble contrast. Invest Radiol. 2000 Jan;35(1):58–71. doi: 10.1097/00004424-200001000-00007. [DOI] [PubMed] [Google Scholar]
- 12.Simpson DH, Chin CT, Burns PN. Pulse inversion Doppler: A new method for detecting nonlinear echoes from microbubble contrast agents. IEEE Trans Ultrason Ferroelectr Freq Control. 1999;46(2):372–382. doi: 10.1109/58.753026. [DOI] [PubMed] [Google Scholar]
- 13.Phillips P, Gardner E. Contrast-agent detection and quantification. Eur Radiol. 2004 Oct;14(suppl 8):4–10. [PubMed] [Google Scholar]
- 14.Stieger SM, Dayton PA, Borden MA, Caskey CF, Griffey SM, Wisner ER, Ferrara KW. Imaging of angiogenesis using Cadence contrast pulse sequencing and targeted contrast agents. Contrast Media Mol Imaging. 2008 Jan;3(1):9–18. doi: 10.1002/cmmi.224. [DOI] [PubMed] [Google Scholar]
- 15.Saracco A, Aspelin P, Leifland K, Themudo R, Wilczek B, Axelsson R. Bolus compared with continuous infusion of microbubble contrast agent using real-time contrast harmonic imaging ultrasound in breast tumors. Acta Radiol. 2009 Oct;50:854–859. doi: 10.1080/02841850903085576. [DOI] [PubMed] [Google Scholar]
- 16.Sijl J, Gaud E, Frinking PJ, Arditi M, de Jong N, Lohse D, Versluis M. Acoustic characterization of single ultrasound contrast agent microbubbles. J Acoust Soc Am. 2008 Dec;124(6):4091–4097. doi: 10.1121/1.2997437. [DOI] [PubMed] [Google Scholar]
- 17.Bouakaz A, Frigstad S, Ten Cate FJ, de Jong N. Improved contrast to tissue ratio at higher harmonics. Ultrasonics. 2002 May;40(1–8):575–578. doi: 10.1016/s0041-624x(02)00172-5. [DOI] [PubMed] [Google Scholar]
- 18.Kruse DE, Ferrara KW. A new imaging strategy using wideband transient response of ultrasound contrast agents. IEEE Trans Ultrason Ferroelectr Freq Control. 2005 Aug;52:1320–1329. doi: 10.1109/tuffc.2005.1509790. [DOI] [PMC free article] [PubMed] [Google Scholar]
- 19.Dayton PA, Allen JS, Ferrara KW. The magnitude of radiation force on ultrasound contrast agents. J Acoust Soc Am. 2002 Nov;112(5 pt 1):2183–2192. doi: 10.1121/1.1509428. [DOI] [PubMed] [Google Scholar]
- 20.Shortencarier MJ, Dayton PA, Bloch SH, Schumann PA, Matsunaga TO, Ferrara KW. A method for radiation-force localized drug delivery using gas-filled lipospheres. IEEE Trans Ultrason Ferroelectr Freq Control. 2004 Jul;51:822–831. doi: 10.1109/tuffc.2004.1320741. [DOI] [PubMed] [Google Scholar]
- 21.Lum AF, Borden MA, Dayton PA, Kruse DE, Simon SI, Ferrara KW. Ultrasound radiation force enables targeted deposition of model drug carriers loaded on microbubbles. J Control Release. 2006 Mar;111(1–2):128–134. doi: 10.1016/j.jconrel.2005.11.006. [DOI] [PMC free article] [PubMed] [Google Scholar]
- 22.Zhao S, Borden M, Bloch SH, Kruse D, Ferrara KW, Dayton PA. Radiation-force assisted targeting facilitates ultrasonic molecular imaging. Mol Imaging. 2004 Jul;3(3):135–148. doi: 10.1162/1535350042380317. [DOI] [PMC free article] [PubMed] [Google Scholar]
- 23.Rychak JJ, Klibanov AL, Ley KF, Hossack JA. Enhanced targeting of ultrasound contrast agents using acoustic radiation force. Ultrasound Med Biol. 2007 Jul;33(7):1132–1139. doi: 10.1016/j.ultrasmedbio.2007.01.005. [DOI] [PubMed] [Google Scholar]
- 24.Kaya M, Gregory TSV, Dayton PA. Changes in lipid-encapsulated microbubble population during continuous infusion and methods to maintain consistency. Ultrasound Med Biol. 35(10):1748–1755. doi: 10.1016/j.ultrasmedbio.2009.04.023. [DOI] [PMC free article] [PubMed] [Google Scholar]
- 25.Potdevin TC, Fowlkes JB, Moskalik AP, Carson PL. Analysis of refill curve shape in ultrasound contrast agent studies. Med Phys. 2004 Mar;31(3):623–632. doi: 10.1118/1.1649534. [DOI] [PubMed] [Google Scholar]
- 26.Chomas JE, Dayton P, May D, Ferrara K. Threshold of fragmentation for ultrasonic contrast agents. J Biomed Opt. 2001 Apr;6(2):141–150. doi: 10.1117/1.1352752. [DOI] [PubMed] [Google Scholar]
Associated Data
This section collects any data citations, data availability statements, or supplementary materials included in this article.


