Abstract
Purpose: To investigate the feasibility of high temporal resolution breast DCE-MRI using compressed sensing theory.
Methods: Two experiments were designed to investigate the feasibility of using reference image based compressed sensing (RICS) technique in DCE-MRI of the breast. The first experiment examined the capability of RICS to faithfully reconstruct uptake curves using undersampled data sets extracted from fully sampled clinical breast DCE-MRI data. An average approach and an approach using motion estimation and motion compensation (ME∕MC) were implemented to obtain reference images and to evaluate their efficacy in reducing motion related effects. The second experiment, an in vitro phantom study, tested the feasibility of RICS for improving temporal resolution without degrading the spatial resolution.
Results: For the uptake-curve reconstruction experiment, there was a high correlation between uptake curves reconstructed from fully sampled data by Fourier transform and from undersampled data by RICS, indicating high similarity between them. The mean Pearson correlation coefficients for RICS with the ME∕MC approach and RICS with the average approach were 0.977±0.023 and 0.953±0.031, respectively. The comparisons of final reconstruction results between RICS with the average approach and RICS with the ME∕MC approach suggested that the latter was superior to the former in reducing motion related effects. For the in vitro experiment, compared to the fully sampled method, RICS improved the temporal resolution by an acceleration factor of 10 without degrading the spatial resolution.
Conclusions: The preliminary study demonstrates the feasibility of RICS for faithfully reconstructing uptake curves and improving temporal resolution of breast DCE-MRI without degrading the spatial resolution.
Keywords: compressed sensing theory, temporal resolution, reference image, RICS, breast DCE-MRI
INTRODUCTION
After attaining a size of a few mm3, virtually all solid tumors need new vessels to continue growth.1, 2, 3, 4, 5, 6 Unlike normal vessels, tumor vessels are characteristically leaky, fragile, and incompletely formed. Dynamic contrast-enhanced (DCE) MRI has been widely used to characterize tumor vasculature. In DCE-MRI, a series of MR images is acquired at regular intervals after intravenous administration of a contrast agent (CA). By analyzing the variation in the MR signal intensity over time, semiquantitative or quantitative parameters can be estimated using an appropriate model.7, 8, 9, 10, 11, 12, 13, 14, 15, 16, 17, 18, 19 Accurate reconstruction of uptake curves of DCE-MRI is crucially important in either semiquantitative or quantitative analysis.
Because of the dynamic nature of DCE-MRI, higher temporal resolution translates into more accurate data for kinetic analysis. On the other hand, the heterogeneous nature of tumors requires high spatial resolution for accurate characterization. In the setting of breast DCE-MRI, high spatial resolution is crucial for diagnosis of breast cancer.20 Because of their mutual importance, consistent efforts have been aimed at accomplishing both high temporal and spatial resolution DCE-MRI.21, 22, 23, 24, 25, 26, 27
A recently developed mathematical theory of signal processing and data acquisition, compressed sensing (CS) theory,28, 29, 30, 31 provides a novel way to accomplish this goal. The breakthrough in the CS theory is its ability to allow images to be faithfully recovered from what appear to be highly incomplete data sets, where one of the central tenets of signal processing and data acquisition, the Nyquist sampling theory, has been violated.32
Several applications of the CS theory to dynamic MRI have been successfully demonstrated such as k-t SPARSE and k-t FOCUS.32, 33, 34, 35, 36, 37, 38, 39, 40 But only a few studies focus on CS-based DCE-MRI,41, 42, 43 and none on the breast. Despite the progress that has been achieved, a number of practical issues have to be investigated before implementing CS-based DCE-MRI in a typical clinical setting, particularly for the breast. These include the feasibility of CS-based 3D (rather than 2D) DCE-MRI, the reliability of uptake curves reconstructed from the undersampled data with the CS theory, and the potential impact of subject motion. In light of these technical gaps, the purpose of this study is to investigate the feasibility of applying compressed sensing theory to breast DCE-MRI to improve the temporal resolution without degrading the spatial resolution, while faithfully reconstructing uptake curves and minimizing potential motion related artifacts.
THEORY
Compressed sensing based MRI
If an objective image exhibits transform sparsity, it can be reconstructed from incoherent undersampled k-space data by solving a constrained l1-norm minimization problem. CS theory can be interpreted by the following mathematical description:28, 44 If the underlying image f∊CN has a sparse representation in a transform domain and obeys the following equation:
| (1) |
where CN denotes N dimension complex space, S is the set of the nonzero representations in the sparse transform domain, |S| denotes the number of nonzero representations, CM>0 is a constant, M is a given accuracy parameter, U is the incoherent undersampled subset in the k-space, and |U| denotes the number of available undersampled data, then the image f can be faithfully reconstructed by solving an l1-norm minimization problem subject to certain constraints, i.e.,
| 2 |
where Ψ is the sparse transform operator, Fu is undersampled inverse Fourier transformation operator, gu is the available undersampled k-space data, ε controls the fidelity of the reconstruction, ‖ ‖1 and ‖ ‖2 denote the l1- and l2-norms, respectively. That is to say, images with transform sparsity can be faithfully reconstructed from incoherent undersampled data in the k-space, falling short of Nyquist criteria.
In practice, an applicable CS-based MRI has three requirements:44 (1) The underlying image should have a sparse transformation, (2) artifacts due to the reduced sampling scheme in the k-space should be incoherent, and (3) a nonlinear reconstruction algorithm should be implemented to enforce the sparsity of the image representation and the consistency of the reconstruction with the measured k-space data.
Reference image based compressed sensing (RICS) technique in DCE-MRI of the breast
Equation 1 indicates that if the number of nonzero representations in sparse transform domain |S| can be reduced, then the number of necessary k-space data for accurate reconstruction |U| can also be reduced. It is widely known that reductions in acquisition time can be used to improve temporal resolution. Studies have demonstrated that, in general, MR images have spatial transform sparsity.44, 45 Therefore, temporal resolution can be further improved using CS theory if the dynamic MR images also have sparsity in the time domain.
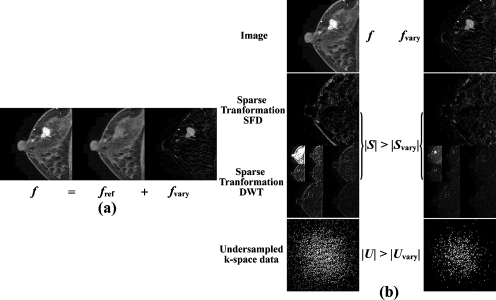
Considering the sparsity feature of breast DCE-MRI in which the administration of CA only induces rapid changes of signal intensities in those areas where CA passes through such as vessels or tumor lesions, we can make the following assumption: Only a small percentage of pixels experience rapid variation in signal intensities during the dynamic time course, while the intensities of most pixels change slowly. Therefore, at each time point (TP), the whole image f can be considered as the superposition of a “reference” image fref and “varying” image fvary, or f=fref+fvary, as given in the previous literature33, 42 and Fig. 1a.
Figure 1.
Sketch of the basic assumption and the derivation of RICS. (a) The whole image f can be considered as a superposition of the “reference” image fref and varying image fvary, or f=fref+fvary at every time point. (b) The first row displays a whole image f and the corresponding varying image fvary; the second and third rows display S and Svary in the sparse transform domain of the corresponding images f and fvary using SFD and DWT, respectively; the fourth row are k-space data U and Uvary for reconstructions of f and fvary, respectively. A typical clinical DCE-MR image was used here as the image f.
Let |S| and |Svary| denote the number of nonzero representations of f and fvary in sparse transform domain, respectively. |U| and |Uvary| denote the necessary number of undersampled k-space data for accurate reconstruction of f and fvary, respectively. According to the assumption, fvary has much less information than f. Thus, fvary is much sparser than f after a certain sparse transformation such as spatial finite difference (SFD) (Ref. 45) or discrete wavelet transformation (DWT), as shown in Fig. 1b, or |Svary|<|S|. By Eq. 1, we have |Uvary|<|U|. In other words, if the objective image f of the constrained l1-norm minimization problem described in Eq. 2 is replaced by fvary, much less k-space data are needed for a faithful reconstruction. The reduction in the k-space can then be used to improve temporal resolution without degrading the spatial resolution. After fvary is reconstructed, the whole image f can be simply obtained by the superposition of fvary and fref.
Sampling scheme of RICS
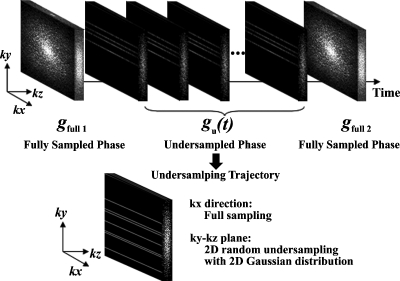
To implement RICS, a practical sampling scheme is needed. The sampling scheme of RICS consists of two phases: The fully sampled phase and the undersampled phase, as shown in Fig. 2. For the fully sampled phase, two fully sampled 3D k-space data sets gfull 1 and gfull 2 are acquired immediately before the injection of CA and after the DCE-MRI time course, respectively. gfull 1 and gfull 2 are later used to generate high spatial resolution reference images fref(t) using the average approach or the motion estimation and motion compensation (ME∕MC) approach, which will be described later. For the undersampled phase, 3D undersampled k-space data set at time point t, gu(t), is acquired with undersampling in both ky and kz phase encoding directions using a 2D Gaussian random distribution, while the read out direction kx is fully sampled during the dynamic period of DCE-MRI immediately after the injection of CA, as shown in Fig. 2.
Figure 2.
Illustration of the sampling scheme for RICS in this study. It consists of two phases: The fully sampled phase and the undersampled phase. For the fully sampled phase, two fully sampled 3D k-space data sets gfull 1 and gfull 2 are acquired immediately before the injection of CA and after the DCE-MRI time course, respectively. The undersampled data sets in the undersampled phase are acquired during the dynamic period of DCE-MRI time course. Undersampled k-space data sets gu(t) are undersampled in both ky and kz phase encoding directions using a 2D Gaussian random distribution, while the read out direction kx is fully sampled.
Data processing procedure of RICS
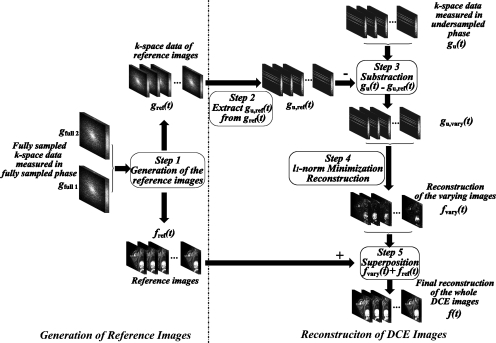
The data processing procedure of RICS corresponding to the aforementioned sampling scheme is shown in Fig. 3. It consists of two portions: The generation of reference images fref(t) and the reconstruction of DCE images f(t).
Figure 3.
The data processing procedure of RICS consists of two portions: The generation of reference images fref(t) and the reconstruction of DCE images f(t). For the first portion (step 1), the inputs are the fully sampled data sets acquired in the fully sampled phase, gfull 1 and gfull 2 and the outputs are the high resolution reference images fref(t) and the corresponding k-space data gref(t). For the second portion, first, gu,ref(t) are extracted from gref(t) using the same undersampling scheme for acquiring gu(t) (step 2). Next, for each time point, the k-space data set gu(t) acquired in the undersampled phase subtracts the corresponding gu,ref(t) to produce the undersampled k-space data gu,vary(t) (step 3). Then the constrained l1-norm minimization problem is solved to reconstruct fvary(t) (step4). Finally, fvary(t) are added to the reference images fref(t) to reconstruct DCE images f(t) (step 5).
Generation of reference images
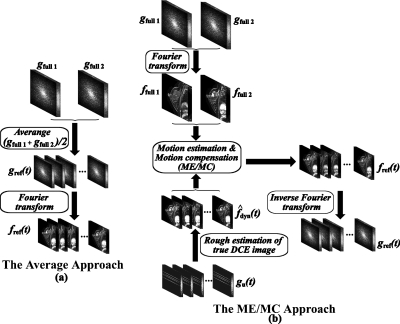
As shown in Fig. 3, the inputs of the reference image portion (step 1 in Fig. 3) are the fully sampled data sets acquired in the fully sampled phase, gfull 1 and gfull 2. The outputs are the high resolution reference images fref(t) and the corresponding k-space data gref(t). As stated previously, two approaches, the average one and the ME∕MC one, have been implemented in RICS to generate reference images, shown in Figs. 4a, 4b, respectively.
Figure 4.
The two approaches used to generate reference images: (a) The average approach and (b) the ME∕MC approach.
In the average approach, gref(t) are simply calculated as the average of gfull 1 and gfull 2, and reference images fref(t) are obtained by the Fourier transformation of gref(t). Notice that the reference images fref(t) are all the same at different time points t in the average approach.
In the ME∕MC approach, we implement the ME∕MC technique used in video coding46 and extended it to a 3D version. First, fully sampled images ffull 1 and ffull 2 are achieved directly from gfull 1 and gfull 2 by Fourier transformation. Second, rough estimation of true DCE images are obtained using CS reconstruction algorithm.37 Then ME (motion estimation) is performed to find the motion vectors from the fully sampled data ffull 1 and ffull 2 to the rough estimation using block matching algorithm.47 Next, reference images fref(t) are obtained using the interpolation MC (motion compensation), as detailed in the previous literature.37 Finally, k-space data gref(t) corresponding to fref(t) are achieved by inverse Fourier transformation.
Reconstruction of DCE images
The DCE image reconstruction portion of RICS corresponding to the aforementioned sampling scheme is shown in Fig. 3. After the generation of reference image using either the average approach or the ME∕MC approach (step 1 in Fig. 3), gu,ref(t) are extracted from gref(t) using the same undersampling scheme for acquiring gu(t) (step 2 in Fig. 3). Next, for each time point, the k-space data set gu(t) acquired in the undersampled phase subtracts the corresponding gu,ref(t) to produce the undersampled k-space data gu,vary(t), which only contains the information of varying images fvary(t) (step 3 in Fig. 3). Then the constrained l1-norm minimization problem [see Eq. 2] is solved to reconstruct fvary(t) (step 4 in Fig. 3). Finally, fvary(t) are added to reference images fref(t) to reconstruct DCE images f(t) (step 5 in Fig. 3).
METHODS AND MATERIAL
Two experiments were designed to investigate the feasibility of applying RICS to breast DCE-MRI. The goal of the first experiment, the breast DCE-MRI uptake-curve study, was to examine the feasibility of RICS to faithfully recover uptake curves using undersampled data sets extracted from fully sampled clinical breast DCE-MRI data. Written informed consents were obtained from all subjects (N=3) and approved by the Human Investigation Committee at the participating institution. The goal of the second experiment, the in vitro phantom study, was to test the feasibility of RICS to improve temporal resolution without degrading the spatial resolution.
Uptake curve reconstruction
This study was conducted in four steps. First, 3D breast DCE-MRI data of three individual subjects were acquired at a typical clinical setting. Second, 15% undersampled 3D data were extracted from the fully sampled 3D breast DCE-MRI data to simulate the RICS sampling scheme (a 2D Gaussian random undersampling in the ky and kz directions with full sampling in the kx direction). Third, the reconstructions of DCE images using RICS with the average approach and the ME∕MC approach were performed as described previously. Finally, statistical analysis was performed to evaluate the similarity between the “true” uptake curves and the corresponding ones reconstructed by RICS. In this study, uptake curves or images reconstructed from fully sampled data sets are considered to be true uptake curves or true images.
3D breast DCE-MRI data were acquired using T1-weighted 3D SPGR with fat suppression on a whole-body 1.5 T scanner (Signa Excite, GE Medical Systems, USA). The experimental parameters were TR∕TE=6.931∕2.72 ms, flip angle=15°, slice thickness=5 mm, and matrix size=512×512×21. One precontrast and seven postcontrast frames were obtained. Gd-DTPA (0.2 mmol∕kg; Magnevist, Bayer Schering Pharma AG, Berlin, Germany) contrast agent was injected into the antecubital vein with a flow rate of 2 ml∕s. Administration of contrast agent was followed by a 20 ml saline flush at a flow rate of 2 ml∕s.
Image reconstruction was performed, as outlined in Fig. 3. Final DCE images f(t) were reconstructed using RICS with the average and ME∕MC approaches, respectively. For RICS with the ME∕MC approach, the block size for block matching was 8×8×1 and the search range was 24×24×3. SFD was used as the spatial sparse transformation in l1-norm minimization.
A number of methods were used to evaluate the feasibility of applying RICS to breast DCE-MRI. First, reference images generated by the average and ME∕MC approaches were compared to evaluate the capability of the two approaches in predicting the true DCE images. Second, reconstruction results by RICS with the average and ME∕MC approaches at each time point were compared in terms of the mean square error (MSE) to examine the feasibility of faithfully reconstructing DCE images. MSE was calculated using the following equation:
| (3) |
where N denotes the total number of voxels of the DCE image, i denotes the index of the voxel of the image, t denotes the time point, and f(i,t) and ftrue(i,t) denote the value of ith voxel of the DCE image reconstructed by RICS and the corresponding true image, respectively. Third, Pearson correlation coefficients between the true uptake curves and the ones reconstructed by RICS were calculated to evaluate the similarity of the overall features as described in literature.48 Theoretically, the correlation coefficient can range from −1 to 1. The closer the correlation coefficient to 1, the higher the similarity between the two curves. Absolute differences between the true uptake curves and the ones reconstructed by RICS were also calculated and displayed. Finally, the computational complexity of RICS was examined to evaluate its efficiency. The average computation time for reconstructing a single frame was compared between RICS with the average and ME∕MC approaches. All reconstructions were performed on a personal computer with an Intel Core2 2.13 GHz central processing unit and 3 GB memory on Windows XP platform. The data were processed by a software developed in-house with MATLAB 7.6 (MathWorks, Natick, MA).
In vitro study
A DCE-MRI phantom, which consists of an internal structure (a series of holes with different diameters) and a plastic pipe winding around the phantom, was used to test the feasibility of RICS for improving temporal resolution without degrading the spatial resolution. MnCl2 solution (178 mg∕l), which was used as contrast agent, and pure H2O were alternately injected into the pipe during the experiment. When the injection of one of the two liquids was turned on, the other one was turned off simultaneously. The cycle rate was de-fined as the frequency at which MnCl2 and pure H2O were alternately injected. For example, if the MnCl2 solution injection is turned on for 16 s and then switched to pure water injection for the next 16 s, the cycle rate was defined as 1∕16 s−1. To compare temporal resolution performance with and without RICS, three different cycle rates (1∕16, 1∕8, and 1∕3 s−1) were implemented for three experiments, respectively.
All undersampled 3D k-space data were acquired on a 1.5 T MRI scanner (MAGNETOM ESSANZA Siemens, Erlangen, Germany) with a 3D FLASH sequence using the sampling scheme of RICS, as discussed previously. The other experimental parameters were TR∕TE=3.2 ms∕1.7 ms, flip angle=15°, slice thickness=5 mm, matrix size=128×128×32, and the time course was 131 s. Corresponding fully sampled 3D data were also acquired with the same 3D FLASH sequence but using the conventional fully sampled scheme for comparison purposes.
For each cycle rate, three sets of data were acquired: One set of fully sampled data and two sets of undersampled data with acceleration factors of 3.3 and 10 (30% and 10% of fully sampled data), respectively. For the fully sampled data set, direct 3D Fourier transformation was implemented to reconstruct images. For the undersampled data sets (30% and 10% of fully sampled data), RICS using SFD as the sparse transformation in 3D spatial domain was used. Note that only RICS with the average approach was performed since there is no motion effect in the in vitro study.
RESULTS
Uptake curve reconstruction
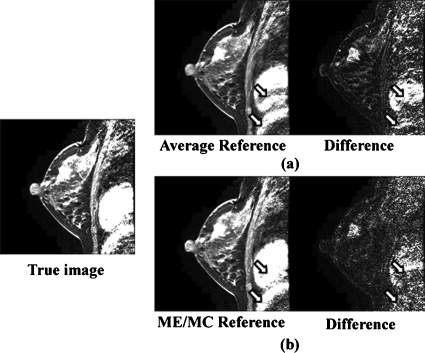
Figure 5 shows the reference images generated by the average and ME∕MC approaches as well as the respective absolute difference images to the true DCE image. As illustrated in Fig. 5, ME∕MC approach outperforms the average approach in terms of predicting the true DCE image, especially for the areas with a relatively severe subject motion. For example, the residual in the absolute difference image between the true DCE image and ME∕MC reference image is smaller than that in the absolute difference image between the true DCE image and the average reference image, especially for the chest area [pointed by the arrows in Figs. 5a, 5b].
Figure 5.
A comparison of reference images generated by the average and ME∕MC approaches. The image on the left side is a representative slice of the true DCE image: (a) The reference image generated by the average approach and its absolute difference image to the true DCE image. (b) The reference image generated by the ME∕MC approach and its absolute difference image to the true DCE image.
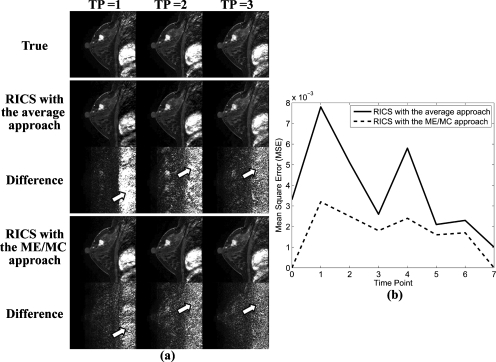
Figure 6a shows the comparison of reconstruction results by RICS with the average and ME∕MC approaches. The first, second, and third columns of Fig. 6a display images at three successive TPs. As demonstrated by comparing difference images in Fig. 6a, both methods did a good job, although images reconstructed by RICS with the ME∕MC approach were closer to the true corresponding DCE images, especially in areas of severe subject motion such as the chest part, as pointed out by the arrows.
Figure 6.
(a) A comparison of the reconstruction results of RICS with the average approach and the ME∕MC approach. The first, second, and third columns of (a) display images at three successive TPs. The first row shows the true DCE images. The second and third rows show the reconstruction results of RICS with the average approach and their corresponding absolute difference images to the true DCE images, respectively. The fourth and fifth rows show the reconstruction results of RICS with the ME∕MC approach and their corresponding absolute difference images to the true DCE images, respectively. (b) A comparison of MSE of the reconstruction results of RICS with the average (solid line) and ME∕MC (dashed line) approaches at each time point.
Figure 6b compares the MSE for images reconstructed by RICS with the average and ME∕MC approaches at each time point. The average MSE of all time points for RICS with the average and ME∕MC approaches were 0.0037 and 0.0017, respectively. The result again indicates that RICS with the ME∕MC approach offers a more reliable reconstruction result than that by RICS with the average approach.
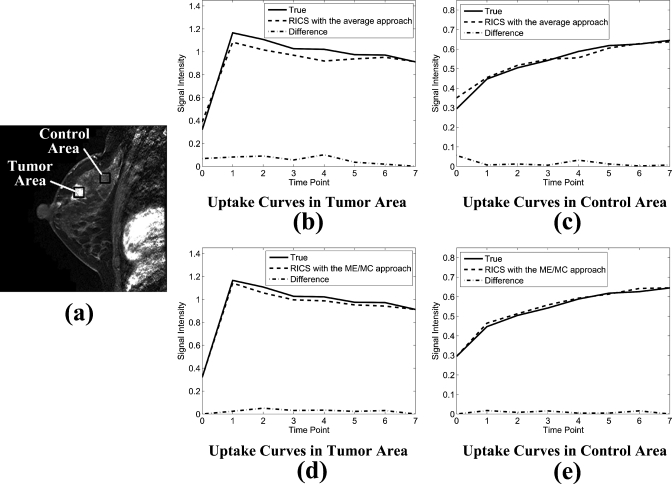
Figures 7b, 7c show typical true uptake curves (solid line), uptake curves reconstructed by RICS with the average approach (dashed line), and the absolute difference between them (dotted-dashed line) from a tumor area and a control area [indicated by the black squares in Fig. 7a], respectively. Figures 7d, 7e show typical true uptake curves (solid line), uptake curves reconstructed by RICS with the ME∕MC approach (dashed line), and absolute difference between them (dotted-dashed line) from the same tumor area and control area, respectively. Clearly, the results indicate that uptake curves reconstructed by RICS with the ME∕MC approach are closer to the true uptake curves compared to uptake curves reconstructed by RICS with the average approach.
Figure 7.
Uptake curves reconstructed by RICS with the average and ME∕MC approaches. (a) A representative image showing the tumor and control area (indicated by the black squares) from which uptake curves were calculated. Each of these two areas contained 900 pixels. [(b) and (c)] The true uptake curves (solid line), uptake curves reconstructed by RICS with the average approach (dashed line), and the absolute difference between them (dotted-dashed line) from the tumor and control area, respectively. [(d) and (e)] The true uptake curves (solid line), uptake curves reconstructed by RICS with the ME∕MC approach (dashed line), and absolute difference between them (dotted-dashed line) from the tumor and control area, respectively.
Table 1 lists the mean Pearson correlation coefficients between the true uptake curves and the ones reconstructed by RICS with the two reference image approaches. The mean Pearson correlation coefficients for RICS with the ME∕MC approach and RICS with the average approach were 0.977±0.023 and 0.953±0.031, respectively. The statistical results demonstrated high correlation between the true uptake curves and the ones reconstructed by RICS with either of the two reference approaches, indicating high similarity between the RICS uptake curves and the true uptake curves.
Table 1.
Comparison of the mean Pearson correlation coefficient between the true uptake curves and the uptake curves reconstructed by RICS. (A tumor area and a control area indicated by the black squares in Fig. 7a were selected for statistic analysis. Each of these two areas contained 900 pixels.)
| Method | Tumor area (Ra ±SDb) | Control area (R±SD) | Total area (R±SD) |
|---|---|---|---|
| RICS with the average approach | 0.976±0.008 | 0.931±0.029 | 0.954±0.031 |
| RICS with the ME∕MC approach | 0.991±0.007 | 0.963±0.026 | 0.977±0.023 |
R denotes the mean Pearson correlation coefficient.
SD denotes the standard deviation.
Finally, to evaluate computational complexity, the computation time for reconstructing DCE images was recorded at each time point. It took an average of 5 min for RICS with the average approach and 32 min for RICS with the ME∕MC approach, respectively.
In vitro study
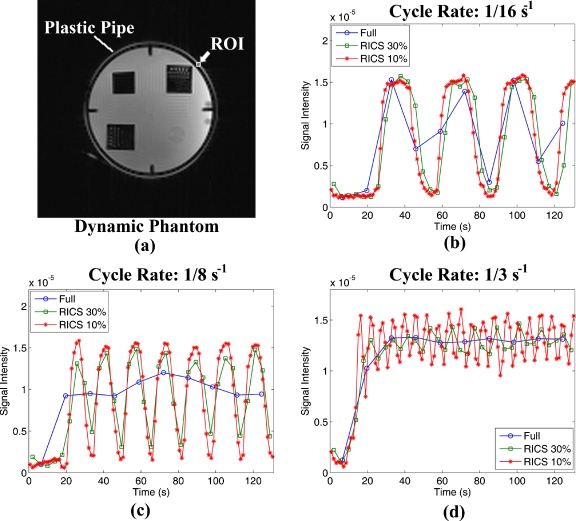
Figure 8a is an axial image of our in vitro phantom. Figures 8b, 8c, 8d show the comparison of uptake curves from the ROI [indicated by the white arrow in Fig. 8a] reconstructed from fully sampled (line with circle), 30% sampled RICS (line with square), and 10% sampled RICS (line with star) data at three different cycle rates of 1∕16, 1∕8, and 1∕3 s−1, respectively. There were 33 and 100 frames for the 30% and 10% sampled RICS series, respectively, while there were only 10 frames for the fully sampled data for the given period. As expected, the lower the percentage of undersampled data, the higher the temporal resolution, and the better the uptake curve for fast dynamic characterization. For example, at a cycle rate of 1∕16 s−1, although all of the three strategies could identify the trend of variation, in general, the fully sampled curve missed some of the turning points [Fig. 8b]. At a cycle rate of 1∕8 s−1, the fully sampled data failed to temporally resolve the signal alternation due to the alternating flow of contrast agent [Fig. 8c]. At a cycle rate of 1∕3 s−1, only the 10% sampled RICS was able to resolve the signal variation [Fig. 8d].
Figure 8.
Illustration of improvement in temporal resolution by RICS. (a) Image of the in vitro phantom used in the study. [(b), (c), and (d)] The dynamic curves of the ROI (indicated by the arrow in (a)) reconstructed from fully sampled (line with circle), 30% sampled RICS (line with square), and 10% sampled RICS (line with star) data at cycle rates of 1∕16, 1∕8, and 1∕3 s−1, respectively.
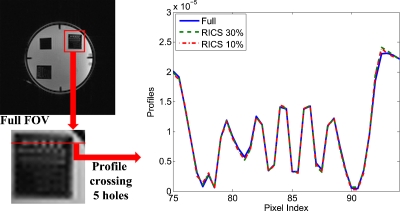
Figure 9 shows the comparison of image profiles crossing the five tiny holes in the phantom. All three profiles were virtually the same, indicating no visible degradation in the spatial resolution using RICS compared to the conventional method with fully sampled data. The results illustrated in Figs. 89 demonstrate that RICS can improve temporal resolution without degrading the spatial resolution.
Figure 9.
Comparison of image profiles crossing the five tiny holes in the phantom from the fully sampled data (solid line), 30% sampled RICS data (dashed line), and 10% sampled RICS data (dotted-dashed line).
DISCUSSION AND CONCLUSION
The preliminary results demonstrate the feasibility of applying CS theory to improve the temporal resolution of breast DCE-MRI. The uptake-curve reconstruction study has shown that uptake curves for a typical breast DCE-MRI can be faithfully reconstructed with as little as 15% of the fully sampled data using the RICS technique. The similarity between the true uptake curves and the ones reconstructed by RICS was high. This high level of similarity suggests that RICS can estimate semiquantitative or quantitative DCE-MRI parameters with the same accuracy as the fully sampled approach. Although both reference image approaches can offer reliable reconstruction of uptake curves, RICS with the ME∕MC approach outperforms RICS with the average approach in every category except computation time. This is particularly true for areas with severe motion. The in vitro phantom study further demonstrates that CS-based technique can improve temporal resolution by a factor of 10 without degrading the spatial resolution compared to the fully sampled scheme.
The idea of reference image based compressed sensing MRI has been proposed previously for cardiac dynamic MRI33 and DCE-MRI.42 The main differences between our study and previous CS-based DCE-MRI studies include (1) 3D imaging, which is common for breast DCE-MRI, rather than 2D imaging; (2) a 2D Gaussian random undersampling scheme, which induces less coherent artifacts, instead of a 1D random sampling scheme; (3) the development of an actual undersampling pulse sequence in the in vitro study rather than only using the undersampled data extracted from fully sampled data sets; (4) the examination of faithful reconstruction of uptake curves rather than images at one time point; and (5) the implementation of 3D ME∕MC approach to reduce the potential impact of subject motion. Although breast DCE-MRI is emphasized in this study, RICS could be extended to other applications with moderate modification, such as fMRI where induced changes in MRI signal intensity only occurs in a small percentage of the brain.
CS-based MRI is still a relatively new area with many unexplored avenues and great potential. Despite our promising results, RICS is far from perfect. There are many aspects of RICS that need further investigation. For example, alternative spatial and∕or temporal sparse transformation could be implemented to further increase the sparsity of the objective image. SFD was implemented as sparse transformation in the study for its computation efficiency. However, other spatial sparse transformations may work as well or even better including discrete cosine transform and DWT.44, 45 In the time domain, additional sparse transformation could also be performed to further exploit its temporal sparsity, such as Karhunen–Loeve transformation for nonperiodic motion.37 Another potential way to further improve temporal resolution is to combine RICS with multichannel parallel imaging techniques such as SENSE.38, 49, 50, 51 In conclusion, our preliminary results demonstrate the feasibility of RICS for faithfully reconstructing uptake curves for breast DCE-MRI and improving temporal resolution without degrading the spatial resolution.
ACKNOWLEDGMENTS
The authors would like to thank Dr. Stuart Smith for his comments and for proofreading of the paper. This work was supported in part by the Susan G. Komen Breast Cancer Foundation (Grant No. IMG0402881), NIH (R21 CA118569-01A1), the National Basic Research Program of China (973 Program, Grant No. 2006CB705705) from the Ministry of Science and Technology of China, and the Joint Research Foundation of Beijing Education Committee (Grant No. JD100010607).
References
- Folkman J., “Angiogenesis in cancer, vascular, rheumatoid and other disease,” Nat. Med. 1(1), 27–30 (1995). 10.1038/nm0195-27 [DOI] [PubMed] [Google Scholar]
- Folkman J., “Role of angiogenesis in tumor growth and metastasis,” Semin. Oncol. 29(6), 15–18 (2002). 10.1016/S0093-7754(02)70065-1 [DOI] [PubMed] [Google Scholar]
- Carmeliet P. and Jain R. K., “Angiogenesis in cancer and other diseases,” Nature (London) 407, 249–257 (2000). 10.1038/35025220 [DOI] [PubMed] [Google Scholar]
- Atri M., “New technologies and directed agents for applications of cancer imaging,” J. Clin. Oncol. 24(20), 3299–3308 (2006). 10.1200/JCO.2006.06.6159 [DOI] [PubMed] [Google Scholar]
- Yankeelov T. E. and Gore J. C., “Dynamic contrast enhanced magnetic resonance imaging in oncology: Theory, data acquisition, analysis, and examples,” Curr. Med. Imaging Rev. 3(2), 91–107 (2007). 10.2174/157340507780619179 [DOI] [PMC free article] [PubMed] [Google Scholar]
- Ribatti D., Vacca A., and Presta M., “The discovery of angiogenic factors: A historical review,” Gen. Pharmacol. 35(5), 227–231 (2000). [DOI] [PubMed] [Google Scholar]
- Barrett T., Brechbiel M., Bernardo M., and Choyke P. L., “MRI of tumor angiogenesis,” J. Magn. Reson Imaging 26(2), 235–249 (2007). 10.1002/jmri.20991 [DOI] [PubMed] [Google Scholar]
- Berkowitz B. A., Roberts R., Luan H. M., Peysakhov J., Mao X. Z., and Thomas K. A., “Dynamic contrast-enhanced MRI measurements of passive permeability through blood retinal barrier in diabetic rats,” Invest. Ophthalmol. Visual Sci. 45(7), 2391–2398 (2004). 10.1167/iovs.03-1381 [DOI] [PubMed] [Google Scholar]
- Covarrubias D. J., Rosen B. R., and Lev M. H., “Dynamic magnetic resonance perfusion imaging of brain tumors,” Oncologist 9(5), 528–537 (2004). 10.1634/theoncologist.9-5-528 [DOI] [PubMed] [Google Scholar]
- Dale B. M., Jesberger J. A., Lewin J. S., Hillenbrand C. M., and Duerk J. L., “Determining and optimizing the precision of quantitative measurements of perfusion from dynamic contrast enhanced MRI,” J. Magn. Reson Imaging 18(5), 575–584 (2003). 10.1002/jmri.10399 [DOI] [PubMed] [Google Scholar]
- Horsfield M. A. and Morgan B., “Algorithms for calculation of kinetic parameters from T1-weighted dynamic contrast-enhanced magnetic resonance imaging,” J. Magn. Reson Imaging 20(4), 723–729 (2004). 10.1002/jmri.20161 [DOI] [PubMed] [Google Scholar]
- Kuhl C. K., Bieling H., Gieseke J., Ebel T., Mielcarek P., Far F., Folkers P., Elevelt A., and Schild H. H., “Breast neoplasms: T2* susceptibility-contrast, first-pass perfusion MR imaging,” Radiology 202(1), 87–95 (1997). [DOI] [PubMed] [Google Scholar]
- Larsson H. B. W., Stubgaard M., Frederiksen J. L., Jensen M., Henriksen O., and Paulson O. B., “Quantitation of blood-brain-barrier defect by magnetic-resonance-imaging and gadolinium-DTPA in patients with multiple-sclerosis and brain-tumors,” Magn. Reson. Med. 16(1), 117–131 (1990). 10.1002/mrm.1910160111 [DOI] [PubMed] [Google Scholar]
- Padhani A. R., “Dynamic contrast-enhanced MRI in clinical oncology: Current status and future directions,” J. Magn. Reson Imaging 16(4), 407–422 (2002). 10.1002/jmri.10176 [DOI] [PubMed] [Google Scholar]
- Rosen B. R., Belliveau J. W., Vevea J. M., and Brady T. J., “Perfusion imaging with NMR contrast agents,” Magn. Reson. Med. 14(2), 249–265 (1990). 10.1002/mrm.1910140211 [DOI] [PubMed] [Google Scholar]
- Rosen M. A. and Schnall M. D., “Dynamic contrast-enhanced magnetic resonance imaging for assessing tumor vascularity and vascular effects of targeted therapies in renal cell carcinoma,” Clin. Cancer Res. 13(2), 770s–776s (2007). 10.1158/1078-0432.CCR-06-1921 [DOI] [PubMed] [Google Scholar]
- Sourbron S., “Technical aspects of MR perfusion,” Eur. J. Radiol. (in press). [DOI] [PubMed]
- Tofts P. S. and Kermode A. G., “Measurement of the blood-brain-barrier permeability and leakage space using dynamic MR imaging. 1. Fundamental-concepts,” Magn. Reson. Med. 17(2), 357–367 (1991). 10.1002/mrm.1910170208 [DOI] [PubMed] [Google Scholar]
- Yankeelov T. E., Luci J. J., Lepage M., Li R., Debusk L., Lin P. C., Price R. R., and Gore J. C., “Quantitative pharmacokinetic analysis of DCE-MRI data without an arterial input function: A reference region model,” Magn. Reson. Imaging 23(4), 519–529 (2005). 10.1016/j.mri.2005.02.013 [DOI] [PubMed] [Google Scholar]
- Kuhl C. K., Schild H. H., and Morakkabati N., “Dynamic bilateral contrast-enhanced MR imaging of the breast: Trade-off between spatial and temporal resolution,” Radiology 236, 789–800 (2005). 10.1148/radiol.2363040811 [DOI] [PubMed] [Google Scholar]
- Adluru G., Awate S. P., Tasdizen T., Whitaker R. T., and DiBella E. V. R., “Temporally constrained reconstruction of dynamic cardiac perfusion MRI,” Magn. Reson. Med. 57(6), 1027–1036 (2007). 10.1002/mrm.21248 [DOI] [PubMed] [Google Scholar]
- Chan R. W., Ramsay E. A., Cunningham C. H., and Plewes D. B., “Temporal stability of adaptive 3D radial MRI using multidimensional golden means,” Magn. Reson. Med. 61(2), 354–363 (2009). 10.1002/mrm.21837 [DOI] [PubMed] [Google Scholar]
- Dougherty L., Isaac G., Rosen M. A., Nunes L. W., Moate P. J., Boston R. C., Schnall M. D., and Song H. K., “High frame-rate simultaneous bilateral breast DCE-MRI,” Magn. Reson. Med. 57(1), 220–225 (2007). 10.1002/mrm.21114 [DOI] [PubMed] [Google Scholar]
- Han M., Daniel B. L., and Hargreaves B. A., “Accelerated bilateral dynamic contrast-enhanced 3D spiral breast MRI using TSENSE,” J. Magn. Reson Imaging 28(6), 1425–1434 (2008). 10.1002/jmri.21427 [DOI] [PubMed] [Google Scholar]
- Martel A. L., Chan R. W., Ramsay E., and Plewesl D. B., “Removing undersampling artifacts in DCE-MRI studies using independent components analysis,” Magn. Reson. Med. 59(4), 874–884 (2008). 10.1002/mrm.21552 [DOI] [PubMed] [Google Scholar]
- O’Halloran R. L., Wen Z. F., Holmes J. H., and Fain S. B., “Iterative projection reconstruction of time-resolved images using highly-constrained back-projection (HYPR),” Magn. Reson. Med. 59(1), 132–139 (2008). 10.1002/mrm.21439 [DOI] [PubMed] [Google Scholar]
- Friedman P. D., Swaminathan S. V., and Smith R., “SENSE imaging of the breast,” AJR, Am. J. Roentgenol. 184(2), 448–451 (2005). [DOI] [PubMed] [Google Scholar]
- Candes E. J., Romberg J., and Tao T., “Robust uncertainty principles: Exact signal reconstruction from highly incomplete frequency information,” IEEE Trans. Inf. Theory 52(2), 489–509 (2006). 10.1109/TIT.2005.862083 [DOI] [Google Scholar]
- Candès E. J., Romberg J. K., and Tao T., “Stable signal recovery from incomplete and inaccurate measurements,” Commun. Pure Appl. Math. 59(8), 1207–1223 (2006). 10.1002/cpa.20124 [DOI] [Google Scholar]
- Candes E. J. and Tao T., “Near-optimal signal recovery from random projections: Universal encoding strategies,” IEEE Trans. Inf. Theory 52(12), 5406–5425 (2006). 10.1109/TIT.2006.885507 [DOI] [Google Scholar]
- Donoho D. L., “Compressed sensing,” IEEE Trans. Inf. Theory 52(4), 1289–1306 (2006). 10.1109/TIT.2006.871582 [DOI] [Google Scholar]
- Mistretta C. A., “Undersampled radial MR acquisition and highly constrained back projection (HYPR) reconstruction: Potential medical imaging applications in the post-Nyquist era,” J. Magn. Reson Imaging 29(3), 501–516 (2009). 10.1002/jmri.21683 [DOI] [PubMed] [Google Scholar]
- Fischer A., Breuer F., Blaimer M., Seiberlich N., and Jakob P. M., “Accelerated dynamic imaging by reconstructing sparse differences using compressed sensing,” presented at the ISMRM 16th Scientific Meeting and Exhibition, Toronto, Ontario, Canada, 3–9 May 2008. (unpublished).
- Gamper U., Boesiger P., and Kozerke S., “Compressed sensing in dynamic MRI,” Magn. Reson. Med. 59(2), 365–373 (2008). 10.1002/mrm.21477 [DOI] [PubMed] [Google Scholar]
- Hu S., Lustig M., Chen A. P., Crane J., Kerr A., Kelley D. A., Hurd R., Kurhanewicz J., Nelson S. J., Pauly J. M., and Vigneron D. B., “Compressed sensing for resolution enhancement of hyperpolarized 13C flyback 3D-MRSI,” J. Magn. Reson. 192(2), 258–264 (2008). 10.1016/j.jmr.2008.03.003 [DOI] [PMC free article] [PubMed] [Google Scholar]
- Jung H., Park J., Yoo J., and Ye J. C., “Radial k-t FOCUSS for high-resolution cardiac cine MRI,” Magn. Reson. Med. 63(1), 68–78 (2010). [DOI] [PubMed] [Google Scholar]
- Jung H., Sung K., Nayak K. S., Kim E. Y., and Ye J. C., “k-t FOCUSS: A general compressed sensing framework for high resolution dynamic MRI,” Magn. Reson. Med. 61(1), 103–116 (2009). 10.1002/mrm.21757 [DOI] [PubMed] [Google Scholar]
- Jung H., Ye J. C., and Kim E. Y., “Improved k-t BLAST and k-t SENSE using FOCUSS,” Phys. Med. Biol. 52(11), 3201–3226 (2007). 10.1088/0031-9155/52/11/018 [DOI] [PubMed] [Google Scholar]
- Lustig M., Santos J. M., Donoho D., and Pauly J. M., “k-t SPARSE: High frame rate dynamic MRI exploiting spatio-temporal sparsity,” presented at the ISMRM 14th Scientific Meeting and Exhibition, Seattle, WA, 2006. (unpublished).
- Parasoglou P., Malioutov D., Sederman A. J., Rasburn J., Powell H., Gladden L. F., Blake A., and Johns M. L., “Quantitative single point imaging with compressed sensing,” J. Magn. Reson. 201(1), 72–80 (2009). 10.1016/j.jmr.2009.08.003 [DOI] [PubMed] [Google Scholar]
- Bilgin A., Trouard T. P., and Altbach M. I., “Three-dimensional compressed sensing for dynamic MRI,” presented at the ISMRM 16th Scientific Meeting and Exhibition, Toronto, Ontario, Canada, 3–9 May 2008. (unpublished).
- Ji J. and Lang T., “Dynamic MRI with compressed sensing imaging using temporal correlations,” presented at the Fifth IEEE International Symposium on Biomedical Imaging: From Nano to Macro, Paris, France, 14–17 May 2008. (unpublished).
- Wang H., Zhou K., He Q., Weng D., Hu J., and Bao S., “preliminary study of compressed sensing based DCE-MRI,” Yangtze River 2009 International Congress on Medical Imaging Physics, Nanjing, China, 23–25 October 2009. (unpublished).
- Lustig M., Donoho D. L., Santos J. M., and Pauly J. M., “Compressed sensing MRI,” IEEE Signal Process. Mag. 25(2), 72–82 (2008). 10.1109/MSP.2007.914728 [DOI] [Google Scholar]
- Lustig M., Donoho D., and Pauly J. M., “Sparse MRI: The application of compressed sensing for rapid MR imaging,” Magn. Reson. Med. 58(6), 1182–1195 (2007). 10.1002/mrm.21391 [DOI] [PubMed] [Google Scholar]
- Le Gall D., “MPEG: A video compression standard for multimedia applications,” Commun. ACM 34(4), 46–58 (1991). 10.1145/103085.103090 [DOI] [Google Scholar]
- Jain J. R. and Jain A. K., “Displacement measurement and its application in interframe image-coding,” IEEE Trans. Commun. 29(12), 1799–1808 (1981). 10.1109/TCOM.1981.1094950 [DOI] [Google Scholar]
- Shin T., Pohost G. M., and Nayak K. S., “Systolic 3D first-pass myocardial perfusion MRI: Comparison with diastolic imaging in healthy subjects,” Magn. Reson. Med. 63(4), 858–864 (2010). 10.1002/mrm.22315 [DOI] [PubMed] [Google Scholar]
- Ji J. X., Zhao C., and Lang T., “Compressed sensing parallel magnetic resonance imaging,” Conference Proceedings: IEEE Engineering in Medicine and Biology Society Vol. 2008, pp. 1671–1674, 2008. (unpublished). [DOI] [PubMed]
- Liang D., Liu B., Wang J., and Ying L., “Accelerating SENSE using compressed sensing,” Magn. Reson. Med. 62(6), 1574–1584 (2009). 10.1002/mrm.22161 [DOI] [PubMed] [Google Scholar]
- Liang D., Liu B., and Ying L., “Accelerating sensitivity encoding using compressed sensing,” Conference Proceedings: IEEE Engineering in Medicine and Biology Society Vol. 2008, pp. 1667–1670, 2008. (unpublished). [DOI] [PubMed]


