Abstract
Purpose: In previous work, the authors developed and demonstrated the concept of an image reconstruction procedure aimed to unify gated and dynamic nuclear cardiac imaging, which the authors have termed five-dimensional (5D) SPECT. Gated imaging permits the clinician to evaluate wall motion and, through the use of stress and rest scans, allows perfusion defects to be observed. Dynamic imaging depicts kinetics in the myocardium, which can be used to evaluate perfusion, but traditional dynamic images are motionless and do not depict wall motion. In this article, the authors investigate the degree to which perfusion defects can be detected from the dynamic information conveyed by 5D images, a problem that is particularly challenging in the absence of multiple fast camera rotations.
Methods: The authors first demonstrate the usefulness of dynamic reconstructed images for perfusion detection by using linear discriminant analyses (Fisher linear discriminant analysis and principal component analysis) and a numerical channelized Hotelling observer. The authors then derive three types of discriminant metrics for characterizing the temporal kinetic information in reconstructed dynamic images for differentiating perfusion defects from normal cardiac perfusion, which are the Fisher linear discriminant map, temporal derivative map, and kinetic parametric images.
Results: Results are based on the NURBS-based cardiac-torso phantom with simulation of Tc99m-teboroxime as the imaging agent. The derived metric maps and quantitative contrast-to-noise ratio results demonstrate that the reconstructed dynamic images could yield higher detectability of the perfusion defect than conventional gated reconstruction while providing wall motion information simultaneously.
Conclusions: The proposed metrics can be used to produce new types of visualizations, showing wall motion and perfusion information, that may potentially be useful for clinical evaluation. Since 5D imaging permits wall motion and kinetics to be observed simultaneously, it may ultimately obviate the need for separate stress and rest scans.
Keywords: gated SPECT, dynamic SPECT, 4D reconstruction, 5D reconstruction, spatio-temporal reconstruction
INTRODUCTION
In nuclear cardiology, myocardial perfusion imaging has become an important means for assessing regional coronary blood flow. Gated single-photon emission computed tomography (SPECT) offers an important additional benefit by permitting the evaluation of left ventricular function through quantitative assessment of wall motion.1 Traditionally, in a gated study, the distribution of the tracer is assumed constant over the course of imaging and one image is reconstructed for each gated frame. In dynamic imaging2 the emphasis is instead on the kinetics of the tracer, which are known to convey valuable physiological information.
We have been studying the possibility of unifying gated and dynamic imaging so that both myocardial motion and tracer kinetics can be simultaneously assessed.3, 4 We have termed this approach five-dimensional (5D) SPECT because the images are described by three spatial dimensions and two time dimensions (one reflecting the short time scale of a single cardiac cycle and one describing the longer time scale of the entire imaging session).
A potential benefit of unifying gated and dynamic imaging is that it may ultimately obviate the need for the traditional stress-rest paradigm, in which separate studies during stress and rest conditions are evaluated. If successful, a unified gated and dynamic imaging framework would enable reconstruction of the perfusion images throughout the entire imaging period in one single procedure. The perfusion images obtained at the late stage of the imaging period may play the role of a traditional rest study, thereby forgoing the need for a separate rest imaging study. A hybrid gated-dynamic (5D) scan yields both wall motion information and kinetics, which we hypothesize may contain equivalent or even superior information to the conventional stress and rest images. The purpose of this paper is to begin exploring this possibility, paving the way for future testing of this hypothesis. Alternatively, when separate injections of radiopharmaceutical are employed for stress and rest imaging, then 5D imaging coupled with kinetic analysis could be employed to estimate coronary flow reserve,5 which could be very important for studying minimal disease and the extent of disease.
Merging gated and dynamic imaging is a challenging task because it subdivides the data more finely than either gated or dynamic imaging alone; therefore, the problem of photon noise is greatly exacerbated. The problem is further complicated in the absence of fast camera rotation,3 where rapid tracer kinetics can lead to great inconsistencies in the tomographic data.
Fortunately, 5D image reconstruction can be achieved successfully if care is taken in tailoring the regularization to the specific characteristics of the various spatial and temporal dimensions, building on prior successes in so-called 4D reconstruction, where spatiotemporal processing has been applied to gated images (e.g., Refs. 6, 7, 8, 9) or dynamic images (e.g., Refs. 10, 11, 12, 13, 14, 15).
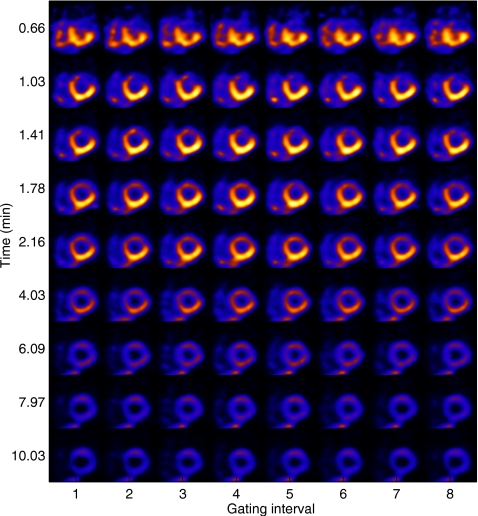
In Refs. 3, 16, 17, a 5D reconstruction procedure was developed to achieve unified gated-dynamic imaging. In this initial 5D reconstruction procedure, a dynamic image sequence was reconstructed independently for each gated image frame, followed by Wiener filtering across the gated frames for noise reduction. Subsequently, in Refs. 4, 18, we proposed a joint reconstruction approach wherein the dynamic sequences associated with the gated frames are treated collectively as a single 5D signal and determined from the available data by using maximum a posteriori (MAP) estimation. To illustrate the concept of 5D imaging, Fig. 1 shows an example of short-axis slices from a 5D reconstruction of cardiac perfusion within the walls of the heart with a defect, in which the horizontal axis shows different stages of the cardiac cycle and the vertical axis illustrates tissue kinetics during the time course of imaging.
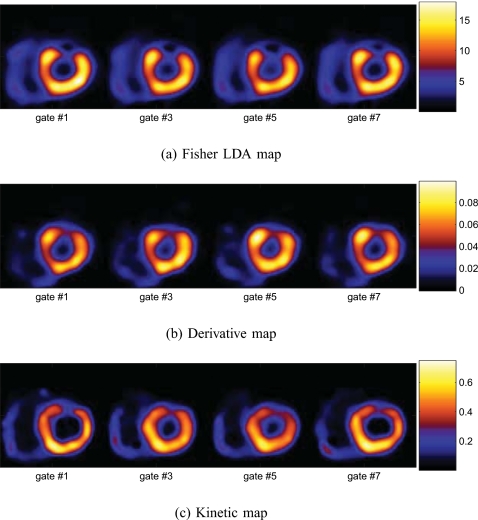
Figure 1.
Illustration of 5D imaging for a study with perfusion defect within the heart wall. Shown are short-axis slices at the same location as a function of gate interval within the cardiac cycle (horizontally) and time postinjection of imaging (vertically).
The primary focus in our previous work in 5D imaging3, 4, 16, 17, 18 has been on the development of reconstruction algorithms for unifying gated and dynamic cardiac imaging. Building on this prior success, in this work we aim to assess whether perfusion defects can be detected in 5D images. We also explore efficient ways for characterization and visualization of information pertinent to perfusion defects in a 5D image sequence, the ultimate goal being to produce a protocol that can be effective for clinical use.
We first apply statistical clustering analyses on the time-activity curves (TACs) of the dynamic images and demonstrate that the resulting TACs from 5D reconstruction can indeed differentiate between normal tissue and perfusion defects. Based on this, we next explore three quantitative measures derived from the TACs of the dynamic images to differentiate defects from normal myocardial perfusion. The first such measure is a direct result of the linear clustering analyses of the TACs (Fisher linear discriminant). We then consider two nonlinear measures derived from the TACs: One is based on the rate of temporal change in tracer distribution and the other is based on kinetic model parameters of the TACs. The aim is to create parametric images that can serve as an effective means for the visualization of physiological function and pharmacological kinetics, so that a single study can reveal both cardiac perfusion and wall motion, which is currently done by using two separate gated SPECT studies (stress and rest).
In our experiments, we simulated gated cardiac SPECT imaging with the NURBS-based cardiac-torso (NCAT) phantom and Tc99m-teboroxime as the imaging agent, where acquisition with the equivalent of only three full camera rotations was used during the course of a 12 min postinjection period for a three-headed camera. In this study, the projection data are available for only one set of angular positions of the rotating camera at any particular time instance and, consequently, are severely underdetermined (by a factor over 20:1) for reconstructing the dynamic images. Despite such difficulties, our results demonstrate that the reconstructed dynamic images are still adequate for perfusion-defect detection. For comparison purposes, we also reconstructed the gated images in a conventional way, in which images were reconstructed for separate time periods of the acquisition in order to maximize the defect contrast.
It should be noted that while this paper focuses on SPECT, the same principles should be equally applicable to other modalities such as positron emission tomography.
The rest of the paper is organized as follows. The imaging model for 5D imaging and the reconstruction methods used are given in Sec. 2. Discriminant analyses of gated-dynamic images for perfusion-defect detection are given in Sec. 3. In Sec. 4, we derive several metric maps to characterize the extent of the defect. Experiment results are given in Sec. 5. Finally, conclusions are given in Sec. 6.
RECONSTRUCTION METHODS
To facilitate subsequent development, in this section we provide a brief description of the 5D imaging model and the reconstruction methods used in this study.
Imaging model
We assume that list-mode data are binned into K cardiac gating intervals and T time points (reflecting actual time during the imaging session). Then the imaging data are described by the following model:
| (1) |
where gt,k and ft,k represent the projection data and the image, respectively, at time interval t for gate frame k, E[⋅] is the expectation operator, and Ht is the system matrix which is time-varying because of the rotation of the SPECT system. In this study, both the distance-dependent point spread function and the attenuation effect are modeled in Ht. As written in Eq. 1, the entity ft,k corresponds to the image counts during time interval t.
Given the acquired data gt,k, the goal is to reconstruct the gated-dynamic image sequence ft,k over time t=1,…,T for each gate k=1,…,K. This problem is severely underdetermined because at any given time instance t, the number of available projections is limited to only a few projection angles owing to the use of a rotating camera. This precludes the possibility of directly inverting Eq. 1 to obtain ft,k at any particular t. In our experiments, we applied a 5D reconstruction algorithm developed in our previous work,4 which is briefly described next.
5D dynamic reconstruction
For convenience, we define a vector containing all the dynamic images corresponding to gate frame k, k=1,…,K; similarly, we define containing all the projection data for gate k. Then the dynamic imaging model in Eq. 1 can be rewritten succinctly as
| (2) |
in which H≡diag[H1,H2,…,HT] is a block diagonal matrix describing effect of the system matrix Ht on the gated-dynamic images.
Now let be a collection of dynamic image vectors in all gates and be a collection of projection data vectors in all gating intervals. In 5D reconstruction, with the purpose being to combat the highly ill-posed nature of Eq. 2, we seek a solution according to the following constrained MAP criterion
| 3 |
where p(G|F) is the likelihood function of the data, p(F) is a prior distribution on F, and Ω denotes the set of admissible dynamic images F, which is used to regularize the dynamic behavior. The admissible set, which is the same as that proposed in Ref. 10, constrains the time-activity curves to be either constant, increasing only, decreasing only, or first increasing then decreasing. The prior term p(F) in Eq. 3 is defined as follows:
| (4) |
where Us(F) and Um(F) are energy functions defined over space and gating intervals, respectively, and βs and βm are the corresponding scalar weighting factors. The spatial term Us(F) is used to exploit the similarity among neighboring voxels, whereas the gating term Um(F) is used to exploit the similarity among different gating intervals. The details of these terms can be found in Refs. 4, 19.
Finally, to facilitate the solution of the constrained optimization problem in Eq. 3, we first express the dynamic image activity ft,k(j) at each voxel in terms of its temporal increment (for increasing activity) or decrement (for decreasing activity), as first proposed in Ref. 10. We then determine the dynamic images through estimation of their temporal increment or decrement. In our experiments, we used a modified one-step late (OSL) algorithm20 developed in our previous work.4, 19 For reference, we provide a summary of this algorithm in the Appendix0. We refer the reader to Refs. 4, 19 for implementation details.
DISCRIMINANT ANALYSES OF 5D GATED-DYNAMIC IMAGES FOR CHARACTERIZATION OF PERFUSION DEFECT
In this section, we conduct discriminant analyses to investigate whether the reconstructed 5D (gated-dynamic) images can provide useful information for perfusion-defect detection. For this purpose we explore two different approaches. In the first approach, we study whether the temporal information alone is sufficient to identify defects. Specifically, we apply linear discriminant analyses based on the reconstructed TACs to investigate whether they can differentiate between normal and defect regions in the myocardium. In the second approach, we study whether the spatial information reveals defects by using a channelized Hotelling observer21 (CHO) to characterize the detectability of a perfusion defect from the reconstructed dynamic images throughout the course of imaging. Such analyses will help establish the necessary foundation for our subsequent development (Sec. 4) toward the goal of extracting parametric maps from the reconstructed dynamic images to facilitate perfusion-defect detection and visualization.
Clustering analyses of TACs
Here we perform clustering analyses on the TACs extracted at different voxel locations by using two standard statistical tools in pattern analysis and classification: Fisher discriminant analysis and principal component analysis (PCA). Specifically, let fk(j)≡[f1,k(j),…,fT,k(j)]′, i.e., a vector representing the TAC at voxel j of the reconstructed dynamic images ft,k for gate k. We treat the TAC fk(j) at each voxel as a feature vector, and compare how it would differ at normal and defect locations.
Fisher discriminant analysis
The Fisher discriminant is a linear classifier commonly used in classification problems.22 At voxel j, it is given in the form h(j)=w′fk(j), for which the discriminant vector w is computed as
| (5) |
where μn and μd denote the mean TAC vectors of normal and defect, respectively, and Sw is the within-class scatter matrix. In our experiment, Sw was estimated from the reconstructed TACs as
| (6) |
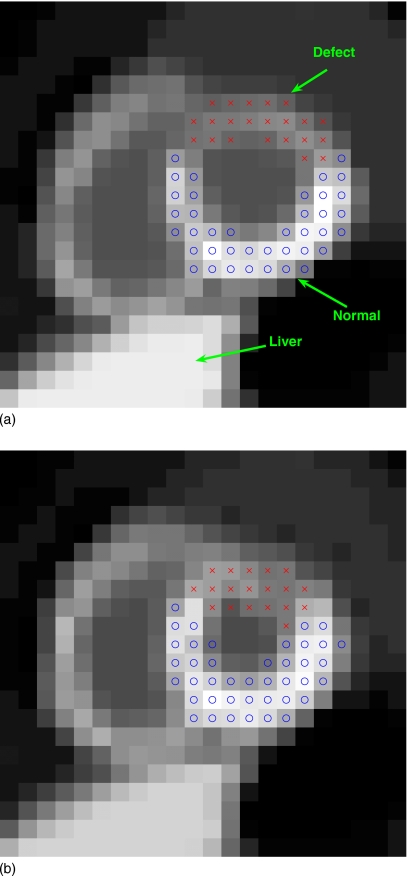
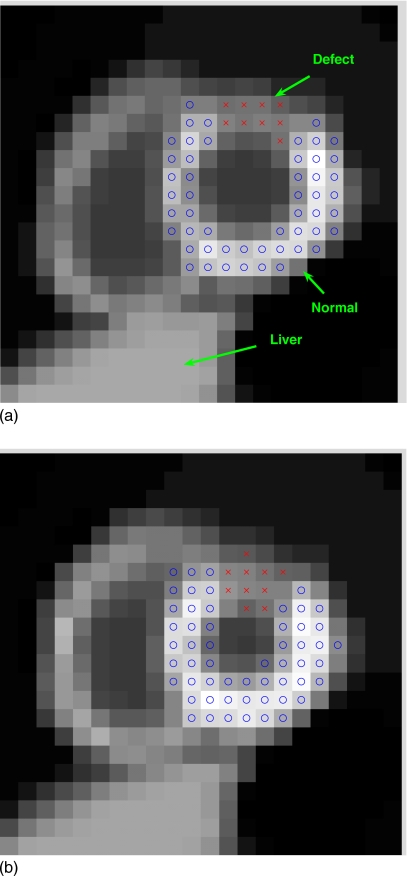
in which the first summation is over the voxels in a normal region of interest (ROI) in the myocardium, while the second summation is over the voxels in a defect ROI. The ROIs used in this study are shown in Fig. 2. All voxels in defect and normal ROIs from K gating intervals are included in the clusters.
Figure 2.
Two gated frames of a short-axis slice of the NCAT phantom with a simulated perfusion defect (indicated by x’s) in the anterior wall of the left ventricle: (a) End diastole and (b) end systole.
PCA
PCA is an unsupervised classification method that aims to find the structure that best explains the variation in the data in a mean-square error sense.23 Here we employ PCA to illustrate the difference between normal and perfusion-defect TACs from the reconstructed dynamic images. Specifically, at voxel j, the PCA vector is computed as
| (7) |
where W is a p×T matrix, in which the row vectors are formed by the first p principal eigenvectors of the scatter matrix Σ
| (8) |
where μ denotes the overall mean of the TACs and the summation is over both the normal and defect voxels. In our experiment, the matrix Σ was estimated from the normal and defect ROIs shown in Fig. 2. The first p=2 principal components were used to facilitate visualization.
CHO
We applied a CHO to measure the detectability of an introduced perfusion defect in the reconstructed images at different time points. In our implementation, we used four rotationally symmetric, nonoverlapping input channels for the CHO with the following passbands: (0.03125, 0.0625), (0.0625, 0.125), (0.125, 0.25), and (0.25, 0.5) cycles∕pixel. These channels are similar to those used in Ref. 21. Internal noise was introduced as in Refs. 24, 25. The detection performance was summarized using the area under the receiver operating characteristic (ROC) curve.26 A total of 60 noise realizations of reconstructed images were used: 30 with the defect present and 30 with the defect absent; the statistics were then estimated for the CHO to obtain the area under the ROC curve as in Ref. 24. These ROC studies were “signal-known exactly” and “background-known exactly” observer studies.24
PARAMETRIC MAPS FOR CHARACTERIZATION OF PERFUSION DEFECT
For 5D imaging to become useful, it will be necessary to develop methods of visualizing this new type of image sequence. In this section, we derive several parametric maps with the aim of characterizing information that is pertinent for detection of perfusion defects using the dynamic component of the 5D images.
Specifically, we explore three metric maps derived from the TACs in 5D-reconstructed dynamic sequences. The first metric is a direct result of the linear clustering analyses of the TACs in Sec. 3; the second measures the rate of change in tracer distribution; and the third is based on a composite of the kinetic parameters (uptake and washout) derived from a compartmental model of the TACs. Different from the first, the latter two metrics are explored as nonlinear metrics of the TACs.
To compare these derived maps for defect detection, we compute a contrast-to-noise measure to characterize the visibility of the defect relative to the background noise in the derived maps. We find that all of these measures were effective for differentiating perfusion defect from normal TACs in the examples we considered.
Parametric maps
Linear discriminant map
From the discriminant analyses in Sec. 3, it is logical to derive a quantitative map from the TACs of the reconstructed dynamic images for characterizing the presence of perfusion defects. Indeed, as described in Sec. 3A, a natural choice is to compute the Fisher discriminant on the TAC vector at each voxel location. That is, at voxel j with TAC fk(j), we compute the metric as
| (9) |
where w is the discriminant vector given in Eq. 5. By computing the discriminant h(j) at each voxel, we obtain a map depicting the regional dynamic behaviors. This resulting map will reflect the difference between the TACs of normal and perfusion-defect regions in the myocardium.
Temporal derivative map
In addition to the linear discriminant described above, another metric which is rather straightforward is based on the rate of change in the TACs. We compute the averaged rate of change at voxel j during the imaging period by
| (10) |
Compared to Eq. 9, R(j) is no longer a linear function of the TAC at voxel j. This approach is simple but, as we will show, it can produce excellent results in our experiments. This method has the added advantage that it requires no training procedure or compartmental model fitting. The rate R(j) is expected to be reduced in regions suffering from perfusion deficit, therefore serving as a discriminant metric for defect detection. We refer to this rate image subsequently as a derivative map.
Kinetic parametric images
We consider an additional type of metrics derived from compartmental modeling, which is widely used in kinetic analysis of TACs in dynamic imaging. We use the following two-compartmental model which has been used in cardiac SPECT imaging with Tc-99m labeled teboroxime27, 28
| (11) |
in which k21 and k12 denote, respectively, the uptake and washout rate constants, b(t) denotes the blood pool input function, fv denotes the spillover effect of the blood function, and Q(t) denotes the TAC.
In this study, the kinetic model in Eq. 11 is fit to the reconstructed TAC fk(j) at each voxel j in each gating interval k, resulting in estimates of the uptake and washout parameters k21(j) and k12(j). Our goal is to discriminate myocardial perfusion defects from normal tissue using parameters k21 and k12, which were found in previous studies28 to be highly correlated. In our experiments, we consider three ways on which to base detection of perfusion defects: (1) A Fisher discriminant applied to k21 and k12; (2) k21 only (i.e., uptake); and (3) k12 only (i.e., washout). Any of these three choices can be summarized by the following linear combination of k21 and k12:
| (12) |
The Fisher discriminant is selected by choosing α to be the discriminant vector; k12 is chosen by setting α=(1,0)′; and k12 becomes the defining variable when α=(0,1)′. We refer to the metric defined collectively by Eq. 12 as the kinetic composite map.
Characterization of parametric maps
Visibility of perfusion defect
To quantify the visibility of the perfusion defect in the derived parametric maps, we compute the contrast-to-noise ratio (CNR) for the perfusion defect relative to the normal myocardium. In particular, we compute the CNR values as follows:
| (13) |
where mn and md are the average parametric map values from the normal and defect ROIs in the myocardium, respectively, and and denote their corresponding variance values.
In our experiments the dynamic images of all K gating intervals were used for computing the measures described above. The defect and normal ROIs are as shown in Fig. 2.
Left ventricle ejection fraction
To provide evidence that the 5D imaging procedure does not sacrifice wall motion accuracy sought in traditional gated studies, we quantified the derived parametric maps using ejection fraction (EF), a measure pertinent to clinical assessment of left ventricle (LV) function. To obtain LV EF, a sequence of gated parametric maps was first generated; then the clinical software package 4DM-SPECT (Ref. 29) was used to compute the EF from this sequence.
Note that in clinical software, the image analysis parameters may not be optimized for the reconstruction methods we used, owing to the different resolution properties of the derived parametric maps. To accommodate this, we applied a training step (with a different set of ten noise realizations) prior to using the software, in which the parametric maps were first preprocessed with a low-pass Gaussian filter whose bandwidth was adjusted. The tuned bandwidth was applied afterward for preprocessing the reconstructed images prior to computing EF.
Data sets
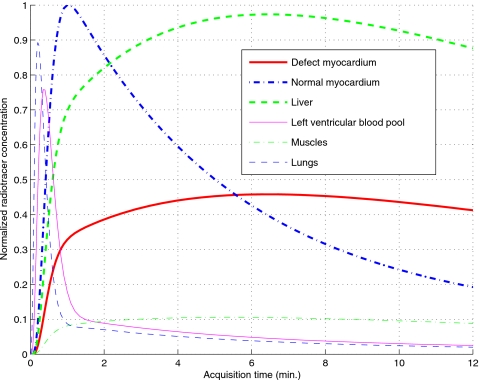
To demonstrate the proposed methods for perfusion-defect detection in dynamic SPECT imaging, we used the NCAT v2.0 phantom30 with a tracer-kinetic model simulating imaging with Tc99m-labeled teboroxime, as shown in Fig. 3, wherein different TACs were introduced within the different organs based on compartmental modeling of experimental measurements.31, 32 A simulated perfusion defect was introduced in the anterior wall of the LV, as illustrated in Fig. 2 in a short-axis slice of the LV for two different gating intervals (ED and ES). Note that the defect has lower uptake than the normal myocardium and there is a high concentration in the liver.
Figure 3.
Simulated time-activity curves of different organs.
It is noted that while teboroxime is currently not clinically available, there has been discussion of reintroducing it due to the recent development of fast cardiac-dedicated imaging systems. Furthermore, our developed methods are flexible and in principle should be equally applicable to other agents.
In our simulation, a triple-head camera system was used and 64 rotation steps covering a total of 360° by each head with 64×64 projection bins at each step were used during a 12 min data acquisition with eight gating intervals. The field of view was 40.5 cm. The system had a distance-dependent blur of approximately 13 mm full width at half-maximum at the center. The effect of attenuation factor was included in the simulation. Poisson noise was introduced corresponding to a count level of 8×10⁶ total counts for the study. We assumed perfect scatter correction in this study, as our primary focus is on the feasibility of perfusion-defect detection at this early stage of the development.
In our experiments, a total of 60 different noise realizations were simulated: 30 with the defect present and 30 with the defect absent. For each noise realization, the modified OSL (Ref. 20) 5D algorithm was applied to obtain a sequence of 3D volumetric images over eight gate frames and 64 time points during the 12 min period. The regularization parameters used were βm=2×10⁻⁵ and βs=0 for the prior term in Eq. 4; this setting was based on the optimization of the reconstruction accuracy of the myocardium.19 These reconstructed images were then used for subsequent discriminant analyses and evaluations.
The earlier example shown in Fig. 1 was from a typical noise run with the defect present, where one short-axis slice is shown over different gates (horizontally) and several selected time points (vertically). Note that the perfusion-defect region (Fig. 2) was initially dimmer than the rest of the LV wall in the early stage, reflecting slower update; it then reversed to become brighter in the late stage.
4D reconstruction methods
As a baseline for comparison, in our experiments we also reconstructed the gated images in a conventional way, in which dynamic changes in the acquired data are integrated out over separate time periods for each gating interval; next, a 4D reconstruction algorithm33 was applied to obtain a gated image sequence for each period. Specifically, we considered the following three time periods: (1) The washin stage, which is over the first 6 min of acquisition; (2) the washout stage, which is over the second 6 min of the acquisition; and (3) the entire period, which is over the entire 12 min.
The separate reconstruction of washin and washout periods was used to maximize the defect contrast.34, 35, 36 The contrast levels of the defect over the three periods above were as follows: 42.47%, 54.34%, and 13.07%, respectively. These gated sequences (which are better than a conventional gated sequence owing to the use of fully 4D reconstruction) were used for comparison purposes.
EVALUATION RESULTS AND DISCUSSIONS
Clustering analyses of TACs
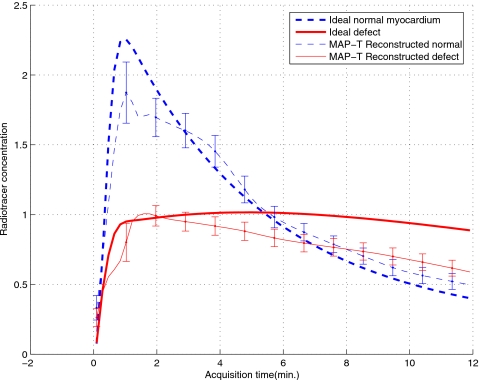
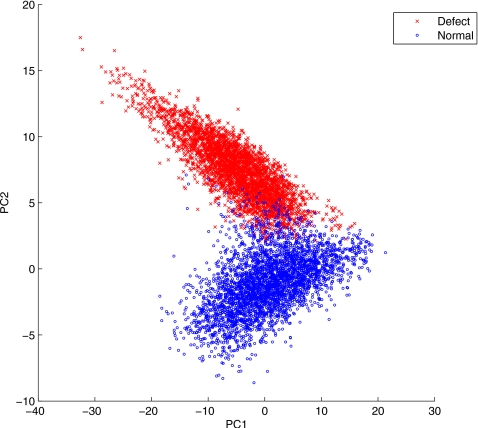
The PCA was applied to the reconstructed dynamic images from the 30 different noise realizations when the defect was present. The TACs were extracted for the voxels in the defect and normal ROIs shown in Fig. 2 for each of the eight gates and 30 noise realizations. We show the obtained TACs in Fig. 4. In Fig. 5 we show the results of PCA decomposition of the TACs based on the first two components; for clarity, only a small fraction (about 8.57%) of the extracted TACs are shown (3,460 normal; 3,330 defect). From these results we can see that even with only two components, the PCA plot already reveals a clear separation between the normal and defect voxels.
Figure 4.
Reconstructed time-activity curves of normal and defect ROIs.
Figure 5.
Scatter plot of the first two principal components of normal and defect TACs.
In addition, the Fisher discriminant was computed for all the extracted TACs. A t-test was then conducted between the normal and defect voxels on their Fisher discriminant values, which shows that the two groups are significantly different (p-value <1.0×10⁻¹⁰).
It is observed in Fig. 4 that the reconstructed normal myocardium TAC shows a consistent negative bias at the early stage of the imaging period. We believe that this is mainly caused by the slow rotation of the camera, which results in temporal undersampling of the fast uptake of the normal myocardium TAC. Moreover, the reconstructed defect TAC also shows a bias toward the end of the imaging period. This is likely caused by the reduced data counts in the late stage of the imaging period.
Despite these biases in the reconstructed TACs, it is interesting to note that the PCA results in Fig. 5 show that they are still informative to provide a distinctive separation between normal and defect TACs. As a powerful tool for exploring variations in high dimensional data, the PCA in this case reveals that the dominant variation among the collection of extracted TACs is attributed to the difference between normal and defect TACs.
CHO detectability on dynamic images
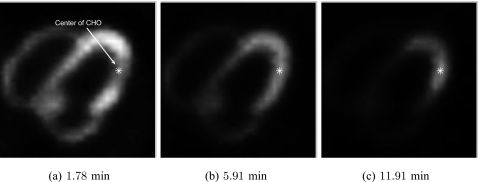
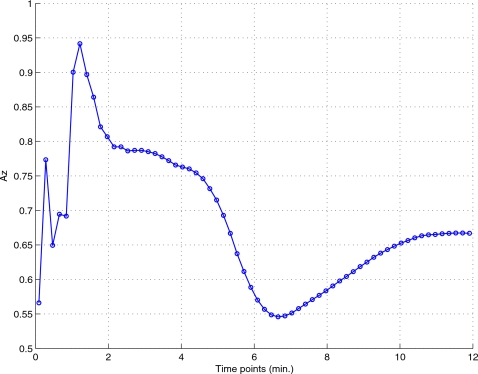
The CHO was applied to a slice of the myocardium (slice no. 21) at the first gating interval (near end diastole), as shown in Fig. 6, which shows the tracer distribution at three different time points. A 28×28 region centered on the lesion region was bilinearly interpolated into a 140×140 image. We summarize in Fig. 7 the lesion detectability results from the reconstructed dynamic images, where the area under the ROC curve (Az) is plotted for different time points. As can be seen, the best detection results occur at the early and late stages of the imaging period. This is consistent with the TACs in Fig. 3, where the image activity becomes less discernible between normal and defect regions near the middle stage. This is also reflected in reconstructed images shown earlier in Fig. 1.
Figure 6.
Center location of the CHO detector for defect shown at different time points: 1.78, 5.91, and 11.91 min. Note that the visibility of the defect is time-varying.
Figure 7.
CHO detection Az results obtained from the dynamic images at different time points over the imaging period.
Discriminant parametric maps
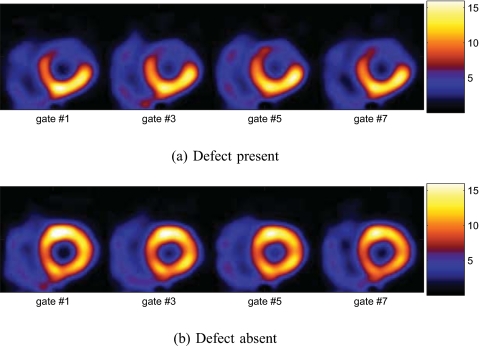
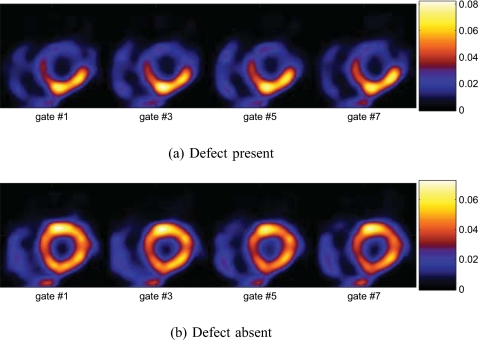
In Fig. 8a, we show the obtained Fisher discriminant map of the TACs from a typical noise realization for the same slice in Fig. 2 when the defect was present. The map shows much lower values in defect voxels than in normal voxels of the myocardium. For comparison, we also show the composite map obtained when the defect was absent in Fig. 8b.
Figure 8.
Fisher discriminant maps derived from the dynamic axis of the 5D images.
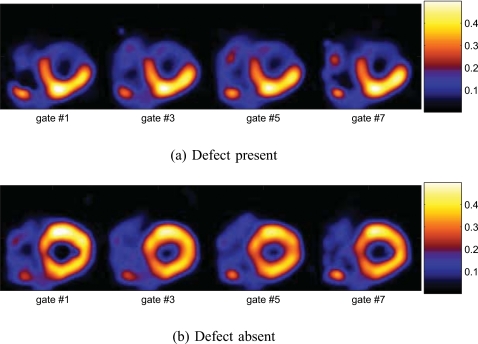
Similarly, in Fig. 9a, we show the derived derivative map R(j) of the TACs for the same slice obtained from the same noise realization as above when the defect was present; in this map, the intensity at each pixel j indicates the value of R(j). Once again, in this map, the image intensity is notably lower in the defect region than in the normal myocardium, reflecting slower tracer uptake and washout. For comparison, in Fig. 9b, we also show the derived derivative map from one realization when the defect was absent.
Figure 9.
Derivative maps derived from the dynamic axis of the 5D images.
Moreover, in Fig. 10a, we show the kinetic composite map for the same slice obtained from the same noise realiza-tion as above when the defect was present. In the composite map, the intensity in the defect region is much lower than in the normal myocardium. As above, we also show the composite map obtained when the defect was absent in Fig. 10b for comparison.
Figure 10.
Kinetic composite parametric maps derived from the dynamic axis of the 5D images.
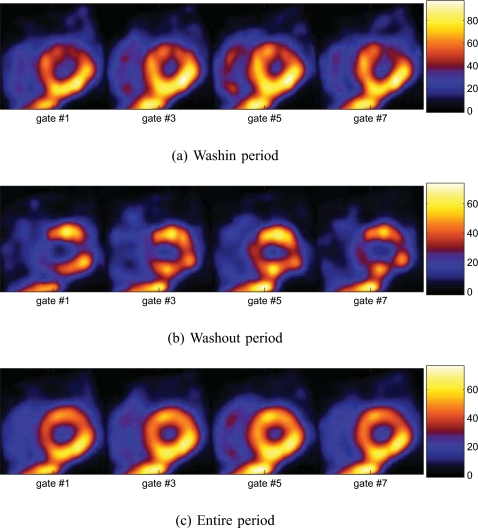
Finally, for comparison purposes, in Fig. 11 we show an example of gated 4D reconstructions of the same data over three time periods (washin, washout, and entire period) when the defect was present. As can be seen, owing to reduced data counts, the reconstructed images appear noisier in both the washin and washout periods than over the entire period; however, the contrast of the defect region is much reduced in the latter.
Figure 11.
Gated images obtained by 4D reconstruction over different periods (5D data collapsed along dynamic axis) with the defect present.
It is noted that the different parametric maps in Figs. 8910 above were shown using the same color map as for conventional SPECT images (as in Fig. 11). When displayed in cine, these parametric maps will have a similar appearance as in conventional SPECT, in which perfusion defects will appear as cool spots and the wall motion will also be shown.
Discriminant map comparison
To quantify the visibility of the perfusion defect in the different derived parametric maps, we computed CNR of the defect region relative to its surrounding normal myocardium. The results are summarized in Table 1. These results were obtained from 30 noise realizations when the defect was present. Both the average CNR values (given in dB) and their standard deviation values (in parentheses) are given in Table 1. These results demonstrate that all the derived metric maps can differentiate the perfusion defect from normal myocardium very well; the kinetic composite map yields a slightly higher mean value than other 5D maps. All the 5D maps show considerably higher visibility of the defect than the gated sequences obtained by 4D reconstruction methods over different time periods.
Table 1.
CNR values obtained by different derived parametric maps. These results were obtained from 30 noise realizations.
| Methods | CNR (SD) |
|---|---|
| Fisher discriminant map | 15.15 (1.14) |
| Temporal derivative map | 13.27 (1.27) |
| Kinetic uptake map | 13.68 (3.02) |
| Kinetic washout map | 16.41 (1.46) |
| Kinetic composite map | 17.19 (1.60) |
| Peak 5D image | 10.77 (1.30) |
| 4D—Washin period | 9.25 (1.31) |
| 4D—Washout period | 4.62 (2.53) |
| 4D—Entire period | 0.36 (2.47) |
Furthermore, for comparison, we also computed the CNR values of the reconstructed dynamic images at the different time points of the entire period; the best CNR results are given in Table 1 (peak 5D image). These results show that the derived metric maps can provide better visibility of the defect than at any individual time point of the reconstructed images.
The results in Table 1 reveal that the kinetic composite map achieves, on average, the highest CNR value. We believe this could be attributed to the smoothing effect on the TACs in the curve-fitting procedure when computing the kinetic parameters. In contrast, the lower CNR value achieved by the derivative map could be explained by the high sensitivity of the derivative operator to noise. Interestingly, the linear Fisher discriminant map could achieve almost as high CNR on average as the kinetic composite map.
Ejection fraction of LV
In Table 2, we show the EF results which were obtained from the different derived metric maps. These results were averaged from 30 noise realizations (with standard deviation values given in parentheses). As a reference, the ground truth of these parameters of the NCAT phantom is also listed. These results suggest that all of the proposed parametric maps can yield fairly accurate estimates of the EF, with the kinetic composite map achieving the smallest variance. These results demonstrate that the proposed parametric maps may indeed yield valid information for LV function assessment.
Table 2.
LV EF values from derived parametric maps. These results were obtained from 30 noise realizations.
| Methods | EF (SD) |
|---|---|
| Ground truth | 59.71 |
| Temporal derivative map | 55.73 (6.45) |
| Kinetic uptake map | 60.97 (3.16) |
| Kinetic washout map | 55.83 (1.95) |
| Kinetic composite map | 58.2 (1.71) |
| Fisher discriminant map | 57.37 (5.00) |
Additional results
We also tested our proposed metrics on some more subtle defects. As an example, here we furnish a set of results for a small defect shown in Fig. 12. In Fig. 13, we show the obtained different parametric maps from a particular noise realization with this defect present. As can be seen, the extent of the defect is also correctly identified in these parametric maps.
Figure 12.
Two gated frames of a short-axis slice of NCAT phantom with a small simulated perfusion defect: (a) End diastole and (b) end systole.
Figure 13.
Derived maps from the 5D-reconstructed dynamic images with a small perfusion defect.
CONCLUSIONS
In this work, we demonstrated the feasibility of 5D gated-dynamic reconstruction for perfusion-defect detection in cardiac SPECT imaging. We first demonstrated the usefulness of dynamic reconstructed images for perfusion detection by using linear discriminant analyses (Fisher linear discriminant analysis and principal component analysis) and a numerical channelized Hotelling observer. Then, we derived three types of discriminant metrics for characterizing the temporal kinetic information in reconstructed dynamic images for differentiating perfusion defects from normal cardiac perfusion. Our generated parametric maps and quantitative contrast-to-noise ratio results demonstrated that the reconstructed dynamic images could yield higher detectability of the perfusion defect than a conventional gated reconstruction, while providing accurate wall motion information simultaneously. Encouraged by this success, in the future we plan to further evaluate this procedure using more clinically relevant tasks.
Our numerical results indicate that the image activity can be biased at early stage in the normal myocardium and late stage in perfusion defect. One possible solution to this problem could be to use list-mode data, which will likely improve the time resolution. Moreover, for simplicity, at this initial stage of development of our methods we did not model the scatter effect in the data; therefore, our results represent what would be obtainable in the ideal case of perfect scatter correction. These subjects are worthy of future studies.
ACKNOWLEDGMENTS
This work was supported by the National Institutes of Health under Grant No. HL65425.
APPENDIX: MODIFIED OSL ALGORITHM
Let A denote the differential operator for computing the temporal increment (or decrement) at each voxel in F and let denote the transformed incremental (or decremental) form of F, i.e.,
| (A1) |
Moreover, let Ak denote the corresponding suboperator of A restricted to gate k, i.e., , which is the incremental form of fk.
Upon some algebraic manipulation, the MAP estimate in Eq. 3 with Poisson likelihood can be solved in terms of from maximizing function
| (A2) |
where (i) denotes the ith projection bin of.
We implemented a fully 5D version of the OSL EM algorithm20 for the maximization problem in Eq. A2. In this algorithm, at each iteration, the image voxels are updated as follows:
| (A3) |
where
| (A4) |
where n denotes the iteration number. At each step, the step size αn is first set to 1, then successively reduced by half if necessary to ensure that the objective function is nondecreasing.
References
- Garcia E. G., “Imaging guidelines for nuclear cardiology procedures part I,” J. Nucl. Cardiol. 3, G1–G46 (1996). [PubMed] [Google Scholar]
- Morris E. D., Endres C. J., Schimidt K. C., Christian B. T., R. F.Muzic, Jr., and Fisher R. E., “Kinetic modeling in positron emission tomography,” in Emission Tomography: The Fundamentals of PET and SPECT, edited by Wernick M. N. and Aarsvold J. N. (Elsevier/Academic, San Diego, 2004). [Google Scholar]
- Feng B., Pretorius P. H., Farncombe T. H., Dahlberg S. T., Narayanan M. V., Wernick M. N., Celler A. M., Leppo J. A., and King M. A., “Simultaneous assessment of cardiac perfusion and function using 5-dimensional imaging with Tc-99m teboroxime,” J. Nucl. Cardiol. 13(3), 354–361 (2006). 10.1016/j.nuclcard.2006.03.004 [DOI] [PubMed] [Google Scholar]
- Jin M., Yang Y., and King M. A., “Reconstruction of dynamic gated cardiac SPECT,” Med. Phys. 33(11), 4384–4394 (2006). 10.1118/1.2358201 [DOI] [PubMed] [Google Scholar]
- Gullberg G. T., Di Bella E. V. R., and Sinusas A. J., “Estimation of coronary flow reserve: Can SPECT compete with other modalities?,” J. Nucl. Cardiol. 8(5), 620–625 (2001). 10.1067/mnc.2001.118121 [DOI] [PubMed] [Google Scholar]
- Gilland D. R., Mair B. A., Bowsher J. E., and Jaszczak R. J., “Simultaneous reconstruction and motion estimation for gated cardiac SPECT,” IEEE Trans. Nucl. Sci. 49, 2344–2349 (2002). 10.1109/TNS.2002.803820 [DOI] [Google Scholar]
- Lalush D. S. and Tsui B. M. W., “Block-iterative techniques for fast 4D reconstruction using a prior motion models in gated cardiac SPECT,” Phys. Med. Biol. 43, 875–886 (1998). 10.1088/0031-9155/43/4/015 [DOI] [PubMed] [Google Scholar]
- Brankov J. G., Yang Y., and Wernick M. N., “Spatio-temporal processing of gated cardiac SPECT images using deformable mesh modeling,” Med. Phys. 32(9), 2839–2849 (2005). 10.1118/1.2013027 [DOI] [PubMed] [Google Scholar]
- Gravier E. and Yang Y., “Motion-compensated reconstruction of tomographic image sequences,” IEEE Trans. Nucl. Sci. 52, 51–56 (2005). 10.1109/TNS.2004.843092 [DOI] [Google Scholar]
- Farncombe T. H., “Functional dynamic SPECT imaging using a single slow camera rotation,” Ph.D. dissertation, University of British Columbia, West Mall, Vancouver, British Columbia, Canada, 2000. [Google Scholar]
- Reutter B. W., Gullberg G. T., and Huesman R. H., “Effects of temporal modeling on the statistical uncertainty of spatiotemporal distributions estimated directly from dynamic SPECT projections,” Phys. Med. Biol. 47, 2673–2683 (2002). 10.1088/0031-9155/47/15/309 [DOI] [PubMed] [Google Scholar]
- Kao C. -M., Yap J. T., Mukherjee J., and Wernick M. N., “Image reconstruction for dynamic PET based on low-order approximation and restoration of the sinogram,” IEEE Trans. Med. Imaging 16(6), 738–749 (1997). 10.1109/42.650871 [DOI] [PubMed] [Google Scholar]
- Wernick M. N., Infusino J. E., and Milosevic M., “Fast spatio-temporal image reconstruction for dynamic PET,” IEEE Trans. Med. Imaging 18, 185–195 (1999). 10.1109/42.764885 [DOI] [PubMed] [Google Scholar]
- Thanyasrisung P. and Yu X., “Data reduction for lesion detection in dynamic positron-emission tomography (PET),” in IEEE Nuclear Science Symposium Conference Record, 1998, pp. 1916–1919.
- Nichols T. E., Qi J., Asma E., and Leahy R. M., “Spatiotemporal reconstruction of list-mode PET data,” IEEE Trans. Med. Imaging 21, 396–404 (2002). 10.1109/TMI.2002.1000263 [DOI] [PubMed] [Google Scholar]
- Farncombe T. H., King M. A., Celler A. M., and Blinder S., “A fully 4D expectation maximization algorithm using Gaussian diffusion based detector response for slow camera rotation dynamic SPECT,” in Proceedings of the Sixth Meeting on Fully Three-Dimensional Image Reconstruction in Radiology and Nuclear Medicine, 2001, pp. 129–132.
- Feng B., Pretorius P. H., Farncombe T. H., Dahlberg S. T., Narayanan M. V., Wernick M. N., Celler A. M., King M. A., and Leppo J. A., “Imaging time-varying Tc-99m teboroxime localization and cardiac function simultaneously by five-dimensional (5D) gated-dynamic SPECT imaging and reconstruction,” J. Nucl. Cardiol. 2, S11–S12 (2003). [Google Scholar]
- Jin M., Yang Y., Wernick M. N., and King M. A., “Motion-compensated dynamic image reconstruction for gated cardiac SPECT,” in Proceedings of the IEEE International Symposium on Biomedical Imaging : Macro to Nano, 2006, pp. 267–270.
- Jin M., Yang Y., Wernick M. N., and King M. A., “Fully 5D reconstruction of gated dynamic cardiac SPECT images,” in IEEE Nuclear Science Symposium Conference Record, 2006, pp. 3445–3448.
- Lange K., “Convergence of EM image reconstruction algorithms with Gibbs smoothing,” IEEE Trans. Med. Imaging 9, 439–446 (1990). 10.1109/42.61759 [DOI] [PubMed] [Google Scholar]
- Myers K. J. and Barett H. H., “Addition of a channel mechanism to the ideal-observer model,” J. Opt. Soc. Am. A 4(12), 2447–2457 (1987). 10.1364/JOSAA.4.002447 [DOI] [PubMed] [Google Scholar]
- Fisher R. A., “The use of multiple measurements in taxonomic problems,” Annals of Eugenics 7, 179–188 (1936). [Google Scholar]
- Jolliffe I. T., Principal Component Analysis (Springer, New York, 2002). [Google Scholar]
- Narayanan M. V., Gifford H. C., King M. A., Pretorius P. H., Farncombe T. H., Bruyant P., and Wernick M. N., “Optimization of iterative reconstructions of Tc99m cardiac SPECT studies using numerical observers,” IEEE Trans. Nucl. Sci. 49(5), 2355–2360 (2002). 10.1109/TNS.2002.803805 [DOI] [Google Scholar]
- Jin M., Yang Y., Niu X., Marin T., Brankov J. G., Feng B., Pretorius P. H., King M. A., and Wernick M. N., “Quantitative evaluation study of four-dimensional gated cardiac SPECT reconstruction,” Phys. Med. Biol. 54, 5643–5659 (2009). 10.1088/0031-9155/54/18/019 [DOI] [PMC free article] [PubMed] [Google Scholar]
- Metz C. E., “ROC methodology in radiologic imaging,” Invest. Radiol. 21, 720–733 (1986). 10.1097/00004424-198609000-00009 [DOI] [PubMed] [Google Scholar]
- Smith A. M., Gullberg G. T., and Christian P. E., “Experimental verification of technetium 99m-labeled teboroxime kinetic parameters in the myocardium with dynamic single photon emission computed tomography: Reproducibility, correlation to flow, and susceptibility to extravascular contamination,” J. Nucl. Cardiol. 3, 130–142 (1996). 10.1016/S1071-3581(96)90005-7 [DOI] [PubMed] [Google Scholar]
- Chiao P. C., Ficaro E. P., Dayanikli F., Rogers W. L., and Schwaiger M., “Compartmental analysis of technetium-99m-teboroxime kinetics employing fast dynamic SPECT at rest and stress,” J. Nucl. Med. 35, 1265–1273 (1994). [PubMed] [Google Scholar]
- Ficaro E. P., Lee B. C., Kritzman J. N., and Corbett J. R., “Corridor4DM: The Michigan method for quantitative nuclear cardiology,” J. Nucl. Cardiol. 14(4), 455–465 (2007). 10.1016/j.nuclcard.2007.06.006 [DOI] [PubMed] [Google Scholar]
- Segars W. P., Lalush D. S., and Tsui B. M. W., “A realistic spline-based dynamic heart phantom,” IEEE Trans. Nucl. Sci. 46, 503–506 (1999). 10.1109/23.775570 [DOI] [Google Scholar]
- Di Bella E. V., Ross S. G., Kadrmas D. J., Khare H. S., Christian P. E., McJames S., and Gullberg A. G., “Compartmental modeling of technetium-99m-labeled teboroxime with dynamic single-photon emission computed tomography: Comparison with static thallium-201 in a canine model,” Invest. Radiol. 36(3), 178–185 (2001). 10.1097/00004424-200103000-00007 [DOI] [PMC free article] [PubMed] [Google Scholar]
- Sitek A., Di Bella E. V., and Gullberg G. T., “Factor analysis with a priori knowledge—Application in dynamic cardiac SPECT,” Phys. Med. Biol. 45(9), 2619–2638 (2000). 10.1088/0031-9155/45/9/314 [DOI] [PubMed] [Google Scholar]
- Gravier E., Yang Y., King M. A., and Jin M., “Fully 4D motion-compensated reconstruction of cardiac SPECT images,” Phys. Med. Biol. 51, 4603–4619 (2006). 10.1088/0031-9155/51/18/010 [DOI] [PubMed] [Google Scholar]
- O’Connor M. K. and Cho D. S., “Rapid radiotracer washout from the heart: Effect on image quality in SPECT performed with a single-headed gamma camera system,” J. Nucl. Med. 33, 1146–1151 (1992). [PubMed] [Google Scholar]
- Chua T., Kiat H., Germano G., Takemoto K., Fernandez G., Biasio Y., Friedman J., and Berman D., “Rapid back to back adenosine stress/rest technetium-99m teboroxime myocardial perfusion SPECT using a triple-detector camera,” J. Nucl. Med. 34, 1485–1493 (1993). [PubMed] [Google Scholar]
- Henzlova M. J. and Machac J., “Clinical utility of technetium-99m-teboroxime myocardial washout imaging,” J. Nucl. Med. 35, 575–579 (1994). [PubMed] [Google Scholar]


