

Abstract
Ultrasound has been previously shown to act synergistically with a thrombolytic agent, such as recombinant tissue plasminogen activator (rt-PA) to accelerate thrombolysis. In this in vitro study, a commercial contrast agent, Definity®, was used to promote and sustain the nucleation of cavitation during pulsed ultrasound exposure at 120 kHz. Ultraharmonic signals, broadband emissions, and harmonics of the fundamental were measured acoustically by using a focused hydrophone as a passive cavitation detector and utilized to quantify the level of cavitation activity. Human whole blood clots suspended in human plasma were exposed to a combination of rt-PA, Definity®, and ultrasound at a range of ultrasound peak-to-peak pressure amplitudes, which were selected to expose clots to various degrees of cavitation activity. Thrombolytic efficacy was determined by measuring clot mass loss before and after the treatment and correlated with the degree of cavitation activity. The penetration depth of rt-PA and plasminogen was also evaluated in the presence of cavitating microbubbles using a dual antibody fluorescence imaging technique. The largest mass loss (26.2%) was observed for clots treated with 120 kHz ultrasound (0.32 MPa peak-to-peak pressure amplitude), rt-PA and stable cavitation nucleated by Definity®. A significant correlation was observed between mass loss and ultraharmonic signals (r=0.8549, p<0.0001, n=24). The largest mean penetration depth of rt-PA (222 µm) and plasminogen (241 µm) was observed in the presence of stable cavitation activity. Stable cavitation activity plays an important role in enhancement of thrombolysis and can be monitored to evaluate the efficacy of thrombolytic treatment.
Keywords: Ultrasound-assisted thrombolysis, stroke therapy, ultraharmonics, stable cavitation, therapeutic ultrasound
INTRODUCTION
The use of ultrasound (US) to enhance thrombolysis has many potential benefits in treatment of diseases like ischemic stroke, myocardial infarction and deep vein thrombosis which are caused by thrombus formation. Intravenous administration of tissue plasminogen activator is the only clinically approved therapy for limited cases of ischemic stroke (NINDS stroke study group 1995; Broderick et al. 2002). In several in vitro studies US has been used to demonstrate thrombolytic enhancement when used as an adjuvant to rt-PA (Lauer et al. 1992; Francis et al. 1992; Blinc et al. 1993). Several studies have also shown that better penetration of US through skull as well as enhanced fibrinolysis can be achieved using frequencies in the 20 to 500 kHz range (Blinc et al. 1993; Suchkova et al. 1998; Akiyama et al. 1998; Behrens et al. 1999; Coussios et al. 2002). Theoretically, Diamond and Anand (1993) demonstrated that the process of thrombolysis is limited by diffusion of fibrinolytic enzymes into the clot. This was experimentally demonstrated by Blinc et al (1992). In several mechanistic in vitro studies it is speculated that US facilitates transport of fibrinolytic enzymes into the clot (Francis et al. 1995; Pieters et al. 2004; Devcic-Kuhar et al. 2004) along with mechanical effects like microstreaming (Sakharov et al 2000) and acoustic cavitation (Everbach and Francis 2000; Datta et al. 2005, 2006; Prokop et al. 2007) among other possible mechanisms.
Tachibana and Tachibana (1995) introduced the use of microbubbles to augment thrombolysis using 170-kHz US adjuvant to urokinase in an in vitro human blood clot model. They suggested the use of diagnostic contrast agents for therapeutic augmentation of thrombolytic drugs. Xie et al. (2005) demonstrated the effectiveness of lipid-encapsulated microbubbles and 1 MHz US in the recanalization of arteriovenous graft thrombi in an animal model. They observed a significantly greater clearing of thrombus using higher intensities (10 W/cm2) compared to lower intensities (0.4 to 0.6 W/cm2) and attributed this effect to the presence of cavitation. Molina et al. (2006) administered microbubbles and tissue plasminogen activator (tPA) along with 2-MHz US and accelerated clot lysis in clinical trials. Although this approach appears promising, the mechanisms responsible for this US enhancement are still not well understood. In a previous study, Datta et al. (2006) monitored subharmonic emissions due to stable cavitation and correlated this type of bubble behavior with clot mass loss. The detection of subharmonic or ultraharmonic signals provides a possible method to monitor the progress of US enhancement of thrombolysis. Such techniques to monitor and measure cavitation activity during therapy are needed to monitor and perhaps even control thrombolytic progress.
The objective of this investigation was to determine whether 120-kHz pulsed US and an infusion of an echo contrast agent could enhance clot lysis and penetration of rt-PA into human whole blood clots in vitro. The hypotheses tested in this study are (a) whether the use of a contrast agent (Definity®) with 120-kHz pulsed US results in a measurable increase in stable cavitation activity over the treatment duration of 30 min and (b) whether the presence of sustained stable cavitation activity results in enhanced thrombolysis and increased penetration of rt-PA into the clots.
MATERIALS AND METHODS
Ultrasound Thrombolysis System Overview
A prototype 6.14 cm-diameter single circular element, unfocused, 120-kHz transducer (Sonic Concepts Inc., Woodinville, WA, USA) was used for sonication of clots as described previously (Datta et al 2006). The transducer used in this study has a −3-dB beam width of 2.5 cm and a Rayleigh distance of 10.6 cm. An illustration of the experimental set up is shown in Fig. 1. The 120 kHz transducer was driven by a function generator (Agilent 33120A, Palo Alto, CA, USA), power amplifier (75A250, AR Amplifier Inc., Souderton, PA, USA), and a custom-built impedance matching network (Sonic Concepts Inc.). For all experiments described in this study, the 120 kHz transducer was driven in pulsed mode with an 80% duty cycle and 1667 Hz pulse repetition frequency consistent with previous studies (Datta et al., 2006, Holland et al., 2002). The sample chamber, consisting of an acoustically transparent latex condom, was placed at the Rayleigh distance of the 120 kHz transducer using a three axis translation stage (Newport 423, Irvine, CA, USA). Human blood clots suspended in 30 ml of plasma rested in the tip of condom. The sample chamber was placed in a Lucite tank filled with degassed water at 37 °C and dissolved oxygen level (PO2) maintained below 40% saturation as measured by a dissolved oxygen meter (Oakton DO100, Vernon Hills, IL, USA). The tank wall opposite the 120 kHz transducer was lined with acoustically matched absorbing material (Aptflex F36, Precision Acoustics, Dorchester, UK) to prevent reflection and the formation of standing waves.
Figure 1.

Experimental setup for ultrasound exposure of human blood clots placed in a sample holder containing plasma and Definity®. A focused hydrophone placed 90 degrees to the acoustic axis of the 120-kHz transducer and with its focus coincident with the blood clot was used as a passive cavitation detector.
Clot formation protocol
Human whole blood was drawn from four volunteers by sterile venipuncture following local Institutional Review Board approval. Clots were prepared by aliquoting 1.5 ml of fresh human blood into 1.3 cm inner diameter Vacutainer tubes, incubating the tubes in a 37 °C water bath for 3 h and storing the clots in a 5 °C in refrigerator for at least 72 h prior to use in the experiments in order to allow complete clot retraction. The clot formation and handling protocol has been described previously (Shaw et al. 2006; Datta et al. 2006; Holland et al. 2007). The clots were weighed initially before any treatment and were placed in the sample chamber containing 30 ml of thawed human fresh frozen plasma and held at 37°C. Reconstituted rt-PA (96 µg/ml) was added to the plasma for rt-PA alone treatment and combined US and rt-PA treatments. The treatment times were fixed at 30 min. The rt-PA dose and clinically relevant treatment duration is consistent with previous studies (Datta et al. 2006; Holland et al. 2007). Following exposure, each clot was weighed again and the extent of thrombolysis was determined as a percent mass loss.
Contrast agent preparation
Definity® vials were activated at room temperature using the Vialmix™ agent activator (Bristol-Myers Squibb Medical Imaging, MA, USA) according to the manufacturer’s instructions. After the 45s activation cycle, the vials were left for 2 min to return to room temperature. The agent was drawn from the vial using a 20 gauge needle from the base of the vial while venting to the atmosphere with a second 22 gauge needle and a 0.2 micron in line filter. The volume of agent drawn at a time was 0.1 ml and this aliquot was diluted by a factor of 100 by volume in PBS (phosphate buffered saline). Subsequently, 100 µl aliquots of the diluted Definity® were infused as a series of bolus injections every 3 min, each at a rate of 80 µl/s, using a syringe pump (K.D. Scientific, model 230, Holliston, MA). A 4F angiographic catheter (Medi-tech Inc., Watertown, MA, USA) inside an air filled 9F sheath catheter (Cordis Corp., Miami, FL, USA) was used to deliver contrast agent next to the blood clot inside the sample chamber. The column of air surrounding the inner catheter provided acoustic shielding to the contrast agent within the catheter itself. The number density of microbubbles delivered with each bolus infusion was 1.2 × 10⁸ microbubbles/ml. This microbubble density is two orders of magnitude less than the maximum bolus concentration recommended by the manufacturer for diagnostic applications. The recommended dose is 10 µl/kg activated Definity (1.2 × 10¹⁰ microbubbles/ml) by bolus injection within 30 to 60s. In treatments (rt-PA, US, PBS infusions without Definity®) without the use of a contrast agent an equivalent volume of PBS was infused in the sample chamber using the same catheter arrangement.
Cavitation detection system
A cylindrically focused broadband hydrophone (Sonic Concepts Inc.), placed orthogonally to the 120-kHz beam axis, was employed to passively detect cavitation activity in the sample chamber as shown in Fig. 1. The cavitation detection hydrophone was mounted on a micrometer-controlled 3-axis translation stage (Newport 423, Irvine, CA, USA) for precise alignment with blood clots. A 5 mm brass ball, positioned at the Rayleigh distance of the 120 kHz transducer, was used as an acoustic target for initial alignment of the broadband cylindrically focused hydrophone. Finally, acoustic scattering from the clot itself was used to finalize the alignment so that a volume encompassing the clot was monitored for cavitation by the focused hydrophone. The cylindrically focused hydrophone has a −6 dB focal depth of field of 3.6 cm along its axis, a focal width of 1.3 cm and thickness of 0.1 cm. Signal acquired by the hydrophone was gated to account for the travel time of the pulse from the 120 kHz transducer and hydrophone. The signal received by the focused hydrophone was amplified using a pre-amplifier (Signal Recovery 5185, Oak Ridge, TN, USA) and stored using a digital oscilloscope (Lecroy Waver Surfer 424, Chestnut Ridge, NY, USA). The signal received by the hydrophone was gated to ensure that cavitation was monitored over a region encompassing the clot surface, interior of the clot and surrounding fluid. The start of the gating window was thus set to 102 µs, the time which corresponds to the travel time of the ultrasound pulse from the 120 kHz transducer to the hydrophone. The duration of the gating window was set to 20 ms in order to ensure a frequency resolution of 5 kHz. The cavitation detector signal therefore consisted of 500,000 points acquired at a sampling rate of 25 MHz and recorded in binary format twice a second. Each time trace file thus consisted of 33 contiguous pulses recorded in a binary format. The binary files were converted to MATLAB (MathWorks Inc., Natick, MA, USA) data files and zero padded to 16384 points. A Hanning window was subsequently applied before performing a fast Fourier transformation for each pulse. The squared frequency spectra for the 33 pulses were averaged in the frequency domain. A schematic of the signal processing is illustrated in Fig. 2.
Figure 2.

Schematic of the signal processing algorithm to determine cavitation dose from scattered acoustic signals received by the broadband focused hydrophone.
The appearance of ultraharmonics in the signal received by the hydrophone indicated stable cavitation activity in the vicinity of the blood clot. In this stable cavitation detection scheme, ultraharmonics were frequency components at odd multiples of 60 kHz, half the main excitation frequency. The appearance of broadband noise emissions designated inertial cavitation in that same region. In order to determine the threshold for stable and inertial cavitation in this system, samples containing a human blood clot, plasma and Definity® were exposed to 120-kHz pulsed US with an 80% duty cycle and a 1667-Hz pulse repetition frequency. The frequency content of the signal received by the focused hydrophone was analyzed for excitation pressure amplitudes in the range 0.06–0.75 MPa. A total of 20 files were recorded over a period of 10 seconds for each pressure and were analyzed for ultraharmonic and broadband noise emissions. This process was repeated using three different samples at each pressure amplitude. Ten consecutive odd ultraharmonics of the subharmonic (60 kHz) component in the frequency range of 300 kHz to 1.5 MHz were extracted from the frequency spectrum using a digital band pass comb filter. Each frequency band was centered at the corresponding ultraharmonic frequency with a fixed bandwidth of 7.6 kHz which is comparable to the −6dB bandwidth of the 120 kHz tone bursts employed. Spectral power in ten bands between the ultraharmonics and harmonics of the fundamental were used to determine the baseline noise floor as well as changes in the broadband noise energy used as a measure of inertial cavitation activity. The levels of ultraharmonic and broadband noise power as a function of excitation pressure are shown in Fig 3.
Figure 3.
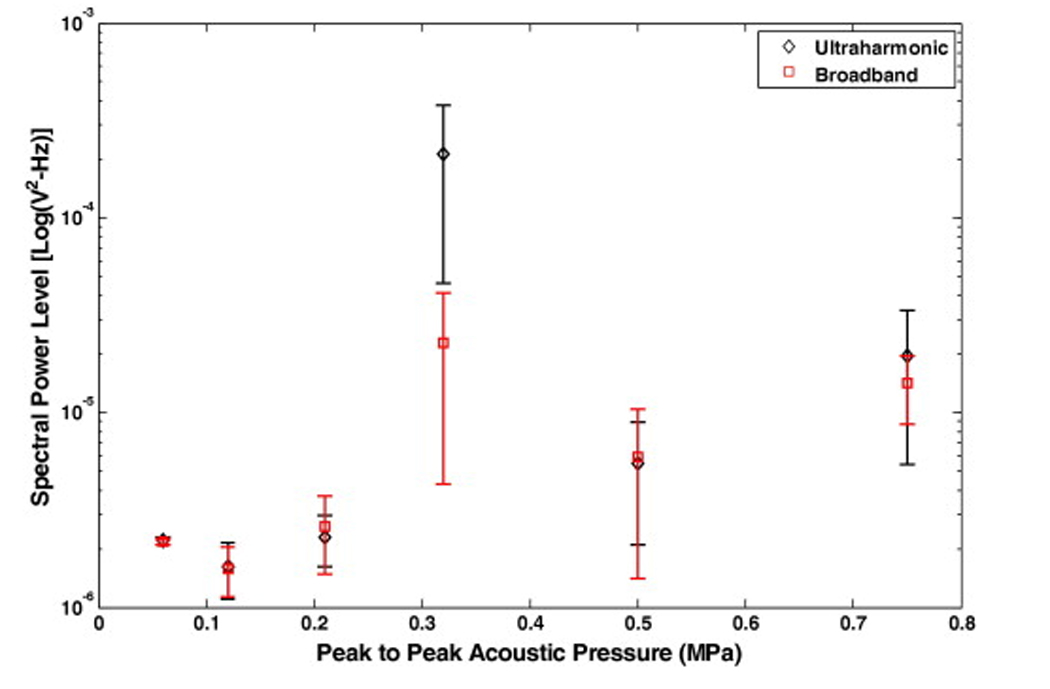
Spectral power levels in ultraharmonic and broadband bands as a function of increasing peak-to-peak acoustic pressure amplitude. The scattered signal is received by a hydrophone placed 90 degrees to the source transducer axis with its focus coincident with the region of the sample holder containing a human clot in plasma and Definity®. Three different samples were exposed at each pressure and error bars represent the standard deviation of 60 measurements.
During the clot mass loss experiments, a total of 3600 files were recorded over a period of 30 min. Spectral power in the ultraharmonic bands was integrated over the 30 min duration and used as a measure of the extent or dose of stable cavitation as illustrated conceptually in Fig. 2. The fraction of the exposure time during which the energy in ultraharmonic bands was higher than the baseline spectral components due to scattering from the contents of the sample holder was used as a measure of the duration of stable cavitation activity. Spectral power in the bands between the ultraharmonics and harmonics of the fundamental were used as a measure of inertial cavitation activity. In this approach, the selected spectral bands were sufficiently close to enable meaningful comparison without the need to correct for the frequency response of the hydrophone.
To evaluate the effect of Definity® on scattered energy, the harmonics of the fundamental detected from the contents of the sample holder including clot, plasma and Definity® were also measured using a similar approach. To estimate the fractional stable cavitation duration, the mean and standard deviation measurements of spectral power in bands representing broadband or baseline emissions were used. The fractional stable cavitation duration was defined as the percentage of time the combined spectral power in the ultraharmonic bands was greater than two standard deviations above the mean of broadband or baseline spectral bands for that treatment.
Three rt-PA concentrations of 1.4 µg/ml, 11.0 µg/ml and 96.0 µg/ml were used in this work to study the effect of Definity® infusions on US enhancement of thrombolysis. The lowest concentration chosen was approximately 8 times lower than the maximum allowable human clinical dose (NINDS stroke study group 1995, Broderick et al. 2002). Similarly, the highest concentration used was approximately 8 times higher than human dose as was used in previous study (Datta et al. 2006). The approach of sustaining stable cavitation throughout the treatment period was explored at the lower rt-PA concentrations (1.4 µg/ml and 11.0 µg/ml) using Definity® infusions every 3 min and US exposures with a peak-to-peak pressure amplitude of 0.32 MPa. Both rt-PA alone and rt-PA, US, PBS infusions without Definity® data were also acquired for the lower rt-PA concentrations.
Fluorescence dual antibody staining
After treatment the clots were immersed in optimal cutting temperature gel (Tissue Tek, Redding, CA, USA) and snap frozen in liquid nitrogen and stored at −80 °C. The clots were thawed to room temperature for pathological analysis and fixed by immersion in 3% paraformaldehyde solution for 48 h and 30% sucrose solution for 24 h. The clots were cut in 25µm thick sections using a microtome for fluorescence dual antibody staining. The primary antibodies used were monoclonal antibody (mouse immunoglobulin, IgG) against human plasminogen (1:1000 dilution; AB10178; Abcam Inc., Cambridge, MA, USA) and polyclonal antibody (goat IgG) against human tPA (1:1000 dilution; 387; American Diagnostics Inc., Stamford, CT, USA). Dilutions were done in blocking buffer (2% horse serum, 0.3% Triton, and 0.1% bovine serum albumin in 0.1 M phosphate buffer). The two secondary antibodies that were used were donkey anti-goat IgG (dilution 1:500; A11055; Molecular Probes Inc., OR, USA) and donkey anti-mouse IgG (dilution 1:500; A31570; Molecular Probes Inc., OR, USA).
Clot sections were incubated in the primary antibodies for 1 h, washed three times with saline solution and blocked before incubating in secondary antibodies for 1 h. After incubation with secondary antibodies, clot sections were washed again three times with saline solution, mounted on glass slides (Fisher Scientific, Pittsburgh, PA, USA), and sealed with glass cover slips. Clot sections were imaged using a fluorescent microscope BX51 (Olympus America Inc., Melville, NY, USA) with a 10X objective and images were acquired using Spot Advanced software (Diagnostic Instruments Inc., Sterling Heights, MI, USA) and stored on a desktop computer. The exposure parameters (time and gain) were adjusted to calibrate images of each clot section and the same fixed exposures parameters and filter were used to analyze all the images for that particular section. A total of five images were taken for each clot section; one at the center and one each at randomly selected 3, 6, 9 and 12 o’clock positions encompassing clot edge and a portion of interior of the clot section. In the images, the area of rt-PA localization appears bright green and the area of plasminogen localization appeared red. For each clot section the image of the interior of the clot served as its own control. The brightness level for the image obtained for clot center was adjusted using the window/level function available in ImageJ software (National Institue of Health, Bethesda, MD, USA) such that the whole image appeared dark. The same values of the window/level function were then applied to the remaining images of the same section. This ensured that only signal sufficiently stronger than the background brightness level appears in the images. The measurements for penetration depth were performed on the processed images. The penetration depths of rt-PA and plasminogen were measured using a line scan tool available in the software. An average of six measurements per image per section was used to evaluate penetration depth. Overlapping region of rt-PA and plasminogen in the images represents the clot lysis zone and the depth of this zone was measured from the surface of the clot. Images of the clot sections obtained for the following treatments were analyzed to evaluate the difference is penetration depths of rt-PA and plasminogen: (1) no rt-PA, Definity® or US treatment, (2) rt-PA alone treatment (no US or Definity®), (3) rt-PA, US (0.32 MPa), PBS infusions without Definity® treatment and (4) rt-PA, Definity® infusions and US (0.32 MPa) treatment.
Statistics
Correlation between mass loss, the energy in ultraharmonic bands, the energy in broadband bands, the energy in harmonic bands and fractional stable cavitation duration was evaluated statistically using the “corr” function in MATLAB. The comparison of mass loss for exposures to different combinations of rt-PA, US and Definity® was accomplished using a one-way ANOVA and two sample Student’s t-test using MINITAB (MINITAB Inc., State College, PA, USA) statistical analysis software. A two-sample Student’s t-test was performed on penetration depth measurements from the images of clot sections.
RESULTS
The change in the level of spectral power in ultraharmonic bands as function of increasing peak-to-peak pressure amplitude and their relative magnitude compared to spectral power in broadband bands is shown in Fig. 3. Each data point is an average of 60 measurements over 3 sample preparations and the error bars represent the standard deviation of the measurements. No significant difference between the levels of signal in ultraharmonic or broadband signals was observed for the pressure steps up to 0.21 MPa. As the acoustic pressure is increased to 0.32 MPa peak-to-peak in the next step, the amplitude of both broadband and ultraharmonic power bands increases but the increase in the ultraharmonic bands is significantly higher than the broadband energy. Thus, 0.32 MPa peak-to-peak pressure amplitude is interpreted as the onset of stable cavitation for this experimental set up. At pressure steps greater than 0.32 MPa, the level of ultraharmonic energy decreases.
An example of the effect of infusion of Definity® can be observed in Fig. 4. When Definity® was infused initially, the spectral power in ultraharmonic bands increased for approximately 2.5 min in the presence of pulsed US at peak-to-peak pressure amplitude of 0.32 MPa (Fig. 4a). At higher pressures initial infusion of Definity® enhanced the level of ultraharmonic emissions but for shorter durations (Fig. 4b and 4c). This information was used to select the frequency of intermittent infusions of Definity® (one infusion every 3 min) and pressure amplitude of 120 kHz US (0.32 MPa peak-to-peak) to sustain stable cavitation during the 30 min exposures. The effect of Definity® infusions on sustaining cavitation over a period of 30 min can be observed in Fig. 5. The peak-to-peak pressure amplitudes used for data plotted in Fig. 5 were 0.12 MPa, 0.21 MPa and 0.32 MPa. In Fig. 5a, ultraharmonic spectral power level in the presence of Definity® but without any detectable stable cavitation activity (0.12 MPa) is shown. Note that no enhancement in the ultraharmonic spectral power bands is observed. Fig. 5b shows ultraharmonic spectral power level at a higher pressure (0.21 MPa). Fig. 5c shows the cavitation activity without Definity® at a higher pressure amplitude (0.32 MPa) which is closer to the previously reported stable cavitation threshold of 0.40 MPa (Datta et al. 2006). Note that PBS was infused in this treatment every 3 min. An increase in ultraharmonic signal can be observed for the first 5 min after which subsequent stable cavitation activity subsided. However, in Fig. 5d when Definity® was infused intermittently every 3 min, the cavitation activity is sustained throughout the 30 min exposure duration.
Figure 4.
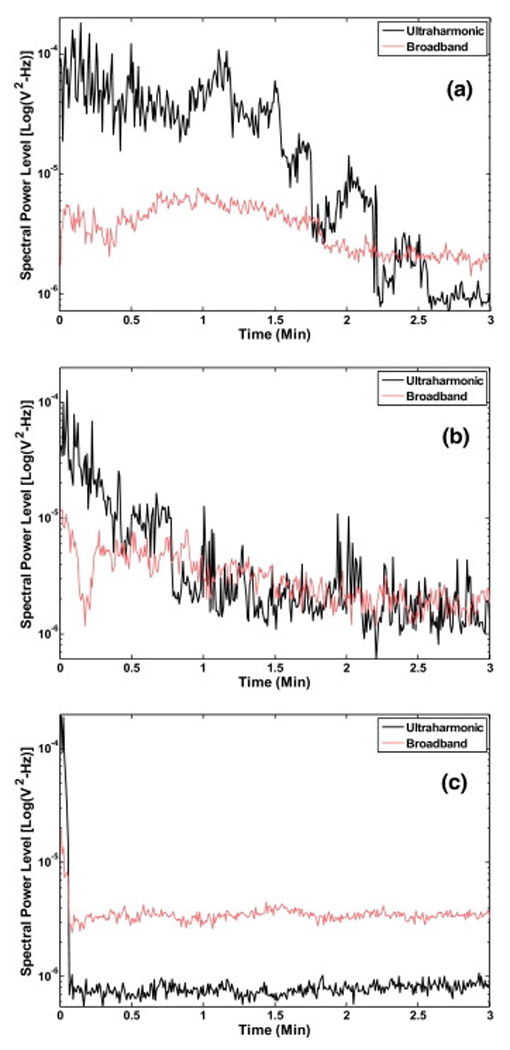
Representative ultraharmonic and broadband signal levels as function of time following a single infusion of Definity® with peak-to-peak US exposure of a) 0.32 MPa, b) 0.50 MPa and c) 0.75 MPa.
Figure 5.
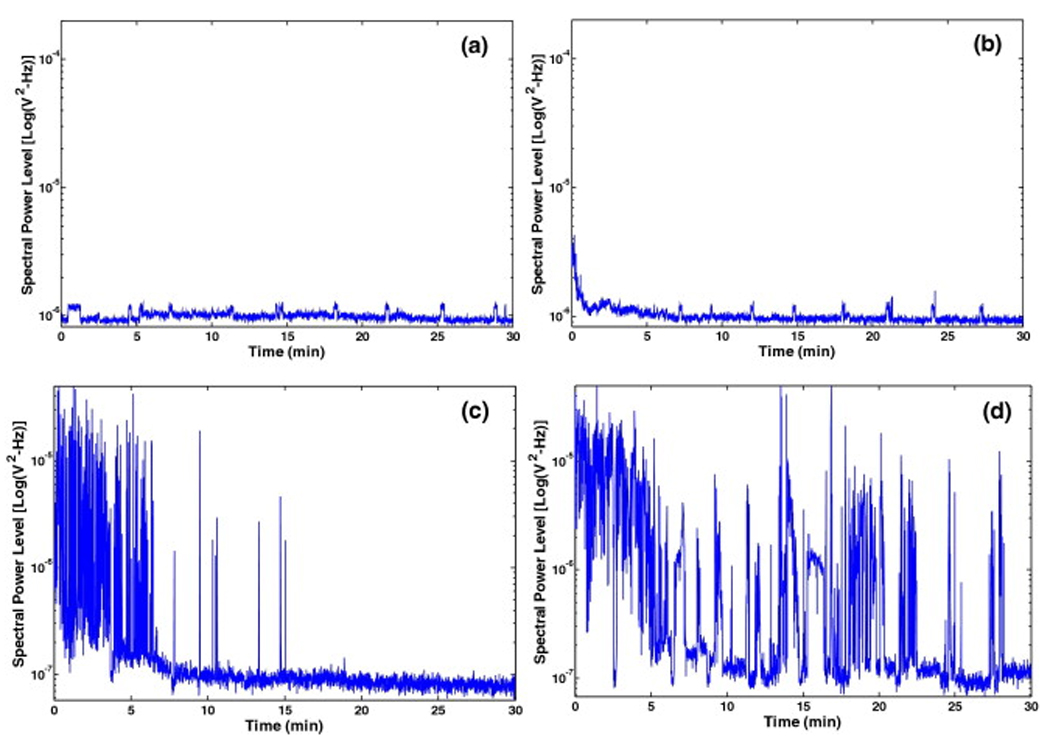
A representative example of the spectral power in the ultraharmonic band over the treatment duration; a) with Definity® infusion but no cavitation (0.12 MPa peak-to-peak), b) with Definity® infusion but no cavitation (0.21 MPa peak-to-peak), c) with infusion of PBS alone at a peak-to-peak pressure of 0.32 MPa (note only initial cavitation activity is observed) and d) with infusion of Definity® resulting in relatively sustained cavitation at the same peak-to-peak pressure (0.32 MPa).
The effect of Definity® on the enhancement of cavitation activity as measured by ultraharmonic energy and fractional stable cavitation duration is shown in Table 1. Infusion of Definity® increased the ultraharmonic energy from a mean value of 0.0162 V2 to 0.0482 V2 (p=0.046). The stable cavitation duration was also significantly increased from a mean of 10.1% to 20.8% (p=0.003). The effect of combinations of rt-PA at a concentration of 96 µg/ml, US and Definity® infusions with or without cavitation activity on clot mass loss is presented in Fig. 6. The greatest clot mass loss of 26.2% was observed for the combination of rt-PA, Definity® infusions and US treatment at the peak-to-peak pressure amplitude of 0.32 MPa (p=0.001). A significantly lower clot mass loss of 16.0% was observed for the same peak-to-peak pressure amplitude of 0.32 MPa in rt-PA, US, PBS infusions without Definity® treatment. The other rt-PA, Definity® infusions and US treatments at lower pressures (0.12 MPa and 0.21 MPa) resulted in a lower clot mass loss which was not significantly different from the rt-PA alone treatment (without US). Treatment with Definity® infusions and US without rt-PA at a pressure amplitude of 0.32 MPa resulted in a mean clot mass loss of 6.3% which is higher than control (No US, No Definity®, No rt-PA) but lower than rt-PA alone treatment.
Table 1.
Effect of contrast agent Definity® on enhancement of stable cavitation activity as measured by energy in the ultraharmonic signals and fractional stable cavitation duration. The p-value shown is for two sample Student’s t-test for a sample size of six for each treatment.
| PBS, rt-PA and US at 0.32 MPa |
Definity®, rt-PA and US at 0.32 MPa |
p-value | |
|---|---|---|---|
| Ultraharmonic Energy (V2) | 0.0162 ±0.0145 | 0.0482 ±0.031 | 0.046 |
| Fractional Stable Cavitation Duration (%) |
10.1 ±4.4 | 20.8 ±6.8 | 0.003 |
Figure 6.

Mass loss (%) as a function of peak-to-peak acoustic pressure for different treatments: A) No rt-PA, Definity® or US, which is the control treatment, B) rt-PA alone, C) rt-PA, Definity® infusions and US (0.12 MPa peak-to-peak pressure amplitude), D) rt-PA, Definity® infusions and US (0.21 MPa peak-to-peak pressure amplitude), E) Definity® infusions and US (0.32 MPa peak-to-peak pressure amplitude) without rt-PA treatment, F) rt-PA, PBS infusions without Definity® and US (0.32 MPa peak-to-peak pressure amplitude) and G) rt-PA, Definity® infusions, and US (0.32 MPa peak-to-peak pressure amplitude). A sample size of six was used for each treatment.
The correlation between the fractional stable cavitation duration and clot mass loss is shown in Fig. 7a and the correlation between ultraharmonic energy and clot mass loss is shown in Fig. 7b. The clot mass loss increased with both the fractional stable cavitation duration and ultraharmonic energy. Table 2 shows the values of correlation coefficients between the measured mass loss, ultraharmonic energy, broadband emissions, harmonic energy and stable cavitation duration for a sample size of 24. A statistically significant correlation of r=0.85 is observed between clot mass loss and ultraharmonic energy (p<0.0001). Also, there was a significant correlation of r=0.83 between stable cavitation duration and mass loss (p<0.0001). A relatively weaker correlation of r=0.51 with harmonic emissions was also observed (p=0.01).
Figure 7.

Mass loss (%) and cavitation activity relationship as a function of (a) fractional stable cavitation duration which is a fraction of the total time for which the ultraharmonic energy level was above the noise floor and (b) ultraharmonic energy integrated over a 30 min exposure. A sample size of six was used for each treatment and error bars represent standard deviation of the measurements.
Table 2.
Correlation coefficient (r) for measured acoustic emissions and mass loss. The p-value for correlation is shown in parenthesis and the statistically significant correlations are shown in bold. A combined sample size of 24 was used to evaluate correlation coefficients.
| Mass Loss |
Ultraharmonic Emissions |
Broadband Emissions |
Harmonic of Fundamental |
Fractional Stable Cavitation Duration |
|
|---|---|---|---|---|---|
| Mass Loss | 1 |
0.8549 (p<0.0001) |
0.0003 (p=1.0) |
0.5149 (p=0.01) |
0.8344 (p<0.0001) |
| Ultraharmonic Emissions |
1 | 0.0089 (p=0.97) |
0.3411 (p=0.10) |
0.8405 (p<0.0001) |
|
| Broadband Emissions |
1 | 0.0623 (p=0.77) |
−0.1867 (p=0.38) |
||
| Harmonic of Fundamental |
1 | 0.2871 (p=0.17) |
|||
| Fractional Stable Cavitation Duration |
1 |
Results of the dual antibody fluorescence imaging are shown in Fig. 8. The images in left column show rt-PA localization in green and the right column show localization of plasminogen in red. The scale bar in the images is 0.3 mm. Images in Fig. 8a shows the control treatment, Fig. 8b shows results for rt-PA alone treated clots, Fig. 8c shows US, rt-PA and saline treated clots and Fig. 8d shows US, rt-PA and Definity® treated clots. It can be qualitatively observed that rt-PA penetration is largest for the combined US, rt-PA and Definity® treatment. Width of the clot lysis zone can be observed by penetration depth of rt-PA in the images and accumulation of plasminogen in the same region, as measured from the surface of the clot using the line scan tool in the Spot Advanced software. The penetration depth measurements are shown in Table 3 for three clots processed for each treatment. Treatments with rt-PA, Definity® infusions and US exhibited the greatest mean rt-PA penetration of almost 222 µm which is statistically significantly greater than any other treatment (p=0.001). There was a greater variation of plasminogen penetration depth and the mean value for combined US, rt-PA and Definity® treatment was 241 µm but the mean was not statistically significantly greater than the rt-PA, US, PBS infusions without Definity® (p>0.05).
Figure 8.

Representative examples of fluorescent dual antibody stained images of clot sections. The left column images are stained green for rt-PA by fluorescien isothiocynate (FITC) conjugated secondary antibody. For the same section the right column images show accumulation of plasminogen stained red by Texas red (TRITC) conjugated secondary antibody. Representative clot section images are shown for a) no rt-PA, Definity® or US (the control treatment), b) rt-PA alone treatment, c) rt-PA, PBS infusions and US (0.32 MPa peak-to-peak amplitude) treatment and d) rt-PA, Definity® infusions and US (0.32 MPa peak-to-peak amplitude) treatment.
Table 3.
Penetration depth of rt-PA and plasminogen measured from the surface of the clot. Measurements were made on dual antibody stained clot sections for each case. The data shown here is mean ± standard deviation for measurements done on sections obtained from three clots for each treatments and 18 measurements of penetration depth made for each section. The peak to peak pressure amplitude for US was 0.32 MPa.
| Treatment | rt-PA penetration depth (µm) |
Plasminogen penetration depth (µm) |
|---|---|---|
| Control | 15.2 ±7.5 | 64.2 ±51.5 |
| rt-PA alone | 22.0 ±7.8 | 65.2 ±36.2 |
| rt-PA, US, PBS infusions without Definity® |
52.5 ±21.5 | 149.9 ±56.9 |
| rt-PA, Definity® infusions and US |
221.8 ±54.9 | 240.9 ±102.8 |
The effect of infusions of Definity® at lower rt-PA concentrations on clot mass loss can be observed in Fig. 9. At the lowest rt-PA concentration of 1.4 µg/ml, thrombolysis by rt-PA alone dropped to a mean value of 7.9%. The use of Definity® at this concentration still enhanced thrombolysis significantly (p<0.001).
Figure 9.

Effect of Definity® on clot mass loss as a function of rt-PA concentration. The peak-to-peak pressure amplitude used in all US treatments was 0.32 MPa. A significant enhancement over rt-PA alone treatment can be observed at lowest concentration.
DISCUSSION
A strategy for the use of contrast agent microbubbles along with US and thrombolytics was explored in this work. A simultaneous monitoring of cavitation activity could help optimize therapeutic benefits of US-enhanced thrombolysis. The results suggest an increase in stable cavitation activity resulted in a corresponding increase in clot mass loss. In the present work, simultaneous measurement of microbubble-enhanced cavitation activity showed a statistically significant correlation between ultraharmonic signals and mass loss. Earlier Porter et al. (1996) observed thrombolytic enhancement in vitro using perfluorocarbon-exposed sonicated dextrose albumin microbubbles together with 20-kHz US (0.845 MPa peak negative pressure amplitude) and urokinase. Along the same lines, Mizushige et al. (1999) compared different contrast agents used with rt-PA and catheter-based 10-MHz US. They reported a correlation between the persistence of microbubbles during the US exposure and thrombolysis in their in vitro experiments. Several other in vitro studies have since shown US-assisted thrombolysis with and without rt-PA in the presence of microbubbles and have suggested cavitation-related phenomena are responsible for this effect (Porter et al. 2001, Nedelmann et al. 2002, Cintas et al. 2004). Nedelmann et al. (2005) further demonstrated that US-induced blood clot dissolution without a thrombolytic drug is more effective at 20 kHz when compared to 40 or 60 kHz using the same acoustic intensity (0.2 W/cm2). These studies have already demonstrated a potential therapeutic use of microbubbles in breaking up blood clots mediated possibly by cavitation activity. In an important contrast to present study, no direct or indirect measurement of cavitation activity was reported in any of the studies mentioned above. The results of the present study demonstrate that a microbubble infusion was effective in sustaining stable cavitation activity and this treatment protocol resulted in the highest mass loss. It is important to note that fully retracted clots (3–14 d old) were employed in this study. These clots tend to be more resistant to lysis than newly formed clots (Holland et al. 2002, 2007).
Microbubbles and US have already been successfully used to augment the recanalization of vessels occluded by small clots in an in vivo rabbit iliofemoral artery clot model without the use of lytic agents such as rt-PA (Birnbaum et al. 1998). In a canine coronary artery thrombus model, transcutaneous 27-kHz US along with rt-PA demonstrated significant recanalization (Siegel et al. 2000). Microbubble potentiation of thrombolysis in intracranial arteries was demonstrated in a porcine model by Culp et al. (2003) using 1-MHz US. These results were repeated in other arteriovenous graft thrombi models in canines (Xie et al. 2005) and in a porcine ascending pharyngeal artery model (Culp et al. 2004) using platelet-targeted microbubbles. The authors in these studies attributed this enhancement to cavitation activity and suggested a possible additive effect when used with a thrombolytic such as rt-PA. In contrast to these in vivo studies a significant observation in our in vitro study is that Definity® infusions in the presence of US but without rt-PA did not result in significantly higher mass loss. An explanation of this enhancement in vivo could be attributed to the presence of a sufficient quantity of endogenous tPA and its synergistic effect in the presence of US. We propose that this endogenous tPA together with the cavitation activity nucleated by a contrast agent may have been sufficient to cause enough thrombolysis to result in recanalization.
In human clinical trials Alexandrov et al. (2004a, b) demonstrated improved arterial recanalization and improved clinical outcomes with the use of 2-MHz transcranial Doppler and rt-PA. Molina et al. (2006) added Livovist™ microbubbles to the transcranial Doppler and rt-PA treatment and reported further thrombolytic enhancement. However, Daffertshofer et al. (2005) employed a low frequency broad beam 300-kHz therapeutic device in clinical trials and observed a significant increase in intracranial hemorrhage and the study was stopped prematurely. The authors pursued the study of bioeffects in a rat model and reported no deleterious effects as evaluated by histopathological evaluation of brain and temperature measurements (Fatar et al. 2006). These studies highlight the importance of in vitro and in vivo studies aimed at understanding the potential adverse bioeffects of US-assisted thrombolysis while optimizing US parameters to maximize thrombolysis. Monitoring the stable cavitation activity as demonstrated in this study could possibly be extended to an in vivo setting to have better control on therapy.
Several mechanistic in vitro studies have been conducted to investigate the interaction of US with thrombolytic drugs (Francis et al. 1992, Blinc et al. 1993, Francis 1995, Suchkova et al. 1998, Akiyama et al. 1998, Behrens et al. 1999, Everbach et al. 2000, Holland et al. 2007). Some of these studies have shown that US potentiation of fibrinolysis is related to increased transport of reactants through cavitation-related mechanisms. Our dual antibody staining results provide experimental evidence of a significantly broader lysis zone observed in the presence of sustained stable cavitation. A similar result was reported in an earlier study employing a similar immunohistochemistry technique but without any detection of cavitation (Devcic-Kuhar et al. 2004). The rt-PA penetration depth reported in the study (21.2 ±7.2 µm) is comparable to our rt-PA, US, PBS infusions without Definity® treatment (52.5 ±21.5 µm). In our study the rt-PA penetration depth in the presence of stable cavitation activity increased to almost 222 ±55 µm.
Onundarson et al. (1992) reported saturation in thrombolysis for rt-PA concentrations greater than 5 µg/ml in human whole blood clots. A similar value of 3 µg/ml was reported by Trusen et al (1998). In our study we observed a significant thrombolytic enhancement at an rt-PA concentration as low as 1.4 µg/ml in the presence of stable cavitation activity. The use of microbubbles at such low concentration of rt-PA was sufficient to enhance thrombolysis significantly compared to treatment with rt-PA alone. This demonstrates a possibility of lowering the rt-PA dose and thus lowering the hemorrhagic risk associated with the use of thrombolytics.
In our previous study, Datta et al. (2006) demonstrated that the largest increase in clot mass loss was achieved in the presence of stable cavitation and showed that inertial cavitation activity decreased thrombolytic efficacy. The presence of inertial cavitation could have served as a limiter of sustained stable cavitation. In the present study cavitation activity was measured and correlated significantly with the enhancement of thrombolysis. It is also important to note that for treatments with rt-PA, Definity® infusions at lower US peak to peak pressures (0.12 and 0.21 MPa) did not cause any enhancement of thrombolysis over rt-PA alone treatment in the absence of ultraharmonic signals.
This study demonstrates an approach to nucleate stable cavitation with a contrast agent for therapeutic benefit. The serial bolus injection protocol used in this study does not allow for detailed knowledge of the concentration of acoustically activated microbubbles around the clot. Thus, a limitation of the study is that the relationship between density of cavitation nuclei (i.e. the contrast agent) and the number of activated microbubbles is unknown. In addition, the specific effects of microbubble aggregation due to secondary Bjerknes forces, acoustic radiation forces, microbubble coalescence and fluid mixing due to streaming were not investigated and could all contribute to the enhanced thrombolytic efficacy.
CONCLUSIONS
Stable cavitation activity can be sustained using an intermittent infusion of a commercial contrast agent, Definity®. Ultraharmonic emissions can be used to monitor and measure cavitation activity and such signals are significantly correlated with increased clot mass loss. Treatments with Definity® infusion along with rt-PA and US below any detectable cavitation activity did not result in any increase in mass loss as compared to rt-PA alone treatment. An increased penetration of rt-PA and plasminogen was also observed in clots exposed to stable cavitation nucleated by Definity®. The synergistic effect of sustained cavitation activity was also observed at a significantly lower concentration of rt-PA. Ultraharmonic emissions could potentially be used to monitor thrombolytic efficacy during treatment and further studies are still warranted to develop in vivo cavitation detection techniques.
ACKNOWLEDGEMENTS
This research was supported by the National Institutes of Health; grant number NIH/NINDS R01-NS047603. We gratefully acknowledge the assistance of Drs. George Shaw and Jason Meunier for the human whole blood clot model and valuable discussions. We also acknowledge assistance of Stella Nicolaou and Sampada Vaidya for developing the fluorescent imaging technique.
Footnotes
Publisher's Disclaimer: This is a PDF file of an unedited manuscript that has been accepted for publication. As a service to our customers we are providing this early version of the manuscript. The manuscript will undergo copyediting, typesetting, and review of the resulting proof before it is published in its final citable form. Please note that during the production process errors may be discovered which could affect the content, and all legal disclaimers that apply to the journal pertain.
REFERENCES
- Akiyama M, Ishibashi T, Yamada T, Furuhata H. Low –frequency ultrasound penetrates the cranium and enhances thrombolysis in vitro. Neurosurgery. 1998;43:828–833. doi: 10.1097/00006123-199810000-00062. [DOI] [PubMed] [Google Scholar]
- Alexandrov AV, Molina CA, Grotta JC, Garmi Z, Ford SR, Alvarez-Sabin J, Montaner J, Saqqur M, Demchuk AM, Moye LA, Hill MD, Wojner AW. Ultrasound-Enhanced Systemic Thrombolysis for Acute Ischemic Stroke. N. Engl. J. of Med. 2004;351(21):2170–2178. doi: 10.1056/NEJMoa041175. [DOI] [PubMed] [Google Scholar]
- Alexandrov AV, Demchuk AM, Burgin WS, Robinson DJ, Grotta JC. Ultrasound-enhanced thrombolysis for acute ischemic stroke: Phase I. Findings of the CLOTBUST trial. J. of Neuroimaging. 2004;14(2):113–117. [PubMed] [Google Scholar]
- Behrens S, Daffertshofer M, Spiegel D, Hennerici M. Low-frequency, low-intensity ultrasound accelerates thrombolisis through the skull. Ultrasound Med Biol. 1999;25:269–273. doi: 10.1016/s0301-5629(98)00158-6. [DOI] [PubMed] [Google Scholar]
- Birnbaum Y, Luo H, Nagai T, Fishbein MC, Peterson TM, Li S, Kricsfeld D, Porter TR, Siegel RJ. Noninvasive in vivo clot dissolution without a thrombolytic drug: Recanalization of thrombosed iliofemoral arteries by transcutaneous ultrasound combined with intravenous infusion of microbubbles. Circulation. 1998;97:130–134. doi: 10.1161/01.cir.97.2.130. [DOI] [PubMed] [Google Scholar]
- Blinc A, Keber D, Lahajnar G, Stegnar M, Zidansek A, Demsar F. Lysing patterns of retracted blood-clots with diffusion or bulk flow transport of plasma with urokinase into clots – a magnetic-resonance-imaging study in vitro. Thromb Haemost. 1992;68:667–671. [PubMed] [Google Scholar]
- Blinc A, Francis CW, Trudnowski JL, Carstensen EL. Characterization of ultrasound-potentiated fibrinolysis in vitro. Blood. 1993;81:2636–2643. [PubMed] [Google Scholar]
- Broderick JP, Hacke W. Treatment of acute ischemic stroke- Part I: Recanalization Strategies. Circulation. 2002;106(12):1563–1569. doi: 10.1161/01.cir.0000030406.47365.26. [DOI] [PubMed] [Google Scholar]
- Coussios C-C, Holland CK, Shaw GJ. Transmission of a large unfocussed 120-kHz and 1-MHz ultrasound beam through the human skull. J Acoust Soc Am. 2002;112:2433. [Google Scholar]
- Cintas P, Nguyen F, Boneu B, Larrue V. Enhancement of enzymatic fibrinolysis with 2-MHz ultrasound and microbubbles. Journal of Thrombosis and Haemostasis. 2004;2:1163–1166. doi: 10.1111/j.1538-7836.2004.00746.x. [DOI] [PubMed] [Google Scholar]
- Culp WC, Erdem E, Roberson PK, Husain MM. Microbubble Potentiated Ultrasound as a Method of Stroke Therapy in a Pig Model: Preliminary Findings. Journal of Vascular and Interventional Radiology. 2003;14:1433–1436. doi: 10.1097/01.rvi.0000096767.47047.fa. [DOI] [PubMed] [Google Scholar]
- Culp WC, Porter TR, Lowery J, Xie F, Roberson PK, Marky L. Intracranial clot lysis with intravenous microbubbles and transcranial ultrasound in swine. Stroke. 2004;35:2407–2411. doi: 10.1161/01.STR.0000140890.86779.79. [DOI] [PubMed] [Google Scholar]
- Daffertshofer M, Gass A, Ringleb P, Sitzer M, Sliwka U, Els T, Sedlaczek O, Koroshetz WJ, Hennerici MG. Transcranial low-frequency ultrasound-mediated thrombolysis in brain ischemia: Increased risk of hemorrhage with combined ultrasound and tissue plasminogen activator - Results of a phase II clinical trial. Stroke. 2005;36:1441–1446. doi: 10.1161/01.STR.0000170707.86793.1a. [DOI] [PubMed] [Google Scholar]
- Datta S, McAdory LE, Tan J, Holland CK. Cavitation detection during ultrasound-assisted thrombolysis in porcine blood clots. J Acoust. Soc. Am. 2005;117:2558. [Google Scholar]
- Datta S, Coussios C-C, McAdory LE, Tan J, Porter T, de Courten-Myers G, Holland CK. Correlation of cavitation with ultrasound enhancement of thrombolysis. Ultrasound in Medicine and Biology. 2006;32:1257–1267. doi: 10.1016/j.ultrasmedbio.2006.04.008. [DOI] [PMC free article] [PubMed] [Google Scholar]
- Devcic-Kuhar B, Pfaffenberger S, Gherardini L, Mayer C, Groschl M, Kaun C, Benes E, Tschachler E, Huber K, Maurer G, Wojta J, Gottsauner-Wolf M. Ultrasound affects distribution of plasminogen and tissue-type plasminogen activator in whole blood clots in vitro. Thrombosis and Haemostasis. 2004;92:980–985. doi: 10.1160/TH04-02-0119. [DOI] [PubMed] [Google Scholar]
- Diamond SL, Anand S. Inner clot diffusion and permeation during fibrinolysis. Biophysical J. 1993;65:2622–2643. doi: 10.1016/S0006-3495(93)81314-6. [DOI] [PMC free article] [PubMed] [Google Scholar]
- Everbach EC, Francis CW. Cavitational mechanisms in ultrasound-accelerated thrombolysis at 1 MHz. Ultrasound Med Biol. 2000;26:1153–1160. doi: 10.1016/s0301-5629(00)00250-7. [DOI] [PubMed] [Google Scholar]
- Fatar M, Stroick M, Griebe M, Alonso A, Hennerici MG, Daffertshofer M. Brain temperature during 340-kHz pulsed ultrasound insonation: A safety study for sonothrombolysis. Stroke. 2006;37:1883–1887. doi: 10.1161/01.STR.0000226737.47319.aa. [DOI] [PubMed] [Google Scholar]
- Francis CW, Onundarson PT, Carstensen EL, Blinc A, Meltzer RS, Schwarz K, Marder VJ. Enhancement of fibrinolysis in vitro by ultrasound. J. Clin Invest. 1992;90:2063–2068. doi: 10.1172/JCI116088. [DOI] [PMC free article] [PubMed] [Google Scholar]
- Francis CW, Blinc A, Lee S, Cox C. Ultrasound accelerates of recombinant tissue plasminogen activator into clots. Ultrasound Med Biol. 1995;21:419–424. doi: 10.1016/0301-5629(94)00119-x. [DOI] [PubMed] [Google Scholar]
- Holland CK, Vaidya SS, Coussios C-C, Shaw GJ. Thrombolytic effects of 120-kHz and 1-MHz ultrasound and tissue plasminogen activator on porcine whole blood clots. J Acoust. Soc. Am. 2002;112:2370. [Google Scholar]
- Holland CK, Vaidya SS, Datta S, Coussios C-C, Shaw GJ. Ultrasound-enhanced tissue plasminogen activator thrombolysis in an in vitro porcine clot model. Thromb. Res. 2007 doi: 10.1016/j.thromres.2007.07.006. in review. [DOI] [PMC free article] [PubMed] [Google Scholar]
- Lauer CG, Burge R, Tang DB, Bass BG, Gomez ER, Alving BM. Effect of ultrasound on tissue-type plasminogen activator-induced thrombolysis. Circulation. 1992;86:1257–1264. doi: 10.1161/01.cir.86.4.1257. [DOI] [PubMed] [Google Scholar]
- Mizushige K, Kondo I, Ohmori K, Hirao K, Matsuo H. Enhancement of ultrasound-accelerated thrombolysis by echo contrast agents: Dependence on microbubble structure. Ultrasound in Medicine and Biology. 1999;25:1431–1437. doi: 10.1016/s0301-5629(99)00095-2. [DOI] [PubMed] [Google Scholar]
- Molina CA, Ribo M, Rubiera M, Montaner J, Santamarina E, Delgado-Mederos R, Arenillas JF, Huertas R, Purroy F, Delgado P, Alvarez-Sabin J. Microbubble administration accelerates clot lysis during continuous 2-MHz ultrasound monitoring in stroke patients treated with intravenous tissue plasminogen activator. Stroke. 2006;37:425–429. doi: 10.1161/01.STR.0000199064.94588.39. [DOI] [PubMed] [Google Scholar]
- The National Institute of Neurological Disorders and Stroke rt-PA Stroke Study Group. Tissue Plasminogen Activator for Acute Ischemic Stroke. N Engl J Med. 1995;333:1581–1588. doi: 10.1056/NEJM199512143332401. [DOI] [PubMed] [Google Scholar]
- Nedelmann M, Eicke BM, Lierke EG, Heimann A, Kempski O, Hopf HC. Low-frequency ultrasound induces nonenzymatic thrombolysis in vitro. Journal of Ultrasound in Medicine. 2002;21:649–656. doi: 10.7863/jum.2002.21.6.649. [DOI] [PubMed] [Google Scholar]
- Nedelmann M, Brandt C, Schneider F, Eicke BM, Kempski O, Krummernauer F, Dieterich M. Ultrasound-induced blood clot dissolution without a thrombolytic drug is more effective with lower frequencies. Cerebrovascular Diseases. 2005;20:18–22. doi: 10.1159/000086122. [DOI] [PubMed] [Google Scholar]
- Onundarson PT, Francis CW, Marder VJ. Depletion of plasminogen in vitro or during thrombolytic therapy limits fibrinolytic potential. Journal of Laboratory and Clinical Medicine. 1992;120:120–128. [PubMed] [Google Scholar]
- Pieters M, Hekkenberg RT, Barrett-Bergshoeff M, Rijken DC. The effect of 40 kHz ultrasound on tissue plasminogen activator-induced clot lysis in three in vitro models. Ultrasound Med. Biol. 2004;30:1545–1552. doi: 10.1016/j.ultrasmedbio.2004.08.028. [DOI] [PubMed] [Google Scholar]
- Porter TR, LeVeen RF, Fox R, Kricsfeld A, Xie F. Thrombolytic enhancement with perfluorocarbon-exposed sonicated dextrose albumin microbubbles. American Heart Journal. 1996;132:964–968. doi: 10.1016/s0002-8703(96)90006-x. [DOI] [PubMed] [Google Scholar]
- Porter TR, Kricsfeld D, Lof J, Everbach EC, Xie F. Effectiveness of transcranial and transthoracic ultrasound and microbubbles in dissolving intravascular thrombi. Journal of Ultrasound in Medicine. 2001;20:1313–1325. doi: 10.7863/jum.2001.20.12.1313. [DOI] [PubMed] [Google Scholar]
- Prokop AF, Soltani A, Roy RA. Cavitational Mechanisms in Ultrasound-Accelerated Fibrinolysis. Ultrasound in Medicine and Biology. 2007;33:924–933. doi: 10.1016/j.ultrasmedbio.2006.11.022. [DOI] [PubMed] [Google Scholar]
- Sakharov DV, Hekkenberg RT, Rijken DC. Acceleration of fibrinolysis by high frequency ultrasound: The contribution of acoustic streaming and temperature rise. Thromb. Res. 2000;100:333–340. doi: 10.1016/s0049-3848(00)00319-4. [DOI] [PubMed] [Google Scholar]
- Shaw GJ, Bavani N, Dhamija A, Lindsell CJ. Effect of mild hypothermia on the thrombolytic efficacy of 120 kHz ultrasound enhanced thrombolysis in an in-vitro human clot model. Thromb Res. 2006;117:603–608. doi: 10.1016/j.thromres.2005.05.005. [DOI] [PubMed] [Google Scholar]
- Siegel RJ, Atar S, Fishbein MC, Brasch AV, Peterson TM, Nagai T, Pal D, Nishioka T, Chae JS, Birnbaum Y, Zanelli C, Luo H. Noninvasive, transthoracic, low-frequency ultrasound augments thrombolysis in a canine model of acute myocardial infarction. Circulation. 2000;101:2026–2029. doi: 10.1161/01.cir.101.17.2026. [DOI] [PubMed] [Google Scholar]
- Suchkova V, Siddiqi FN, Carstensen EL, Dalecki D, Child S, Francis CW. Enhancement of fibrinolysis with 40 kHz ultrasound. Circulation. 1998;98:1030–1035. doi: 10.1161/01.cir.98.10.1030. [DOI] [PubMed] [Google Scholar]
- Tachibana K, Tachibana S. Albumin microbubble echo-contrast material as an enhancer for ultrasound accelerated thrombolysis. Circulation. 1995;92:1148–1150. doi: 10.1161/01.cir.92.5.1148. [DOI] [PubMed] [Google Scholar]
- Trusen B, Ries M, Zenker M, Rauh M, Beinder E, Keuper H, Harms D. Whole blood clot lysis in newborns and adults after adding different concentrations of recombinant tissue plasminogen activator (rt-PA) Seminars in Thrombosis and Hemostasis. 1998;24:599–604. doi: 10.1055/s-2007-996060. [DOI] [PubMed] [Google Scholar]
- Xie F, Tsutsui JM, Lof J, Unger EC, Johanning J, Culp WC, Matsunaga T, Porter TR. Effectiveness of lipid microbubbles and ultrasound in declotting thrombosis. Ultrasound in Medicine and Biology. 2005;31:979–985. doi: 10.1016/j.ultrasmedbio.2005.03.008. [DOI] [PubMed] [Google Scholar]