

Abstract
Glucagon-like peptide-1 augments nutrient-stimulated insulin secretion. Chow-fed mice lacking the glucagon-like peptide-1 receptor (Glp1r) exhibit enhanced insulin-stimulated muscle glucose uptake but impaired suppression of endogenous glucose appearance (endoRa). This proposes a novel role for the Glp1r to regulate the balance of glucose disposal in muscle and liver by modulating insulin action. Whether this is maintained in an insulin-resistant state is unknown. The present studies tested the hypothesis that disruption of Glp1r expression overcomes high-fat (HF) diet-induced muscle insulin resistance and exacerbates HF diet-induced hepatic insulin resistance. Mice with a functional disruption of the Glp1r (Glp1r−/−) were compared with wild-type littermates (Glp1r+/+) after12 wk on a regular chow diet or a HF diet. Arterial and venous catheters were implanted for sampling and infusions. Hyperinsulinemic-euglycemic clamps were performed on weight-matched male mice. [3-3H]glucose was used to determine glucose turnover, and 2[14C]deoxyglucose was used to measure the glucose metabolic index, an indicator of glucose uptake. Glp1r−/− mice exhibited increased glucose disappearance and muscle glucose metabolic index on either diet. This was associated with enhanced activation of muscle Akt and AMP-activated protein kinase and reduced muscle triglycerides in HF-fed Glp1r−/− mice. Chow-fed Glp1r−/− mice exhibited impaired suppression of endoRa and hepatic insulin signaling. In contrast, HF-fed Glp1r−/− mice exhibited improved suppression of endoRa and hepatic Akt activation. This was associated with decreased hepatic triglycerides and impaired activation of sterol regulatory element-binding protein-1. These results show that mice lacking the Glp1r are protected from HF diet-induced muscle and hepatic insulin resistance independent of effects on total fat mass.
Mice lacking the glucagon-like peptide-1 receptor are protected from high-fat diet-induced insulin resistance independent of effects on body weight.
Glucagon-like peptide-1 (Glp1) and glucose-dependent insulinotropic polypeptide (Gip) are gut-derived peptides that enhance the secretion of insulin after nutrient intake. This incretin effect is mediated via activation of distinct receptors for Glp1 (Glp1r) and Gip (Gipr) expressed in pancreatic β-cells. The Glp1r and Gipr are also expressed in lungs, kidneys, heart, adipose tissue, and the central and peripheral nervous systems (1,2,3,4). Glp1, but not Gip, also inhibits glucagon secretion and delays gastric emptying (5,6,7,8), thereby diminishing glucose excursions after a meal.
Using the hyperinsulinemic-euglycemic clamp, or insulin clamp, we have demonstrated that the Glp1r and the Gipr also regulate insulin action. Double-incretin receptor knockout (DIRKO) mice, which lack expression of the Glp1r and the Gipr, exhibit enhanced whole-body insulin action (9). This was observed in mice fed a chow diet or a high-fat (HF) diet, the latter used to precipitate insulin resistance (10,11,12). DIRKO mice are also protected from HF diet-induced obesity (9). This is due, at least in part, to the loss of Gipr expression, which has been shown to reduce weight gain and fat mass in genetic, dietary, and aging models of obesity (13,14,15,16,17). Thus, the lack of Gipr action in DIRKO mice is protective against HF diet-induced obesity, resulting in enhanced insulin action.
We recently showed that the loss of Glp1r expression also contributes to the enhanced insulin action observed in chow-fed DIRKO mice (18). Under euglycemic conditions, insulin-stimulated muscle glucose uptake (MGU) is enhanced in chow-fed Glp1r knockout (Glp1r−/−) mice. In light of this finding, it is paradoxical that suppression of endogenous glucose appearance (endoRa) by insulin is impaired in Glp1r−/− mice (18). This suggests a role for the Glp1r to regulate the balance of glucose disposal between the liver and muscle by modulating insulin action in these tissues.
Whether the Glp1r plays a role in regulating insulin action within the context of an insulin-resistant state is not known. Chronic (4 wk) inhibition of the Glp1r expressed in the brain via intracerebroventricular (icv) infusion of the Glp1r antagonist exendin 9-39 reduces fasting insulin and glucose and improves ip glucose tolerance in mice fed a carbohydrate-free HF diet (19). However, the impact of this Glp1r blockade on hepatic and muscle insulin action was not addressed. In the present studies, the hypothesis that disruption of Glp1r expression overcomes the muscle insulin resistance associated with HF feeding was tested. We further hypothesized that disruption of Glp1r expression would further exacerbate the impaired hepatic insulin action associated with HF feeding.
Materials and Methods
Mouse maintenance and genotyping
All procedures performed were approved by the Vanderbilt University Animal Care and Use Committee. At 3 wk of age, wild-type (Glp1r+/+) and Glp1r knockout (Glp1r−/−) littermates on a C57BL/6 background were separated by sex and placed on either a chow diet (Purina 5001; Purina Mills, St. Louis, MO) composed of 13, 58, and 28 kcal/g of fat, carbohydrate, and protein, respectively, or a HF diet (no. F3282; BioServ, Frenchtown, NJ) composed of 60, 24 and 16 kcal/g of fat, carbohydrate and protein, respectively. Genotyping was performed by PCR on genomic DNA obtained from tail biopsies. All experiments were performed on mice at about 4 months of age. Lean mass and fat mass were determined on 5 h-fasted mice using a mq10 NMR analyzer (Bruker Optics, Billerica, MA). Mice were maintained on a standard light-dark cycle (0600–1800 h light).
Surgical procedures
Only male mice were used for studies. Catheters were implanted in the left common carotid artery and right jugular vein for sampling and infusions, respectively, as previously described (12,20,21), except that surgeries were performed under inhaled isoflurane anesthesia (VetEquip, Pleasanton, CA). Animals were individually housed after surgery and allowed to recover for 5–7 d, during which time body weight was recorded daily. Mice that did not return to within 15% of presurgery weight or lost catheter patency were excluded from insulin clamp studies. Across both genotypes and diets, approximately 35% of mice initially selected for the studies did not undergo the clamp procedure due to these exclusion criteria or loss during surgery.
Hyperinsulinemic-euglycemic clamps
After 5 d of recovery, insulin clamps were performed on 5 h-fasted mice (9,12,18,20). A 5-μCi bolus of [3-3H]glucose was given at t = −90 min before insulin infusion, followed by a 0.05-μCi · min−1 infusion for 90 min. Blood samples were obtained via the arterial catheter (9,12,18,20). Basal glucose-specific activity was determined from blood samples at t = −15 and −5 min. Fasting glucagon levels were determined from blood samples taken at t = −15 min. Fasting insulin and nonesterified fatty acid (NEFA) levels were determined from blood samples taken at t = −5 min. The clamp was begun at t = 0 min with a continuous infusion of human insulin (4 mU · kg−1 · min−1, Humulin R; Eli Lilly, Indianapolis, IN). The [3-3H]glucose infusion was increased to 0.15 μCi · min−1 for the remainder of the experiment. Euglycemia (∼8.5 mmol · liter−1) was maintained by measuring blood glucose every 10 min (∼1 μl of blood per sample) starting at t = 0 min and infusing 50% dextrose as necessary. Mice received saline-washed erythrocytes from donors beginning at t = 0 min and continuously throughout the clamp at a rate of 5.5 μl · min−1 to prevent a fall of greater than 5% hematocrit. A 12-μCi bolus of 2[14C]deoxyglucose (2[14C]DG) was given at t = 120 min. Blood samples were taken every 10 min from t = 80 to 135 min (50 μl at every time point except at t = 120 min when 240 μl was taken) and processed to determine plasma [3-3H]glucose and 2[14C]DG. Clamp insulin, NEFAs, and glucagon levels were determined at t = 120 min. At t = 135 min, mice were anesthetized with sodium pentobarbital. The gastrocnemius, superficial vastus lateralis, liver, diaphragm, heart, and brain were excised, immediately frozen, and stored at −80 C until analyzed.
Processing of plasma and tissue samples
Plasma insulin was determined by ELISA (Millipore, Bedford, MA). NEFAs were measured spectrophotometrically by an enzymatic colorimetric assay (Wako NEFA HR(2) kit; Wako Chemicals, Richmond, VA). Plasma glucagon levels were determined by RIA by the Vanderbilt-National Institutes of Health Mouse Metabolic Phenotyping Center Hormone Assay and Analytical Resources Core. Plasma [3-3H]glucose and 2[14C]DG were determined from deproteinized samples as previously described (9,12). Tissue 2[14C]DG-6-phosphate (2[14C]DGP) radioactivity was determined as previously described (9,12). Briefly, tissues were homogenized in 0.5% perchloric acid and homogenates were centrifuged and neutralized with KOH. One aliquot was counted directly to determine 2[14C]DG and 2[14C]DGP radioactivity. A second aliquot was treated with Ba(OH)2 and ZnSO4 to remove 2[14C]DGP and any tracer incorporated into glycogen, and then it was counted to determine 2[14C]DG radioactivity. 2[14C]DGP is the difference between the two aliquots. The accumulation of 2[14C]DGP was normalized to tissue weight. Liver and gastrocnemius glycogen was determined by the method of Chan and Exton (22). Liver and muscle triglyceride levels were measured spectrophotometrically by an enzymatic colorimetric assay (Abcam, Cambridge, MA).
Protein immunoblots
For whole-cell extracts, liver and muscle tissue (40–80 mg) was homogenized in 10 μl · mg−1 tissue extraction buffer (50 mm Tris; 1 mm EDTA; 1 mm EGTA; 10% glycerol; 1% Triton X-100, pH 7.5) supplemented with protease (Pierce, Rockford, IL) and phosphatase (Sigma, St. Louis, MO) inhibitor cocktails. Homogenates were centrifuged (20 min, 4500 × g, 4 C), pellets were discarded, and supernatants were retained for protein determination. Liver nuclear extracts were obtained using a nuclear extract isolation kit (Pierce) according to the manufacturer’s instructions. Protein content was determined using a bicinchoninic acid protein assay kit (Bio-Rad Laboratories, Hercules, CA). Whole-cell (20–100 μg) and nuclear (20 μg) extracts were separated on 10% Bis-Tris SDS-PAGE gels (Invitrogen, Carlsbad, CA), followed by electrophoretic transfer to polyvinyl difluoride membranes. Primary antibodies were incubated with the membranes overnight at 4 C. Secondary antibodies were incubated at room temperature for 1 h. Imaging and densitometry were performed using the Odyssey imaging system (LI-COR, Lincoln, NE). Antibodies for Akt, phosphorylated Akt (Ser473), AMP-activated protein kinase (AMPK), and phosphorylated AMPK (Thr172) were from Cell Signaling (Beverly, MA). Antibody for glyceraldehyde-3-phosphate dehydrogenase (GAPDH) was from Abcam. Antibodies for the nuclear form of sterol regulatory element-binding protein (SREBP)-1 and YY1 were a generous gift from Dr. T. Osborne (Sanford-Burnham Medical Research Institute).
Calculations
Whole-body glucose appearance and disappearance (Rd) were determined using Steele non-steady-state equations (23,24). The endoRa was determined by subtracting the glucose infusion rate (GIR) from total glucose appearance. Glucose metabolic index (Rg) was calculated as previously described (25,26) using the following equation: Rg = (2[14C]DGPtissue/AUC 2[14C]DGplasma) * [arterial glucose], where 2[14C]DGPtissue is the 2[14C]DGP radioactivity in the tissue (in disintegrations per minute per gram), AUC 2[14C]DGplasma is the area under the plasma 2[14C]DG disappearance curve (in disintegrations per minute per minute per milliliter), and arterial glucose is the average arterial plasma glucose (in millimoles per liter) from t = 2 to 35 min after the bolus of 2[14C]DG.
Statistical analysis
Data are presented as mean ± sem. Differences between groups were determined by one-way ANOVA followed by Tukey’s post hoc tests or two-tailed t test as appropriate. The significance level was P < 0.05.
Results
Glp1r−/− mice demonstrate a sexual dimorphism with regards to HF diet-induced obesity
Total, lean, and fat mass was assessed in 4-month-old Glp1r+/+ and Glp1r−/− mice after 12 wk of being fed a regular chow diet or a HF diet (Fig. 1). There was no difference in body weight, lean mass, or fat mass between genotypes on a regular chow diet. Contrasting this, the Glp1r−/− mice exhibited decreased body weight and fat mass compared with Glp1r+/+ littermates when fed a HF diet (Fig. 1A). Analyzing these data based on sex showed that this is due to decreased body weight and fat mass in female mice (Fig. 1B). Male Glp1r−/− mice showed a slight, although insignificant, decrease in body weight (Fig. 1C). Decreased body weight and fat mass improve whole-body insulin action. To avoid the complicating effects of differences in body weight and fat mass, male mice were matched by weight and fat mass between the genotypes for assessment of insulin action (Table 1).
Figure 1.
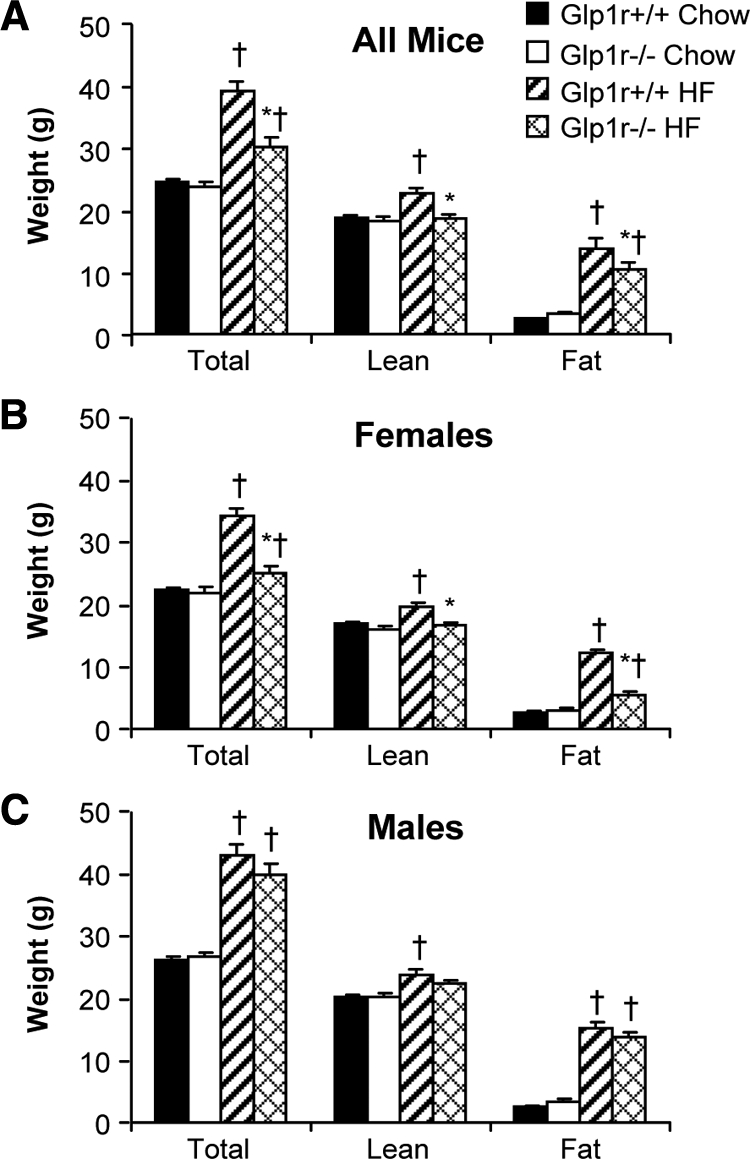
Total, lean, and fat mass in all (A), female (B), and male (C) mice at 4 months of age. Shown are results for chow-fed Glp1r+/+ (black bars; n = 16 female, 14 male), chow-fed Glp1r−/− (white bars; n = 12 female, 13 male), HF-fed Glp1r+/+ (striped bars; n = 15 female, 16 male) and HF-fed Glp1r−/− (diamond pattern bars; n = 13 female, 17 male) mice. Data are shown as mean ± sem *P < 0.05 vs. Glp1r+/+, same diet; †P < 0.05 vs. Chow, same genotype.
Table 1.
Weight and body composition in male mice selected for assessment of insulin action
| Glp1r+/+ chow | Glp1r−/− chow | Glp1r+/+ HF | Glp1r−/− HF | |
|---|---|---|---|---|
| n | 12 | 13 | 14 | 15 |
| Weight (g) | 26.1 ± 0.5 | 26.6 ± 0.9 | 38.8 ± 1.8a | 38.0 ± 1.2a |
| Lean mass (g) | 20.1 ± 0.4 | 20.1 ± 0.6 | 22.6 ± 0.9a | 21.8 ± 0.4a |
| Fat mass (g) | 2.5 ± 0.2 | 3.0 ± 0.5 | 14.1 ± 1.0a | 14.4 ± 0.6a |
Weight, lean mass, and fat mass are shown for male mice of both genotypes after 12 wk of either chow or HF feeding. Measurements are in 5-h-fasted mice at 4 months of age. Results are shown as mean ± sem.
P < 0.05 vs. chow, same genotype.
Glp1r−/− mice are protected from HF diet-induced insulin resistance
Insulin action was assessed in conscious mice using the insulin clamp. Baseline (5 h fasted) and insulin clamp characteristics are shown in Table 2. There were no significant differences in body weight between genotypes within each diet regimen (Table 2). Chow-fed Glp1r−/− mice exhibited mild fasting hyperglycemia compared with Glp1r+/+ mice, even as fasting insulin levels were equal. Plasma glucagon levels were insignificantly higher in Glp1r−/− mice on either diet (Table 2). The HF diet-induced increase in fasting glucose observed in Glp1r+/+ mice was not present in Glp1r−/− mice. HF feeding also resulted in a greater increase in fasting insulin levels in Glp1r+/+ mice than in Glp1r−/− mice. There were no differences in fasting NEFA levels between genotypes within each diet group. Fasting NEFA levels were insignificantly lower in HF-fed Glp1r−/− mice compared with HF-fed Glp1r+/+ mice, even though insulin levels were lower in the former (Table 2).
Table 2.
Basal (5 h fasted) and insulin clamp characteristics in male mice
| Glp1r+/+ chow | Glp1r−/− chow | Glp1r+/+ HF | Glp1r−/− HF | |
|---|---|---|---|---|
| n | 8 | 8 | 9 | 10 |
| Weight (g) | 26.9 ± 0.7 | 26.6 ± 0.5 | 36.9 ± 1.6a | 35.6 ± 1.6a |
| Arterial glucose (mmol · liter−1) | ||||
| Basal | 7.9 ± 0.3 | 9.2 ± 0.2b | 9.2 ± 0.5a | 8.5 ± 0.6 |
| Insulin clamp | 8.5 ± 0.3 | 9.0 ± 0.2 | 8.6 ± 0.1 | 8.6 ± 0.2 |
| Insulin (pmol · liter−1) | ||||
| Basal | 155 ± 33 | 206 ± 51 | 649 ± 62a | 453 ± 50a,b |
| Insulin clamp | 695 ± 98 | 611 ± 85 | 1085 ± 70a | 1143 ± 101a |
| NEFA (mEq · liter−1) | ||||
| Basal | 0.70 ± 0.05 | 0.65 ± 0.06 | 1.45 ± 0.19a | 1.16 ± 0.16a |
| Insulin clamp | 0.48 ± 0.06 | 0.37 ± 0.08 | 1.48 ± 0.15a | 0.80 ± 0.16a,b |
| Glucagon (pg · ml−1) | ||||
| Basal | 38 ± 7 | 46 ± 9 | 41 ± 5 | 49 ± 6 |
| Insulin clamp | 30 ± 8 | 35 ± 7 | 39 ± 7 | 42 ± 4 |
| Hematocrit (%) | ||||
| Basal | 36.1 ± 1.2 | 36.8 ± 1.1 | 35.4 ± 0.9 | 36.1 ± 1.3 |
| Insulin clamp | 35.7 ± 1.8 | 36.0 ± 1.5 | 35.7 ± 1.1 | 36.0 ± 1.0 |
| GIR (mmol · kg−1 · min−1) | 0.18 ± 0.01 | 0.22 ± 0.02 | 0.11 ± 0.01a | 0.20 ± 0.02b |
Basal glucose levels are from samples obtained at t = −15 and −5 min prior to the insulin clamp. Basal insulin and NEFA are from plasma samples obtained at t = −5 min prior to the insulin clamp. Basal glucagon is from plasma samples obtained at t = −15 min prior to the insulin clamp. Hematocrit readings were taken after taking blood samples at t = −5 min and at t = 120 min of the insulin clamp. GIR and clamp arterial glucose represent average values over t = 80–120 min of the insulin clamp. Clamp insulin, NEFA, and glucagon are from plasma samples obtained at t = 120 min of the insulin clamp.
P < 0.05 vs. chow, same genotype.
P < 0.05 vs. Glp1r+/+, same diet.
Arterial glucose was clamped at similar levels (∼8.5 mmol · liter−1) in all groups during the insulin clamps (Fig. 2, A and B, and Table 2). The GIR necessary to maintain euglycemia was not significantly different between chow-fed Glp1r+/+ and Glp1r−/− mice (Fig. 2C and Table 2). Contrasting this, the GIR was significantly higher in HF-fed Glp1r−/− mice compared with HF-fed Glp1r+/+ mice (Fig. 2D and Table 2). Clamp insulin levels were equal between genotypes and were significantly higher in HF-fed mice compared with chow-fed mice (Table 2). Clamp glucagon levels were not different between genotypes (Table 2). NEFA levels were suppressed by insulin in all groups except for HF-fed Glp1r+/+ mice (Table 2).
Figure 2.

Arterial glucose (A and B) and GIR (C and D) during insulin clamps in chow-fed (squares) and HF-fed (triangles) mice. Glp1r+/+ mice are represented by black symbols, whereas Glp1r−/− mice are represented by white symbols. Data are shown as mean ± sem for 8–10 mice/genotype and diet. *P < 0.05 vs. Glp1r+/+, same diet; †P < 0.05 vs. Chow, same genotype.
Basal endoRa (Fig. 3A) and Rd (Fig. 3B) were not different between genotypes or diets. There was a tendency for an impaired suppression of endoRa by insulin in chow-fed Glp1r−/− mice compared with Glp1r+/+ mice (P = 0.06). Contrasting this, insulin-mediated suppression of endoRa was significantly enhanced in HF-fed Glp1r−/− mice compared with Glp1r+/+ mice (Fig. 3A). Stimulation of Rd by insulin was significantly enhanced in Glp1r−/− mice, regardless of diet (Fig. 3B). Hepatic glycogen levels at the end of the insulin clamps were significantly lower in chow-fed Glp1r−/− mice. There was a tendency (P = 0.06) for hepatic glycogen levels to be lower in HF-fed Glp1r−/− mice (Fig. 3C). Regardless of diet, muscle glycogen levels were higher in Glp1r−/− mice (Fig. 3D).
Figure 3.
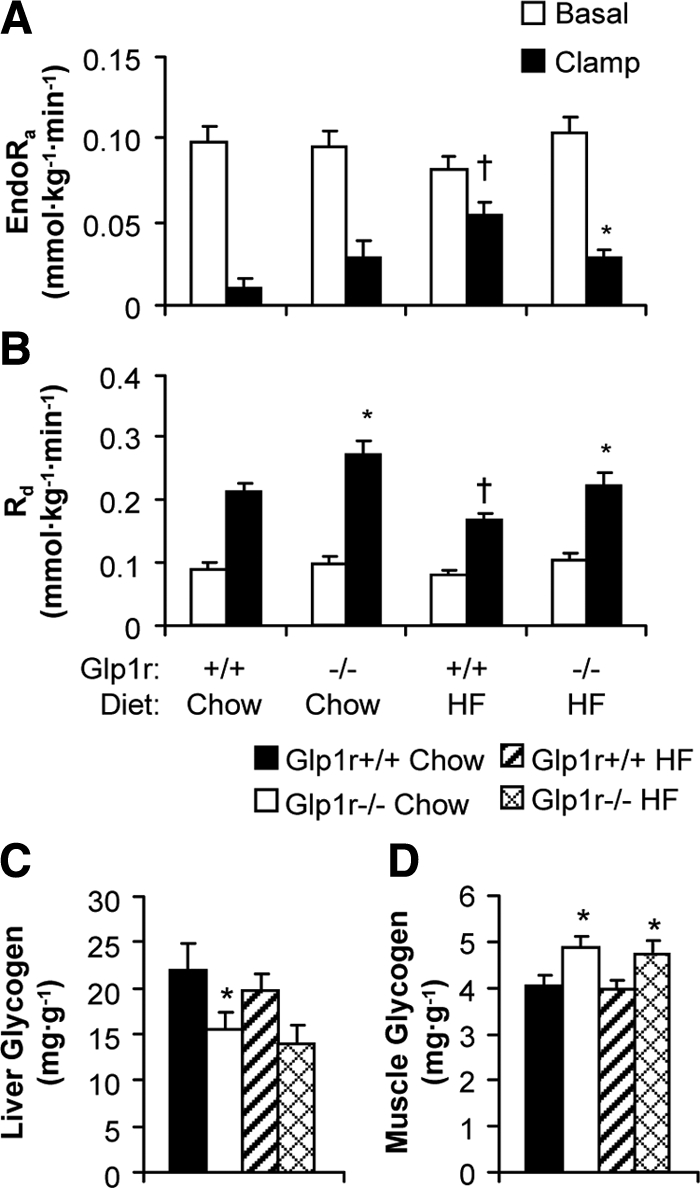
EndoRa (A) and Rd (B) during basal conditions (white bars) and during insulin clamps (black bars). Basal values are averaged from plasma samples obtained at t = −15 and −5 min before onset of insulin clamps. Clamp values are averaged from plasma samples obtained at t = 80 to 120 min of the insulin clamps. Liver (C) and gastrocnemius muscle (D) glycogen levels at the end of insulin clamps. Shown are results for chow-fed Glp1r+/+ (black bars), chow-fed Glp1r−/− (white bars), HF-fed Glp1r+/+ (striped bars) and HF-fed Glp1r−/− (diamond pattern bars) mice. Data are shown as mean ± sem for 8–10 mice/genotype and diet. *P < 0.05 vs. Glp1r+/+, same diet; †P < 0.05 vs. Chow, same genotype.
Insulin-stimulated muscle glucose uptake is enhanced in chow-fed and HF-fed Glp1r−/− mice
As shown in Fig. 4, A and B, Rg in hindlimb skeletal muscles was significantly higher in chow-fed Glp1r−/− mice. Rg in the diaphragm (Fig. 4C) and heart (Fig. 4D) was not different between genotypes. HF diet-induced muscle insulin resistance was observed in Glp1r+/+ mice as Rg was significantly lower in all muscles examined compared with chow-fed mice (Fig. 4). Whereas HF-fed Glp1r−/− mice exhibited muscle insulin resistance relative to their chow-fed counterparts, skeletal muscle Rg was higher compared with HF-fed Glp1r+/+ mice (Fig. 4, A and B). Taken together, results from the insulin clamp studies demonstrate that disruption of Glp1r expression enhances muscle insulin action in chow-fed mice and both muscle and hepatic insulin action in HF-fed mice.
Figure 4.

Glucose metabolic index (Rg) in gastrocnemius (A), superficial vastus lateralis (B), diaphragm (C), and heart (D) during insulin clamps. Shown are results for chow-fed Glp1r+/+ (black bars), chow-fed Glp1r−/− (white bars), HF-fed Glp1r+/+ (striped bars) and HF-fed Glp1r−/− (diamond pattern bars) mice. Values for Rg are normalized to clamp insulin levels. Data are shown as mean ± sem for 8–10 mice/genotype and diet. *P < 0.05 vs. Glp1r+/+, same diet; †P < 0.05 vs. Chow, same genotype.
Muscle and liver Akt activation are enhanced in HF-fed Glp1r−/− mice
Activation of muscle Akt was assessed to determine whether increased muscle Rg and glycogen levels in Glp1r−/− mice were due to enhanced insulin signaling (Fig. 5). In chow-fed mice, disruption of Glp1r expression did not increase levels of phosphorylated Akt, total Akt, or Akt activation in muscle (Fig. 5, A–C). In HF-fed Glp1r−/− mice, however, levels of phosphorylated Akt were higher compared with Glp1r+/+ mice, whereas total Akt levels were lower (Fig. 5, A and B). Thus, muscle Akt activation was enhanced in HF-fed Glp1r−/− mice (Fig. 5C). Furthermore, HF feeding impaired muscle Akt activation in Glp1r+/+ mice but not in Glp1r−/− mice (Fig. 5C). These results show that whereas disruption of Glp1r expression enhances insulin-stimulated muscle Rg regardless of diet, this is only associated with enhanced insulin signaling in HF-fed mice.
Figure 5.

Immunoblots for insulin signaling proteins after insulin clamp experiments. Representative immunoblots from gastrocnemius muscle (A) and liver (D) extracts are shown. Quantification of protein content for phosphorylated and total Akt (B and E) and Akt activation (C and F) is shown for chow-fed Glp1r+/+ (black bars), chow-fed Glp1r−/− (white bars), HF-fed Glp1r+/+ (striped bars) and HF-fed Glp1r−/− (diamond pattern bars) mice. GAPDH was used as a loading control. Data are shown as mean ± sem for 8–10 mice/genotype and diet. *P < 0.05 vs. Glp1r+/+, same diet; †P < 0.05 vs. Chow, same genotype.
To determine whether differences in the ability of insulin to suppress endoRa were associated with effects on insulin signaling, activation of hepatic Akt was also assessed. As seen in Fig. 5, D and E, hepatic Akt activation was not different between chow-fed Glp1r+/+ and Glp1r−/− mice. However, absolute levels of phosphorylated and total Akt were lower in Glp1r−/− mice. In HF-fed mice, phosphorylated Akt levels were significantly higher in Glp1r−/− mice, whereas total Akt levels were lower (Fig. 5B). The end result was that hepatic Akt activation was significantly enhanced in HF-fed Glp1r−/− mice. Furthermore, although HF feeding impaired hepatic insulin signaling in Glp1r+/+ mice, this impairment did not occur in Glp1r−/− mice (Fig. 5F).
HF-fed Glp1r−/− mice exhibit decreased muscle triglyceride accumulation and increased AMPK activation
Tissue lipid accumulation negatively affects insulin action. Muscle triglyceride levels were measured to assess whether enhanced muscle insulin action in Glp1r−/− mice correlated with decreased triglyceride levels. There was no difference in muscle triglycerides between genotypes in chow-fed mice. However, HF-fed Glp1r−/− mice exhibited lower triglyceride levels compared with their Glp1r+/+ counterparts (Fig. 6A). The activation of AMPK, assessed as the ratio of phosphorylated to total AMPK, was measured to determine whether decreased muscle triglyceride levels were associated with increased oxidation capacity. HF-fed Glp1r−/− mice exhibited increased activation of AMPK (Fig. 6, B–D) compared with their Glp1r+/+ counterparts. There was a slight, although not significant, increase in the levels of activated AMPK in skeletal muscle of chow-fed Glp1r−/− mice.
Figure 6.

Gastrocnemius muscle (A) and liver (E) triglyceride levels in chow-fed Glp1r+/+ (black bars), chow-fed Glp1r−/− (white bars), HF-fed Glp1r+/+ (striped bars) and HF-fed Glp1r−/− (diamond pattern bars) mice after insulin clamps. Representative immunoblots (B) and quantification of protein content (C) for phosphorylated AMPK(Thr172), total AMPK and loading control (GAPDH) from superficial vastus lateralis muscle in 5 h-fasted mice. Muscle AMPK activation (D). Representative immunoblots (F) and quantification of protein content (G) for nuclear SREBP-1 and loading control (YY1) from nuclear extracts isolated from livers after insulin clamps. Data are shown as mean ± sem for 4–10 mice/genotype and diet. *P < 0.05 vs. Glp1r+/+, same diet; †P < 0.05 vs. Chow, same genotype.
Hepatic triglyceride levels and SREBP-1 expression are decreased in HF-fed Glp1r−/− mice
Liver triglyceride accumulation was measured to determine whether enhanced hepatic insulin action in HF-fed Glp1r−/− mice correlated with decreased hepatic triglyceride levels. There was no difference in hepatic triglyceride levels between genotypes in chow-fed mice (Fig. 6E). HF-fed Glp1r−/− mice showed significantly decreased triglyceride accumulation compared with HF-fed Glp1r+/+ mice (Fig. 6E). Although HF feeding increased levels of nuclear SREBP-1 in Glp1r+/+ mice, this increase was not observed in HF-fed Glp1r−/− mice (Fig. 6, F and G).
Discussion
A role for Glp1 in the regulation of glucose production and use independent of its effects to stimulate insulin secretion has been suggested by some clinical studies (27,28,29,30,31,32,33,34) but disputed by other clinical studies (35,36,37,38,39,40). Our laboratory has previously demonstrated that disruption of the Glp1r, either in Glp1r−/− (18) or DIRKO (9) mice, impairs hepatic insulin action but reciprocally enhances muscle insulin action under controlled hyperinsulinemic-euglycemic conditions. The present studies further support a role for the Glp1r in the regulation of insulin action in the context of HF diet-induced insulin resistance. We show that the beneficial effect of disrupting Glp1r expression on muscle insulin action is sufficient to reduce the insulin resistance associated with HF feeding. A key finding in this study was that improved muscle insulin action in the HF-fed Glp1r−/− mice was observed independent of any effects on body weight and fat mass. We have previously reported impaired hepatic insulin action in chow-fed Glp1r−/− mice of both sexes (18). In the present studies using male mice, there was a tendency for the suppression of endoRa by insulin to be impaired (P = 0.06) in chow-fed Glp1r−/− mice. Surprisingly, rather than exacerbating hepatic insulin resistance, disruption of Glp1r expression resulted in improved suppression of endoRa in HF-fed mice.
Contrasting the findings from our laboratory, Hansotia et al. (41) have previously shown that male Glp1r−/− mice on a C57BL/6 background are significantly protected from HF diet-induced weight gain. However, those studies used a HF diet with significantly lower fat content than the diet used in the current studies (45 vs. 60 kcal/g, respectively). Furthermore, the mice used in the studies of Hansotia et al. (41) were placed on the HF diet at 9 wk of age, which is beyond the exponential growth phase in mice. This is in contrast to the present studies, in which mice were placed on a HF diet at 3 wk of age. We can therefore not exclude the possibility that placing mice on a very high fat diet at a time point early in the exponential growth phase, as was done in the present studies, prevents the divergence in weight gain observed by Hansotia et al. (41). Nevertheless, the present studies circumvent the confounding effects of differences in body weight by assessing insulin action in weight-matched male Glp1r+/+ and Glp1r−/− mice.
In support of our previous studies (18), enhanced insulin-stimulated MGU in chow-fed Glp1r−/− mice was not due to an effect on insulin signaling because muscle Akt activation was not increased. Recently Cabou et al. (42) reported that inhibition of central Glp1rs via icv infusion of exendin 9–39, a Glp1r antagonist, enhanced femoral arterial blood flow during a hyperinsulinemic-hyperglycemic clamp. Increased blood flow to the muscle is speculated to enhance MGU via greater delivery of insulin and glucose to the tissue (43,44,45). Indeed, we have previously demonstrated enhanced insulin-stimulated MGU in mice treated with the vasodilator sildenafil independent of increased muscle phosphatidylinositol 3-kinase or Akt activation (12). However, a role for the Glp1r to regulate MGU is not completely independent of an effect on insulin signaling because muscle Akt activation was higher in HF-fed Glp1r−/− mice compared with Glp1r+/+ mice. Inhibition of central Glp1r action has been shown to increase expression of endothelial nitric oxide synthase in skeletal muscle (19), which would be expected to have a positive effect on muscle blood flow. It is conceivable that through this mechanism the Glp1r regulates insulin-stimulated MGU via modulation of muscle blood flow. Activation of muscle AMPK is also increased in Glp1r−/− mice. This would be predicted to enhance muscle glucose uptake independent of insulin signaling (46). Furthermore, the increase in activated AMPK likely contributes to the lower muscle triglyceride levels in HF-fed Glp1r−/− mice, secondarily enhancing insulin action. We have previously observed a significant increase in muscle AMPK activation in Glp1r−/− mice in response to exercise. Disruption of Glp1r expression, in both DIRKO mice (9,41) and Glp1r−/− mice (41), increases locomotor activity. It is reasonable to suggest that increased activity in Glp1r−/− mice results in enhanced activation of muscle AMPK and increased oxidation of fat. This phenotype resembling exercise training would be predicted to enhance muscle insulin action.
We previously showed that Glp1r−/− mice exhibit impaired hepatic insulin action (18). It was therefore hypothesized that disruption of Glp1r expression would further exacerbate HF diet-induced hepatic insulin resistance. Instead, the ability of insulin to suppress endoRa was improved in HF-fed Glp1r−/− mice. This is likely due to decreased accumulation of hepatic triglycerides in HF-fed Glp1r−/− mice. Because intracellular accumulation of lipids correlates with tissue insulin resistance, a decrease in hepatic lipid accumulation in Glp1r−/− mice could have a positive effect on insulin action. Indeed, decreased levels of phosphorylated Akt in the livers of chow-fed Glp1r−/− and HF-fed Glp1r+/+ mice, both exhibiting hepatic insulin resistance, are normalized in HF-fed Glp1r−/− mice. Thus, reduced lipid accumulation may overcome any deleterious effect of disrupting Glp1r expression on hepatic insulin action in HF-fed mice. Although suppression of endoRa by insulin was enhanced in HF-fed Glp1r−/− mice, these mice did exhibit some markers of impaired hepatic insulin action. Similar to phenotypes observed in chow-fed Glp1r−/− mice, hepatic glycogen levels and total Akt expression were lower in HF-fed Glp1r−/− mice at the end of the insulin clamp. A direct role for the Glp1r to regulate hepatic Akt expression is not clear because the Glp1r is reportedly not expressed in hepatocytes. However, the effect on glycogen levels suggests that suppression of glycogenolysis and/or stimulation of hepatic glucose uptake are impaired in Glp1r−/− mice. In support of the latter, Zheng et al. (47) have shown that the Glp1r agonist exenatide stimulates hepatic uptake of exogenous glucose. HF-fed Glp1r−/− also did not exhibit an increase in activation of hepatic SREBP-1. One of the paradoxes of insulin resistance is that, whereas the liver becomes resistant to the actions of insulin to suppress glucose production, it remains sensitive to insulin-stimulated lipogenesis via activation of SREBP-1 (48). HF-fed Glp1r−/− mice demonstrate the opposite phenotype. These mice are more sensitive than their Glp1r+/+ counterparts to suppression of glucose production by insulin but less sensitive to the stimulation of lipogenesis by insulin via SREBP-1. Reduced hepatic lipogenesis would be predicted to decrease export of very low-density lipoprotein to tissues such as the muscle. This would contribute to the decreased muscle triglyceride levels and enhanced muscle insulin action in HF-fed Glp1r−/− mice.
The contributions of glucagon to the observed phenotypes in Glp1r−/− mice cannot be excluded. Because activation of the Glp1r suppresses glucagon secretion (5,6,8), it is reasonable to assume that Glp1r−/− mice would exhibit increased glucagon levels. This could explain the impaired suppression of endoRa in chow-fed Glp1r−/− mice during the insulin clamps. We did not observe significant differences in glucagon levels between genotypes within each diet group. This is supported by previous studies showing normal fasting glucagon levels, as well as normal suppression of glucagon by oral glucose loading, in Glp1r−/− mice (49,50,51). These measurements of glucagon levels were made from arterial or cardiac blood samples. Because glucagon clearance occurs in the liver, measurement of glucagon levels in the portal circulation would more accurately determine whether differences exist in the secretion of this hormone. We can therefore not exclude the possibility that glucagon levels are increased in the portal circulation of Glp1r−/− mice.
Recent evidence supports a key role for central, particularly hypothalamic, Glp1r action in the regulation of muscle and hepatic insulin action. Knauf et al. (52) showed increased muscle glycogen accumulation and decreased hepatic glycogen levels in mice receiving icv infusions of the Glp1r antagonist exendin 9–39 during a hyperinsulinemic-hyperglycemic clamp. In rats, infusion of Glp1 directly into the arcuate nucleus enhances the suppression of endoRa and the stimulation of Rd during an insulin clamp (53). Recently Knauf et al. (19) showed that a 4-wk icv infusion of exendin 9–39 in mice fed a carbohydrate-free HF diet resulted in a normalization of fasting hyperinsulinemia and hyperglycemia, which is in agreement with our present studies, as well as improved intraperitoneal glucose tolerance. Food intake was increased, but total weight and fat mass were not affected due to an increase in energy expenditure. This increase in energy expenditure was associated with increased locomotor activity and enhanced oxidative capacity in skeletal muscle (19). Improvements in muscle insulin action, assessed via a hyperinsulinemic-hyperglycemic clamp, were also suggested. However, the omission of standard data for insulin clamps such as insulin levels, glucose levels, and GIRs, makes interpretation of those clamp results impossible. Further complicating interpretation of the results obtained by Knauf et al. (19) is that a carbohydrate-free HF diet was used. The physiological irrelevance of using a carbohydrate-free diet to study the role of the Glp1r to regulate carbohydrate flux is clear. Nevertheless, in agreement with our present studies, blocking central Glp1rs has no effect on body weight or composition in HF-fed mice. This further supports a role for the Glp1r to regulate glucose production and use in insulin-resistant states independent of effects on body weight.
It is well established that Glp1 regulates hepatic glucose production and muscle glucose uptake via its insulinotropic and glucagonostatic actions. The present studies extend the glucoregulatory properties of Glp1 by showing that, under conditions of insulin-stimulated glucose flux, the Glp1r regulates glucose production and use independent of its ability to stimulate insulin secretion. Our previous and current findings in chow-fed mice suggest that Glp1r activation enhances the ability of insulin to suppress hepatic glucose production and stimulates hepatic glucose disposal at the expense of insulin-stimulated muscle glucose uptake. This mechanism would ensure the replenishment of hepatic glycogen stores after a meal and the maintenance of glucose homeostasis during the postabsorptive period. Our studies in HF-fed mice propose a role for the Gp1r in the regulation of the balance between fat and glucose metabolism. HF-fed Glp1r−/− mice exhibit decreased lipid accumulation in the liver and skeletal muscle, thus enhancing insulin action in these tissues. Similar findings in studies using targeted Glp1r activation and inhibition in the brain further suggest that central Glp1r signaling can also regulate hepatic and muscle insulin action. Taken together, our studies extend the role of Glp1 in the regulation of metabolic homeostasis to include both insulin secretion dependent and independent mechanisms.
Acknowledgments
We thank Dr. Owen McGuinness, Carlo Malabanan, and Tasneem Ansari (Vanderbilt Mouse Metabolic Phenotyping Center Metabolic Pathophysiology Core) for body composition analysis.
Footnotes
This work was supported by Grant 1-09-JF-03 from the American Diabetes Association (to J.E.A.), Grants R01 DK-54902 (to D.H.W.) and U24 DK-59637 (to the Vanderbilt Mouse Metabolic Phenotyping Center) from the National Institutes of Health, and Grant 1-2006-796 from the Juvenile Diabetes Research Foundation (to D.J.D.).
Disclosure Summary: D.J.D. has served as an adviser or consultant within the past 12 months to Amylin Pharmaceuticals, Arena Pharmaceuticals Inc., Arisaph Pharmaceuticals Inc., Eli Lilly Inc., Glaxo Smith Kline, Glenmark Pharmaceuticals, Hoffmann-La Roche Inc., Isis Pharmaceuticals Inc., Merck Research Laboratories, Metabolex Inc., Novartis Pharmaceuticals, Novo Nordisk Inc., Phenomix Inc., and Transition Pharmaceuticals Inc. Neither D.J.D. nor his family members hold stock directly or indirectly in any of these companies. The other authors have nothing to declare.
First Published Online August 4, 2010
Abbreviations: AMPK, AMP-activated protein kinase; 2[14C]DG, 2[14C]deoxyglucose; 2[14C]DGP, 2[14C]DG-6-phosphate; DIRKO, double-incretin receptor knockout; endoRa, endogenous glucose appearance; GAPDH, glyceraldehyde-3-phosphate dehydrogenase; Gip, glucose-dependent insulinotropic polypeptide; Gipr, Gip receptor; GIR, glucose infusion rate; Glp1, glucagon-like peptide-1; Glp1r, Glp1 receptor; HF, high fat; icv, intracerebroventricular; MGU, muscle glucose uptake; NEFA, nonesterified fatty acid; Rd, glucose disappearance; Rg, glucose metabolic index; SREBP, sterol regulatory element-binding protein.
References
- Thorens B 1992 Expression cloning of the pancreatic beta cell receptor for the gluco-incretin hormone glucagon-like peptide 1. Proc Natl Acad Sci USA 89:8641–8645 [DOI] [PMC free article] [PubMed] [Google Scholar]
- Campos RV, Lee YC, Drucker DJ 1994 Divergent tissue-specific and developmental expression of receptors for glucagon and glucagon-like peptide-1 in the mouse. Endocrinology 134:2156–2164 [DOI] [PubMed] [Google Scholar]
- Bullock BP, Heller RS, Habener JF 1996 Tissue distribution of messenger ribonucleic acid encoding the rat glucagon-like peptide-1 receptor. Endocrinology 137:2968–2978 [DOI] [PubMed] [Google Scholar]
- Miyawaki K, Yamada Y, Yano H, Niwa H, Ban N, Ihara Y, Kubota A, Fujimoto S, Kajikawa M, Kuroe A, Tsuda K, Hashimoto H, Yamashita T, Jomori T, Tashiro F, Miyazaki J, Seino Y 1999 Glucose intolerance caused by a defect in the entero-insular axis: a study in gastric inhibitory polypeptide receptor knockout mice. Proc Natl Acad Sci USA 96:14843–14847 [DOI] [PMC free article] [PubMed] [Google Scholar]
- Komatsu R, Matsuyama T, Namba M, Watanabe N, Itoh H, Kono N, Tarui S 1989 Glucagonostatic and insulinotropic action of glucagonlike peptide I-(7–36)-amide. Diabetes 38:902–905 [DOI] [PubMed] [Google Scholar]
- Dupre J, Behme MT, Hramiak IM, McFarlane P, Williamson MP, Zabel P, McDonald TJ 1995 Glucagon-like peptide I reduces postprandial glycemic excursions in IDDM. Diabetes 44:626–630 [DOI] [PubMed] [Google Scholar]
- Nauck MA, Niedereichholz U, Ettler R, Holst JJ, Orskov C, Ritzel R, Schmiegel WH 1997 Glucagon-like peptide 1 inhibition of gastric emptying outweighs its insulinotropic effects in healthy humans. Am J Physiol 273:E981–E988 [DOI] [PubMed] [Google Scholar]
- de Heer J, Rasmussen C, Coy DH, Holst JJ 2008 Glucagon-like peptide-1, but not glucose-dependent insulinotropic peptide, inhibits glucagon secretion via somatostatin (receptor subtype 2) in the perfused rat pancreas. Diabetologia 51:2263–2270 [DOI] [PubMed] [Google Scholar]
- Ayala JE, Bracy DP, Hansotia T, Flock G, Seino Y, Wasserman DH, Drucker DJ 2008 Insulin action in the double incretin receptor knockout mouse. Diabetes 57:288–297 [DOI] [PubMed] [Google Scholar]
- Surwit RS, Kuhn CM, Cochrane C, McCubbin JA, Feinglos MN 1988 Diet-induced type II diabetes in C57BL/6J mice. Diabetes 37:1163–1167 [DOI] [PubMed] [Google Scholar]
- Collins S, Martin TL, Surwit RS, Robidoux J 2004 Genetic vulnerability to diet-induced obesity in the C57BL/6J mouse: physiological and molecular characteristics. Physiol Behav 81:243–248 [DOI] [PubMed] [Google Scholar]
- Ayala JE, Bracy DP, Julien BM, Rottman JN, Fueger PT, Wasserman DH 2007 Chronic treatment with sildenafil improves energy balance and insulin action in high fat-fed conscious mice. Diabetes 56:1025–1033 [DOI] [PubMed] [Google Scholar]
- Gault VA, Irwin N, Green BD, McCluskey JT, Greer B, Bailey CJ, Harriott P, O'Harte FP, Flatt PR 2005 Chemical ablation of gastric inhibitory polypeptide receptor action by daily (Pro3)GIP administration improves glucose tolerance and ameliorates insulin resistance and abnormalities of islet structure in obesity-related diabetes. Diabetes 54:2436–2446 [DOI] [PubMed] [Google Scholar]
- Gault VA, McClean PL, Cassidy RS, Irwin N, Flatt PR 2007 Chemical gastric inhibitory polypeptide receptor antagonism protects against obesity, insulin resistance, glucose intolerance and associated disturbances in mice fed high-fat and cafeteria diets. Diabetologia 50:1752–1762 [DOI] [PubMed] [Google Scholar]
- McClean PL, Irwin N, Cassidy RS, Holst JJ, Gault VA, Flatt PR 2007 GIP receptor antagonism reverses obesity, insulin resistance, and associated metabolic disturbances induced in mice by prolonged consumption of high-fat diet. Am J Physiol Endocrinol Metab 293:E1746–E1755 [DOI] [PubMed] [Google Scholar]
- Miyawaki K, Yamada Y, Ban N, Ihara Y, Tsukiyama K, Zhou H, Fujimoto S, Oku A, Tsuda K, Toyokuni S, Hiai H, Mizunoya W, Fushiki T, Holst JJ, Makino M, Tashita A, Kobara Y, Tsubamoto Y, Jinnouchi T, Jomori T, Seino Y 2002 Inhibition of gastric inhibitory polypeptide signaling prevents obesity. Nat Med 8:738–742 [DOI] [PubMed] [Google Scholar]
- Yamada C, Yamada Y, Tsukiyama K, Yamada K, Yamane S, Harada N, Miyawaki K, Seino Y, Inagaki N 2007 Genetic inactivation of GIP signaling reverses aging-associated insulin resistance through body composition changes. Biochem Biophys Res Commun 364:175–180 [DOI] [PubMed] [Google Scholar]
- Ayala JE, Bracy DP, James FD, Julien BM, Wasserman DH, Drucker DJ 2009 The glucagon-like peptide-1 receptor regulates endogenous glucose production and muscle glucose uptake independent of its incretin action. Endocrinology 150:1155–1164 [DOI] [PMC free article] [PubMed] [Google Scholar]
- Knauf C, Cani PD, Ait-Belgnaoui A, Benani A, Dray C, Cabou C, Colom A, Uldry M, Rastrelli S, Sabatier E, Godet N, Waget A, Pénicaud L, Valet P, Burcelin R 2008 Brain glucagon-like peptide 1 signaling controls the onset of high-fat diet-induced insulin resistance and reduces energy expenditure. Endocrinology 149:4768–4777 [DOI] [PubMed] [Google Scholar]
- Ayala JE, Bracy DP, McGuinness OP, Wasserman DH 2006 Considerations in the design of hyperinsulinemic-euglycemic clamps in the conscious mouse. Diabetes 55:390–397 [DOI] [PubMed] [Google Scholar]
- Berglund ED, Li CY, Poffenberger G, Ayala JE, Fueger PT, Willis SE, Jewell MM, Powers AC, Wasserman DH 2008 Glucose metabolism in vivo in four commonly used inbred mouse strains. Diabetes 57:1790–1799 [DOI] [PMC free article] [PubMed] [Google Scholar]
- Chan TM, Exton JH 1976 A rapid method for the determination of glycogen content and radioactivity in small quantities of tissue or isolated hepatocytes. Anal Biochem 71:96–105 [DOI] [PubMed] [Google Scholar]
- Steele R, Wall JS, De Bodo RC, Altszuler N 1956 Measurement of size and turnover rate of body glucose pool by the isotope dilution method. Am J Physiol 187:15–24 [DOI] [PubMed] [Google Scholar]
- DeBodo RC, Steele R, Altszuler N, Dunn A, Bishop JS 1963 On the hormonal regulation of carbohydrate metabolism: studies with C14 glucose. Recent Prog Horm Res 19:445–488 [PubMed] [Google Scholar]
- Kraegen EW, James DE, Jenkins AB, Chisholm DJ 1985 Dose-response curves for in vivo insulin sensitivity in individual tissues in rats. Am J Physiol 248:E353–E362 [DOI] [PubMed] [Google Scholar]
- Fueger PT, Bracy DP, Malabanan CM, Pencek RR, Wasserman DH 2004 Distributed control of glucose uptake by working muscles of conscious mice: roles of transport and phosphorylation. Am J Physiol Endocrinol Metab 286:E77–E84 [DOI] [PubMed] [Google Scholar]
- Gutniak M, Orskov C, Holst JJ, Ahrén B, Efendic S 1992 Antidiabetogenic effect of glucagon-like peptide-1 (7–36)amide in normal subjects and patients with diabetes mellitus. N Engl J Med 326:1316–1322 [DOI] [PubMed] [Google Scholar]
- D'Alessio DA, Kahn SE, Leusner CR, Ensinck JW 1994 Glucagon-like peptide 1 enhances glucose tolerance both by stimulation of insulin release and by increasing insulin-independent glucose disposal. J Clin Invest 93:2263–2266 [DOI] [PMC free article] [PubMed] [Google Scholar]
- D'Alessio DA, Prigeon RL, Ensinck JW 1995 Enteral enhancement of glucose disposition by both insulin-dependent and insulin-independent processes. A physiological role of glucagon-like peptide I. Diabetes 44:1433–1437 [DOI] [PubMed] [Google Scholar]
- Shalev A, Ninnis R, Keller U 1998 Effects of glucagon-like peptide 1 (7–36 amide) on glucose kinetics during somatostatin-induced suppression of insulin secretion in healthy men. Horm Res 49:221–225 [DOI] [PubMed] [Google Scholar]
- Meneilly GS, McIntosh CH, Pederson RA, Habener JF, Gingerich R, Egan JM, Finegood DT, Elahi D 2001 Effect of glucagon-like peptide 1 on non-insulin-mediated glucose uptake in the elderly patient with diabetes. Diabetes Care 24:1951–1956 [DOI] [PubMed] [Google Scholar]
- Egan JM, Meneilly GS, Habener JF, Elahi D 2002 Glucagon-like peptide-1 augments insulin-mediated glucose uptake in the obese state. J Clin Endocrinol Metab 87:3768–3773 [DOI] [PubMed] [Google Scholar]
- Prigeon RL, Quddusi S, Paty B, D'Alessio DA 2003 Suppression of glucose production by GLP-1 independent of islet hormones: a novel extrapancreatic effect. Am J Physiol Endocrinol Metab 285:E701–E707 [DOI] [PubMed] [Google Scholar]
- Azuma K, Rádikova Z, Mancino J, Toledo FG, Thomas E, Kangani C, Dalla Man C, Cobelli C, Holst JJ, Deacon CF, He Y, Ligueros-Saylan M, Serra D, Foley JE, Kelley DE 2008 Measurements of islet function and glucose metabolism with the dipeptidyl peptidase 4 inhibitor vildagliptin in patients with type 2 diabetes. J Clin Endocrinol Metab 93:459–464 [DOI] [PubMed] [Google Scholar]
- Orskov L, Holst JJ, Møller J, Orskov C, Møller N, Alberti KG, Schmitz O 1996 GLP-1 does not acutely affect insulin sensitivity in healthy man. Diabetologia 39:1227–1232 [DOI] [PubMed] [Google Scholar]
- Toft-Nielson M, Madsbad S, Holst JJ 1996 The effect of glucagon-like peptide I (GLP-I) on glucose elimination in healthy subjects depends on the pancreatic glucoregulatory hormones. Diabetes 45:552–556 [DOI] [PubMed] [Google Scholar]
- Ahrén B, Larsson H, Holst JJ 1997 Effects of glucagon-like peptide-1 on islet function and insulin sensitivity in non-insulin-dependent diabetes mellitus. J Clin Endocrinol Metab 82:473–478 [DOI] [PubMed] [Google Scholar]
- Ryan AS, Egan JM, Habener JF, Elahi D 1998 Insulinotropic hormone glucagon-like peptide-1-(7–37) appears not to augment insulin-mediated glucose uptake in young men during euglycemia. J Clin Endocrinol Metab 83:2399–2404 [DOI] [PubMed] [Google Scholar]
- Vella A, Shah P, Basu R, Basu A, Holst JJ, Rizza RA 2000 Effect of glucagon-like peptide 1(7–36) amide on glucose effectiveness and insulin action in people with type 2 diabetes. Diabetes 49:611–617 [DOI] [PubMed] [Google Scholar]
- Vella A, Shah P, Reed AS, Adkins AS, Basu R, Rizza RA 2002 Lack of effect of exendin-4 and glucagon-like peptide-1-(7,36)-amide on insulin action in non-diabetic humans. Diabetologia 45:1410–1415 [DOI] [PubMed] [Google Scholar]
- Hansotia T, Maida A, Flock G, Yamada Y, Tsukiyama K, Seino Y, Drucker DJ 2007 Extrapancreatic incretin receptors modulate glucose homeostasis, body weight, and energy expenditure. J Clin Invest 117:143–152 [DOI] [PMC free article] [PubMed] [Google Scholar]
- Cabou C, Campistron G, Marsollier N, Leloup C, Cruciani- Guglielmacci C, Pénicaud L, Drucker DJ, Magnan C, Burcelin R 2008 Brain glucagon-like peptide-1 regulates arterial blood flow, heart rate, and insulin sensitivity. Diabetes 57:2577–2587 [DOI] [PMC free article] [PubMed] [Google Scholar]
- Baron AD 1994 Hemodynamic actions of insulin. Am J Physiol 267:E187–E202 [DOI] [PubMed] [Google Scholar]
- Baron AD, Tarshoby M, Hook G, Lazaridis EN, Cronin J, Johnson A, Steinberg HO 2000 Interaction between insulin sensitivity and muscle perfusion on glucose uptake in human skeletal muscle: evidence for capillary recruitment. Diabetes 49:768–774 [DOI] [PubMed] [Google Scholar]
- Clark MG, Wallis MG, Barrett EJ, Vincent MA, Richards SM, Clerk LH, Rattigan S 2003 Blood flow and muscle metabolism: a focus on insulin action. Am J Physiol Endocrinol Metab 284:E241–E258 [DOI] [PubMed] [Google Scholar]
- Fujii N, Jessen N, Goodyear LJ 2006 AMP-activated protein kinase and the regulation of glucose transport. Am J Physiol Endocrinol Metab 291:E867–E877 [DOI] [PubMed] [Google Scholar]
- Zheng D, Ionut V, Mooradian V, Stefanovski D, Bergman RN 2009 Exenatide sensitizes insulin-mediated whole-body glucose disposal and promotes uptake of exogenous glucose by the liver. Diabetes 58:352–359 [DOI] [PMC free article] [PubMed] [Google Scholar]
- Brown MS, Goldstein JL 2008 Selective versus total insulin resistance: a pathogenic paradox. Cell Metab 7:95–96 [DOI] [PubMed] [Google Scholar]
- Scrocchi LA, Brown TJ, MaClusky N, Brubaker PL, Auerbach AB, Joyner AL, Drucker DJ 1996 Glucose intolerance but normal satiety in mice with a null mutation in the glucagon-like peptide 1 receptor gene. Nat Med 2:1254–1258 [DOI] [PubMed] [Google Scholar]
- Scrocchi LA, Marshall BA, Cook SM, Brubaker PL, Drucker DJ 1998 Identification of glucagon-like peptide 1 (GLP-1) actions essential for glucose homeostasis in mice with disruption of GLP-1 receptor signaling. Diabetes 47:632–639 [DOI] [PubMed] [Google Scholar]
- Baggio LL, Huang Q, Brown TJ, Drucker DJ 2004 A recombinant human glucagon-like peptide (GLP)-1-albumin protein (albugon) mimics peptidergic activation of GLP-1 receptor-dependent pathways coupled with satiety, gastrointestinal motility, and glucose homeostasis. Diabetes 53:2492–2500 [DOI] [PubMed] [Google Scholar]
- Knauf C, Cani PD, Perrin C, Iglesias MA, Maury JF, Bernard E, Benhamed F, Grémeaux T, Drucker DJ, Kahn CR, Girard J, Tanti JF, Delzenne NM, Postic C, Burcelin R 2005 Brain glucagon-like peptide-1 increases insulin secretion and muscle insulin resistance to favor hepatic glycogen storage. J Clin Invest 115:3554–3563 [DOI] [PMC free article] [PubMed] [Google Scholar]
- Sandoval DA, Bagnol D, Woods SC, D'Alessio DA, Seeley RJ 2008 Arcuate glucagon-like peptide 1 receptors regulate glucose homeostasis but not food intake. Diabetes 57:2046–2054 [DOI] [PMC free article] [PubMed] [Google Scholar]