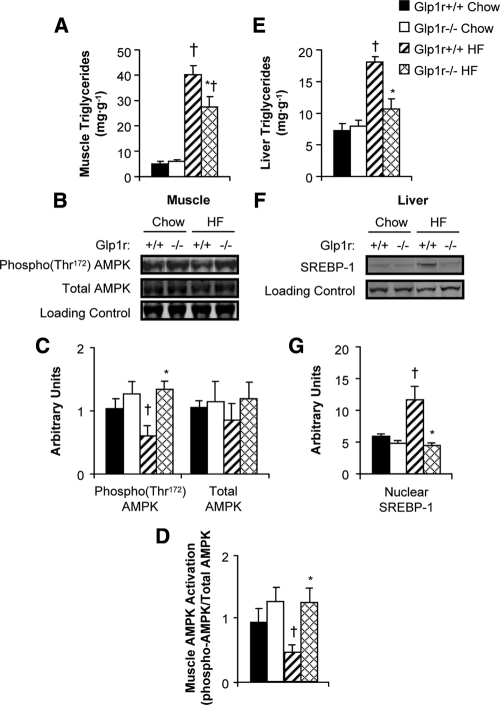
Figure 6.
Gastrocnemius muscle (A) and liver (E) triglyceride levels in chow-fed Glp1r+/+ (black bars), chow-fed Glp1r−/− (white bars), HF-fed Glp1r+/+ (striped bars) and HF-fed Glp1r−/− (diamond pattern bars) mice after insulin clamps. Representative immunoblots (B) and quantification of protein content (C) for phosphorylated AMPK(Thr172), total AMPK and loading control (GAPDH) from superficial vastus lateralis muscle in 5 h-fasted mice. Muscle AMPK activation (D). Representative immunoblots (F) and quantification of protein content (G) for nuclear SREBP-1 and loading control (YY1) from nuclear extracts isolated from livers after insulin clamps. Data are shown as mean ± sem for 4–10 mice/genotype and diet. *P < 0.05 vs. Glp1r+/+, same diet; †P < 0.05 vs. Chow, same genotype.

