

Abstract
In this second of a two part series, we present pilot clinical data demonstrating Acoustic Radiation Force Impulse (ARFI) ultrasound for monitoring the onset of subcutaneous hemostasis at femoral artery puncture sites (arteriotomies), in vivo. We conducted a randomized, reader-blinded investigation of 20 patient volunteers who underwent diagnostic percutaneous coronary catheterization. After sheath removal (6 French), patients were randomized to treatment with either standard of care manual compression alone or, to expedite hemostasis, manual compression augmented with a p-GlcNAc fiber-based hemostatic dressing (Marine Polymer Technologies, Danvers MA). Concurrent with manual compression, serial ARFI imaging began at the time of sheath removal and continued every minute for 15 min. Serial data sets were processed with custom software to (1) estimate the time of hemostasis onset, and (2) render hybrid ARFI/B-Mode images to highlight displacements considered to correspond to extravasted blood. Images were read by an observer blinded to the treatment groups. Average estimated times to hemostasis in patient volunteers treated with manual compression alone (n = 10) and manual compression augmented by hemostatic dressing (n = 9) were, respectively, 13.00 ± 1.56 and 9.44 ± 3.09 min, which are statistically significantly different (p = 0.0065, Wilcoxon two-sample test). Example images are shown for three selected patient volunteers. These pilot data suggest that ARFI ultrasound is relevant to monitoring subcutaneous bleeding from femoral arteriotomies clinically and that time to hemostasis was significantly reduced by use of the hemostatic dressing.
Keywords: Acoustic radiation force impulse (ARFI) ultrasound, arterial puncture closure device, cardiac catheterization, femoral artery, hemostasis, human, p-GlcNAc fiber-based dressing
Introduction
As discussed in part one of this two-part manuscript series, hemostasis at femoral arteriotomies following percutaneous cardiac catheterization is commonly achieved by manual compression at the arteriotomy and sustained by prolonged time to ambulation.1 Manual compression can be associated with patient discomfort, while prolonged bed rest is uncomfortable to the patient and costly to medical centers.2 Patient care could be improved, and medical expense reduced, by individualizing manual compression and bed-rest times to each patient's specific needs via a noninvasive, cost-efficient imaging technology.
We have shown that ARFI ultrasound is a viable imaging method for noninvasively monitoring hemostasis in vivo at femoral arteriotomies in a relevant canine model.1 Extending our preclinical feasibility work to pilot clinical studies requires careful consideration of potential approaches to validating ARFI results. Validation against an alternative imaging modality is not possible because there is no established imaging method for monitoring subcutaneous bleeding at femoral arteriotomies. Validation against observed bleeding cessation at the skin surface is not appropriate because it is not an adequate indication of subcutaneous bleeding status. In the absence of gold-standard validation, we propose to compare ARFI derived time to hemostasis at arteriotomies in two patient populations: (1) those treated with standard of care manual compression alone versus (2) those treated with a technology to expedite hemostasis.
A variety of methods for expediting hemostasis at arteriotomies exist. Technologies collectively known as arterial puncture closure device (APCDs) generally operate by suture alone, extravascular collagen alone, suture-collagen combinations or surgical staple/clip.3 However, there is sparse and conflicting evidence of the benefits of APCD usage. APCDs are limited by the potential for rare but catastrophic complications including arterial occlusion and foreign body infection.4 There is also evidence that APCDs may increase the risk of hematoma and pseudoaneurysm formation and compromise the ability to re-stick or reuse the same arterial region.2, 5-10
Topical, noninvasive alternatives to APCDs without the potential for vascular complications are hemostatic dressings. Hemostatic dressings are applied at the skin puncture site to augment manual compression. They expedite hemostasis by exploiting biochemical processes via procoagulant agents. A novel vascular-access hemostasis dressing containing poly-N-acetyl glucosamine (p-GlcNAc) nanofibers, a unique material purified from a marine diatom, has been shown effective for decreasing time to hemostasis at femoral arteriotomies by 37% in a double-blind, randomized study.11 Rates of vascular complication are comparable to those reported for manual compression alone.11-13
The effectiveness, safety, and ease-of-use of the p-GlcNAc fiber-based dressing affords us the ability to evaluate ARFI-derived time to hemostasis in patient volunteers. We here report pilot results from a randomized, reader-blinded pilot clinical study comparing ARFI-derived time to hemostasis in catheterization patient volunteers treated with standard of care manual compression alone versus those treated with manual compression augmented by the p-GlcNAc fiber-based dressing.
Methods
All procedures were approved by the University of North Carolina at Chapel Hill Institutional Review Board (IRB). ARFI imaging was performed using a Siemens SONOLINE Antares™ imaging system specially equipped for research purposes and a VF7-3 linear array transducer (Siemens Medical Solutions USA, Inc. Ultrasound Division). ARFI imaging beam sequences were as described in part one of this two-part series, except that the axial focal depth ranged from 15 - 35 mm to target the location of the near arterial wall in the human subjects. 1
Twenty adult patient volunteers (n = 8 males, 12 females) undergoing percutaneous diagnostic cardiac catheterization requiring femoral artery access were recruited from the C.V. Richardson Cardiac Catheterization Laboratory at University of North Carolina at Chapel Hill by a clinical nurse coordinator. Exclusion criteria included active bleeding or expanding hematoma prior to sheath removal, pregnancy, inability to communicate in English, intravenous anticoagulation therapy, coumadin therapy, excessive body size, clotting disorders, cardiogenic shock and coronary intervention.
The ultrasound scanner was wheeled to the patient bed-side after completion of the catheterization procedure. A professional sonographer trained in peripheral vascular and ARFI ultrasound performed imaging. Using the same Antares™ scanner, conventional B-Mode imaging was performed with the sheath in place to note the arteriotomy. With continuous B-Mode ultrasound observation, a board certified interventional cardiologist removed the sheath from the femoral artery and applied manual compression anterior and posterior to the femoral arteriotomy. Consistent with standard of care, maximum pressure was applied for seven minutes, at which time the skin puncture site was observed. If no bleeding was seen at the skin surface, pressure was reduced slightly; however, if bleeding was apparent, maximum pressure was maintained. In either case, pressure was held for a total duration of at least 15 minutes or until bleeding stopped. If re-bleeding occurred at the skin surface, maximum pressure was reapplied.
The imaging transducer, which also supplied pressure, was centered above the femoral arteriotomy, with the puncture path from the skin surface to the arteriotomy in the imaging field of view. Ten patient volunteers were randomized to treatment with manual compression alone. Ten were randomized to treatment with manual compression augmented by the p-GlcNAc fiber-based dressing, which was applied at the skin puncture site in accordance with the manufacturer's directions.
ARFI and spatially matched B-Mode data were serially acquired at 1 min intervals from the time of sheath removal for a total imaging period of 15 min. Importantly, ARFI imaging was not performed prior to sheath removal to avoid exaggerated heating associated with strong reflections off the sheath.14 The acquired rf data was transferred to a computational work station for processing and analysis. Physiological motion was rejected using a linear filter,15 and parametric ARFI PD images were rendered.
To facilitate clinical interpretation of ARFI imaging results, we developed custom software aiming to differentiate extravasated blood from soft tissue or blood contained in the vessel lumen. This was accomplished by exploiting measured one-dimensional axial displacements and one-dimensional cross-correlation. Axial displacements in soft tissue were anticipated to have low variance relative to luminal and extravasated blood after about 2 ms. At this time, soft tissue was expected to have approximately recovered from ARFI excitation; however, extravasated blood was not expected to have recovered and luminal blood was expected to flow with cardiac pulsation. Due to cardiac pulsation, luminal blood was expected to decorrelate quickly relative to extravasated blood, which was expected to decorrelate faster than soft tissue.18, 19
These expectations are realized in figure 1, which illustrates plots of displacement versus time (panel a), cross-correlation versus time (panel b), 1st derivative of cross-correlation versus time (panel c) and 2nd derivative of cross-correlation versus time (panel d) for representative soft tissue, extravasated blood and luminal blood pixels. Panel (a) shows that soft tissue experiences low displacement variance relative to extravasated and luminal blood in the 20 to 60 ms time frame. Similarly, panels (b)-(d) show that soft tissue experiences relatively low cross-correlation, 1st derivative of cross-correlation and 2nd derivative of cross-correlation variances. Moreover, the mean cross-correlation coefficient of soft tissue was relatively high. Because the cross-correlation of luminal blood varies rapidly over time, its 1st and 2nd derivatives have high variance relative to soft tissue and extravasated blood.
FIG. 1.
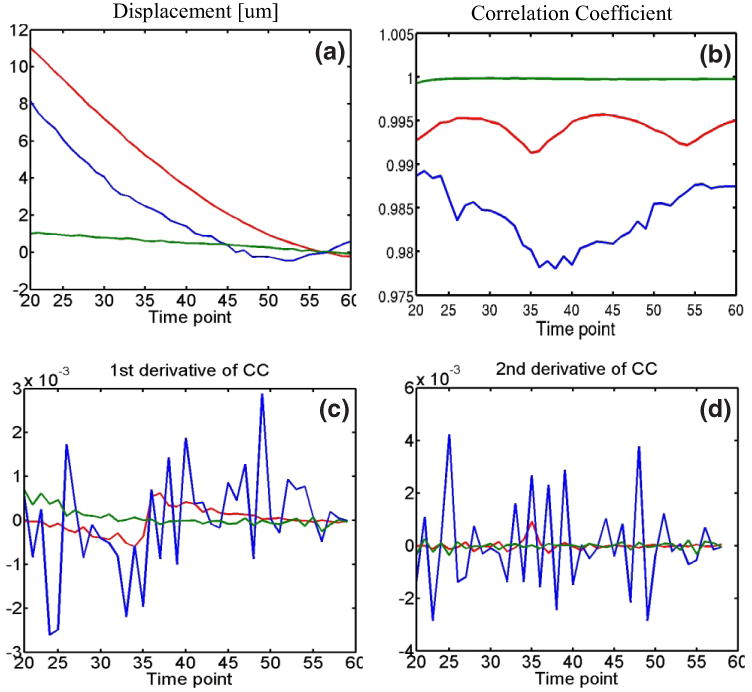
Displacement versus time (panel (a)), cross-correlation coefficient (CC) versus time (panel (b)), 1st derivative of CC versus time (panel (c)) and 2nd derivative of CC versus time (panel (d)) for representative signals arising from luminal blood (blue), extravasated blood (red) and soft tissue (green). Soft tissue is shown to exhibit smaller displacement, CC, 1st derivative of CC and 2nd derivative of CC variance than luminal and extravasated blood. Soft tissue is also shown to exhibit higher mean CC.
We applied this information by comparing five metrics for automatic separation of soft tissue from blood: (1) variance of displacement, (2) variance of cross-correlation coefficient, (3) variance of 1st derivative of cross-correlation, (4) variance of 2nd derivative of cross-correlation and (5) mean correlation coefficient. For each pixel in the ARFI imaging field of view, variances above the mean variance were considered to be either extravasated or luminal blood; mean correlation coefficient values below the average mean correlation coefficient were considered to be blood. All five metrics performed comparably, isolating visually indistinguishable blood regions, and so the results of comparing these metrics are not shown below. All images were prepared using the most intuitive metric, variance of axial displacement, as the metric for blood signal separation.
Identified blood pixels were spatially grouped into clusters using ‘bwlabel’ with eight connected objects in MATLAB (The MathWorks, Inc. Natick, MA). The cluster with the largest mean variance of the 2nd derivative of cross-correlation was considered to be luminal blood, as were clusters positioned at or below the luminal blood cluster's axial depth. All other clusters were considered to be extravasated blood. Identification of extravasated blood was further refined by disregarding pixels with peak displacements < 4 μm, the expected peak displacement of soft tissue. This refinement was intended to account for pixels corresponding to soft tissue that were mistakenly labeled as extravasated blood due to abnormally noisy displacement or cross-correlation values. It was also intended to account for the absence of extravasated blood, in which case the relative thresholding techniques falsely label soft tissue as extravasated blood. This is discussed further in the Discussion section. Our methods of extravasated blood signal isolation are illustrated in figure 2.
FIG. 2.
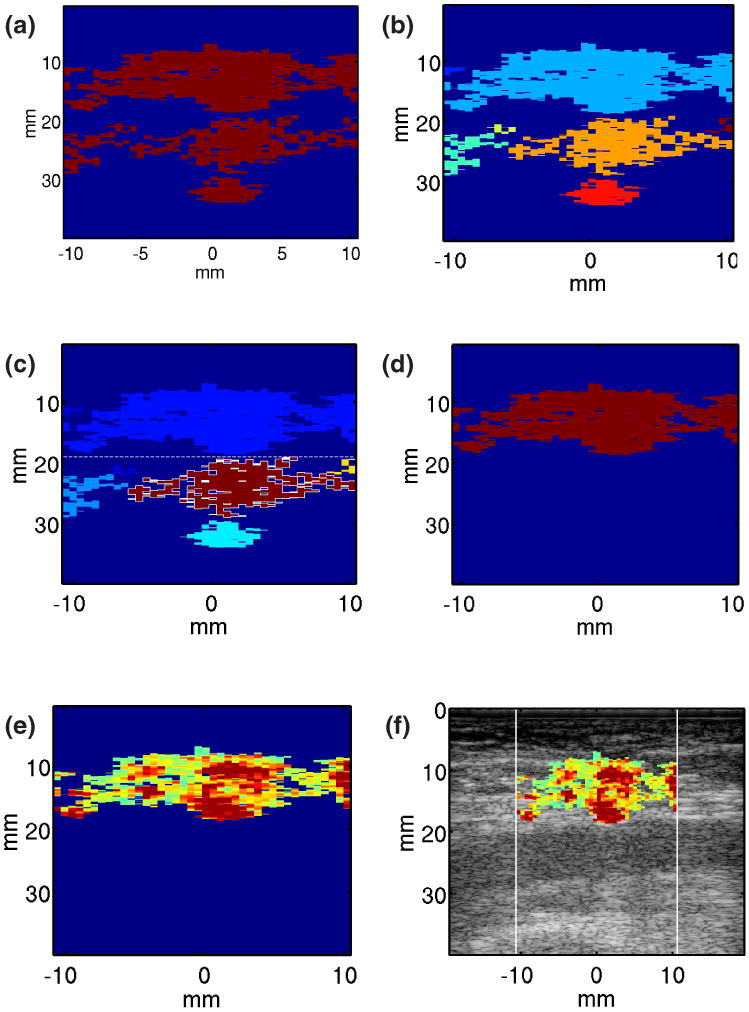
Method for automatic identification of pixels corresponding to extravasated blood. (1) A binary mask is developed by thresholding on mean variance of displacement measured from 20 to 60 ms of the acquired ARFI displacement tracking ensemble (panel (a)). (2) Selected pixels are spatially grouped into clusters using ‘bwlabel’ in MATLAB with 8 connected objects (panel(b)). (3) The cluster with the highest mean variance of the 2nd derivative of correlation coefficient (CC) is identified (outlined); it and all other clusters at or below its axial position are rejected as luminal blood (panel (c)). (4) Pixels with peak displacements >4 μm in the remaining clusters are identified as extravasated blood pixels (panel (d)). ARFI PD values are mapped to the extravasated blood pixels (panel (e)) and hybrid ARFI/B-Mode images are rendered (panel (f)).
Estimated extravasated blood area was calculated as n × a, where n is the number of identified extravasated blood pixels and a is the spatial area [mm2] that each pixel spans. The time at which the estimated extravasated blood area remained constant or decreased was considered to be the time of hemostasis onset, assuming that bleeding rate was much faster than blood diffusion and coagulation rates. If the estimated extravasated blood area continued to increase over the entire 15 min duration of imaging, time to hemostasis was recorded as the last imaging time point. The reader was blinded to treatment method. Peak ARFI-induced displacements measured in the identified extravasated blood regions were superimposed in color on the matched B-Mode images for an ARFI/B-Mode hybrid image.
Statistical analysis
Descriptive statistics are expressed as mean ± one standard deviation (SD). The Wilcoxon two-sample test was used for comparisons between groups. A p value of < 0.05 was defined as significant.
Results
Table 1 reports average ARFI-derived time to hemostasis for the twenty patients recruited into the study. One data set was unusable due to extreme motion artifact. Average ARFI-derived time to hemostasis in patients treated with manual compression alone was 13.00 ± 1.56 min. Average ARFI-derived time to hemostasis in patients treated with manual compression augmented by hemostatic dressing was 9.44 ± 3.09 min. The one-sided exact p-value for the Wilcoxon statistic is smaller than 0.0069, indicating the average ARFI-derived time to hemostasis is longer in patients treated with manual compressioan alone compared to those treated with manual compression augmented by hemostatic dressing.
Table 1.
Summary of pilot clinical study.
| N | Average ARFI-derived time to hemostasis [mean ± SD], min | |
|---|---|---|
| Patients enrolled | 20 | |
| Patients included | 19 | |
| Manual compression alone | 10 | 13.00 ± 1.56 |
| Hemostatic dressing | 9 | 9.44 ± 3.09 |
| Wilcoxon two-sample test | p = 0.0069 | |
Three examples of ARFI imaging of hemostasis at femoral arteriotomy follow. Figure 3 displays serial ARFI and matched B-Mode imaging of the punctured right femoral artery in a 76 year-old female volunteer at three time points, 3, 11 and 15 min following sheath removal. The volunteer's arteriotomy was randomized to manual compression only. Conventional B-Mode images, displayed along the top row (panels (a), (b) and (c)), do not differentiate the arteriotomy (circled), and they do not indicate bleeding. Parametric ARFI peak displacement (PD) images are shown in the middle row (panels (d), (e) and (f)), with peak displacement in μm mapped to color according to the adjacent colorbar. The PD images show focal regions of large displacement (∼ 5 -9 μm) relative to adjacent arterial wall tissue (∼ 3 μm) in the positions of the arteriotomies (circled). Moreover, relatively large displacements (> 5 μm) are achieved in the soft tissue above the artery. Three minutes after sheath removal, the large displacements are confined to the immediate vicinity of the near artery wall (panel d, arrow). As time after sheath removal increases to 11 (panel (e)) and then 15 (panel (f)) min, the area of large displacements in the soft tissue increases (arrows). This result suggests that the volume of pooled extravasated blood increases as time after sheath removal progresses, and there is no indication that hemostasis has been achieved 15 min after sheath removal.
FIG. 3.
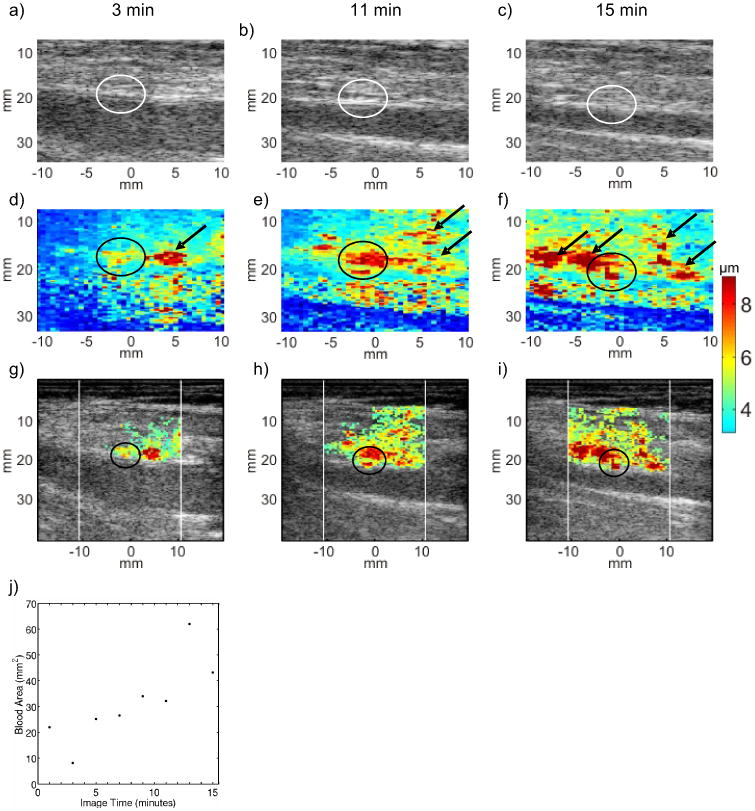
Serial B-Mode, ARFI peak displacement (PD), and hybrid ARFI/B-Mode images of the femoral arteriotomy in a 76 year-old female volunteer at 3 (left column), 11 (middle column) and 15 (right column) min following sheath removal. Hemostasis was achieved by manual compression alone. In B-Mode images (top row, panels (a), (b) and (c)), the arteriotomies (circled) are not readily apparent, and there is no indication of bleeding. In raw ARFI PD images (middle row, panels (d), (e) and (f)), the arteriotomy is notable as a localized region of relative high tissue displacement in the near arterial wall (circled). Relatively large ARFI PDs in the soft tissue above the artery with high displacement variance are suggestive of extravasated blood (arrows). Hybrid ARFI/B-Mode images (third row, panels (g), (h) and (i) map ARFI PDs in positions of high displacement variance into B-Mode images and more clearly suggest a growing pool of extravasated blood. The hybrid images support bleeding detection but some arterial wall detail at 3 min follow sheath removal (panel (g), circled) is sacrificed. A scatter plot of estimated extravasated blood area versus time (panel (j)) shows consistently increasing area and suggests that hemostasis is not achieved within the 15 min serial imaging period.
Hybrid ARFI/B-Mode images are displayed along the third row of figure 1 panels (g), (h) and (i)). Color in these hybrid images represents displacement in μm according to the adjacent colorbar. Recall that color is only mapped to points automatically classified as pooled extravasated blood by our custom methods. The white vertical lines denote the lateral span of ARFI imaging. Note that the growing area of large displacement thought to be extravasated blood is preserved in the hybrid images as is the focal regions of heightened displacement at the arteriotomy. Panel (j) displays a scatter plot of estimated extravasated blood area versus time for this serial data set. The estimated area generally increases over the entire duration of imaging and hemostasis is not indicated at the 15 min time point. Our study protocol specified serial imaging for a duration of 15 min, and so we did not observe the time at which hemostasis at the arteriotomy occurred. For logistical purposes at the bedside, we defined time to hemostasis as the time of the last imaging time point; the associated consequence is presented in the Discussion section below.
Figure 4 illustrates serial B-Mode, ARFI and hybrid ARFI/B-Mode images acquired in the punctured right femoral artery of a 60 year-old female volunteer. The volunteer was randomized to manual compression enhanced by the p-GlcNAc fiber-based dressing. The B-Mode images (top row, panels (a), (b) and (c)) do not indicate bleeding or the arteriotomy. The parametric ARFI PD image 4 min after sheath removal (panel (d)) shows relatively large displacements in the position of the arteriotomy (∼ 5 μm, circled) and in the soft tissue above the artery (> 5 μm, arrows), which suggest incomplete hemostasis and the presence of pooled extravasated blood, respectively. However, 6 and 14 min after sheath removal (panels (e) and (f), respectively), arterial wall displacements at the arteriotomy are consistent with those of adjacent arterial wall tissue and there is no area of large displacement in the soft tissue above the artery, suggesting the onset of hemostasis.
FIG. 4.
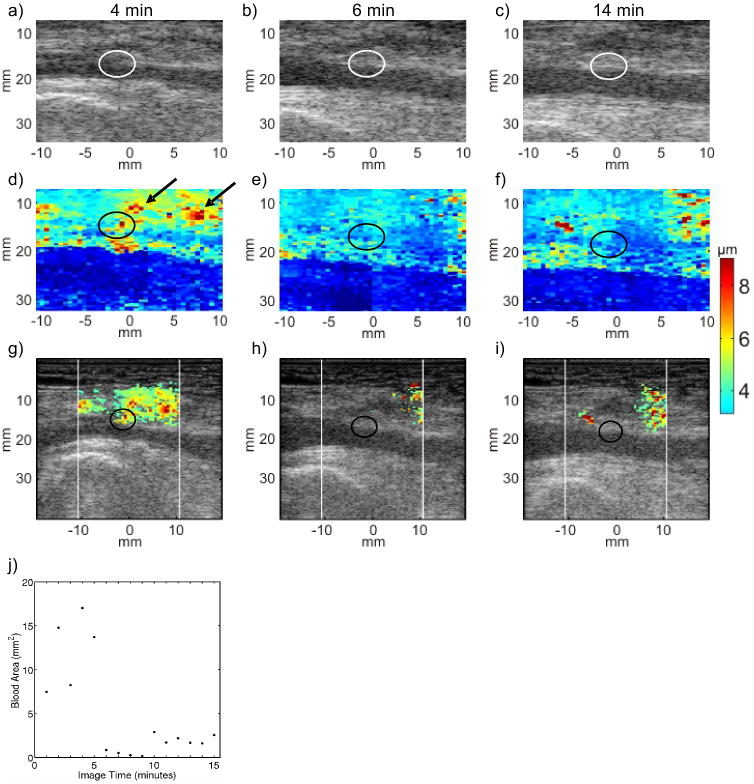
Serial B-Mode, ARFI peak displacement (PD), and hybrid ARFI/B-Mode images of the femoral arteriotomy in a 60 year-old female volunteer at 4 (left column), 6 (middle column) and 14 (right column) min following sheath removal. Hemostasis was achieved by manual compression augmented the pGlcNAc fiber based dressing. B-Mode images (top row, panels (a), (b) and (c)) indicate neither the arteriotomies (circled), nor whether hemostasis has been achieved. Raw ARFI PD images (middle row, panels (d), (e) and (f)) show a focal region of relatively large peak displacement at the arteriotomy (circled) at 4 min following sheath removal (panel d). Relatively large ARFI-induced displacement suggests extravasated blood at the 4 min time point but not at the 6 and 14 min time points (panels (e) and (f), respectively). Hybrid ARFI/B-Mode images (third row, panels (g), (h) and (i)) more clearly show that the estimated area of extravasated blood decreases at 6 min. A scatter plot of estimated extravasated blood area versus time (panel (j)) shows a drop in area at 6 min that is sustained throughout the duration of imaging, suggesting hemostasis onset at 6 min.
The hybrid ARFI/B-Mode image 4 min after sheath removal (panel (g) identifies large displacements with high displacement variance in the soft tissue above the artery while retaining the area of heightened displacement at the arteriotomy (circled). Note that 6 and 14 min after sheath removal (panels (h) and (i), respectively), the soft tissue above the artery showed little displacement variance resulting in few displacements being mapped to the hybrid images. Panel (j) shows a scatter plot of estimated extravasated blood area versus time for this serial data set. A drop in estimated extravasated blood area at the 6 min time point suggests that hemostasis was achieved approximately 6 min after sheath removal and maintained thereafter.
Figure 5 shows serial B-Mode, ARFI and hybrid ARFI/B-Mode images acquired in the punctured right femoral artery of a 52 year-old female volunteer. The volunteer was randomized to manual compression alone. Seven minutes after sheath removal, bleeding at the skin surface was observed to stop and did not resume. The corresponding ARFI PD (panel (d)) and hybrid ARFI/B-Mode (panel (g)) images acquired 7 min after sheath removal show arteriotomy displacements consistent with those achieved in adjacent arterial wall tissue (circled) and relatively low displacement in the soft tissue above the artery, suggesting that hemostasis at the femoral arteriotomy was achieved. The cardiologist reduced manual compression pressure after the 7 min data acquisition. ARFI PD and hybrid ARFI/B-Mode images at 8 min after sheath removal (panels e and h) depict a different tissue response. The arteriotomy is observed to be highly displaceable (circled), and a cluster of large displacements consistent with extravasated blood is observed above the artery (arrows). Fourteen minutes after sheath removal (panels (f) and (i)), the arteriotomy remains highly displaceable (circled), and the area of large displacements with high displacement variance classified as extravasated blood has grown (arrows), suggesting continued bleeding. Panel (j) illustrates a scatter plot of estimated extravasated blood area versus time for this serial data set. The estimated area is low between the 5 and 7 min time points but then increases at 8 min and remains high thereafter. Because re-bleeding was never observed at the skin surface, pressure was not increased after the 8 min time-point. All pressure was removed at 15 min. This patient developed a hematoma.
FIG. 5.
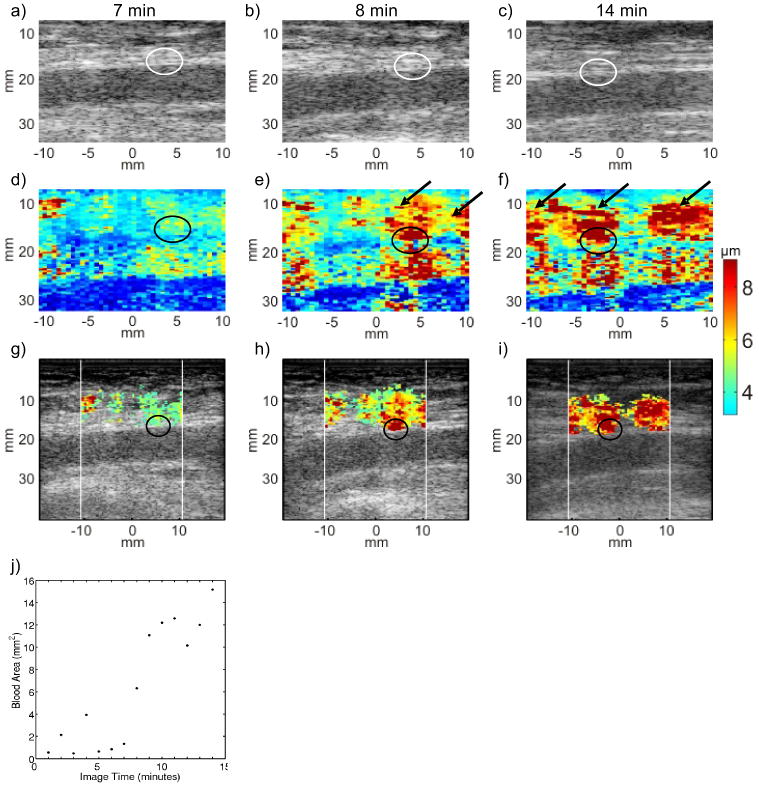
Serial B-Mode, ARFI peak displacement (PD) and hybrid ARFI/B-Mode images of the femoral arteriotomy in a 52 year-old female volunteer at 7 (left column), 8 (middle column) and 14 (right column) min following sheath removal. Hemostasis was achieved by manual compression alone. B-Mode images (top row, panels (a), (b) and (c)) offer no indication of arteriotomy (circled) or bleeding. The raw ARFI PD image (middle row) 7 minutes post sheath removal (panel (d)) shows displacement in the position of the arteriotomy (circled) comparable to that of the adjacent arterial wall tissue, with uniformly low displacement in the soft tissue above the artery. Pressure was reduced after 7 min. The raw ARFI PD image 8 min following sheath removal (panel (e)) shows larger displacement in the position of the arteriotomy (circled) as well as large displacements in the tissue above the artery (arrows), suggesting an increase in the volume of pooled extravasated blood. Fourteen min following sheath removal (panel (f)), large displacements are still seen at the arteriotomy (circled) and in the soft tissue (arrows), suggesting continued bleeding. The hybrid ARFI/B-Mode images (third row, panels (g), (h) and (i)) more clearly indicate the increasing estimated extravasated blood area. Large displacements at the arteriotomy (circled, panels (h) and (i) are preserved. The scatter plot of estimated extravasated blood area versus time (panel (j)) shows an initial drop in area at 5 min followed by increasing area from 8-15 min, which is suggestive of re-bleeding. Notably, this patient developed a hematoma.
Discussion
This study demonstrates the feasibility of implementing ARFI imaging of hemostasis at arteriotomies during manual compression with and without hemostatic dressing in patient volunteers. The preliminary results suggest that ARFI imaging is capable of delineating subcutaneous hemostasis at femoral arteriotomies. Larger ARFI-induced displacements were observed at arteriotomies than in adjacent, intact arterial wall soon after sheath removal. Large displacements observed in the soft tissue above arteriotomies in positions of relatively high displacement variance were considered to correspond to pooled extravasated blood.
Our results show a statistically-significant (p < 0.0069, Wilcoxon) reduction in ARFI derived time to hemostasis when the p-GlcNAc fiber-based dressing was employed of approximately 27% (Table 1). However, previous research has shown a 37% reduction in time to hemostasis associated with the dressing.11 This apparent underestimation of the reduction in time to hemostasis with ARFI ultrasound may be attributable to deficiencies on our experimental methods. Our protocol specified serial ARFI imaging for a total imaging period of only 15 minutes. For four of the 10 patients treated with manual compression alone, time to hemostasis was determined by the last imaging time point because there was no observed reduction in estimated extravasated blood area within the 15 min imaging period. Had imaging continued beyond 15 minutes, we may have measured longer times to hemostasis in these patients, and the difference in average ARFI-derived time to hemostasis may have been closer to the expected 37%. We will design future experimental protocols to include longer serial imaging durations.
An additional factor that may have confounded our results is the application of manual compression. Consistent with standard care practices, more forceful manual compression was applied for longer periods when bleeding was observed at the skin surface. In patients treated with the hemostatic dressing, bleeding at the skin surface is likely to have stopped sooner, and therefore, it is likely that less manual compression was applied. Had both patient populations been treated with consistently-applied manual compression, the difference in ARFI derived time to hemostasis may have been closer to the anticipated 37%. We did not consistently record whether or not manual compression was reduced at the seven minute time point in this study nor did we attempt to otherwise quantify the degree of pressure applied by the cardiologist. We will do so in future investigations. We will also consider standardizing the degree of compression by using a clinically approved clamping device.
Another limitation is our method of extravasated blood signal identification, which thresholds on mean values to identify extravasated blood in soft tissue above the artery. This relative thresholding technique is advantageous in that it can be adaptively applied to different image acquisitions and data sets; however, it does not take into account that no significant extravasated blood pool may be present. Therefore, ARFI peak displacement data may be mapped into hybrid ARFI/B-Mode images in positions that do not correspond to extravasated blood, and extravasated blood area may be overestimated. We have compensated for this by only mapping large displacements (> 4μm) into hybrid ARFI/B-Mode images and considering only large displacements in our calculations of extravasated blood area. Despite this limitation, we feel that the juxtaposition of ARFI and anatomical data in hybrid images is useful to deciphering hemostasis at the femoral artery in our presentation of these data (as in the case of color flow Doppler imaging) and we are working to improve our methods for differentiating extravasated blood signal.
An additional area for enhanced performance of in vivo ARFI hemostasis assessment is improved transducer technology. The one-dimensional linear array employed in this study offered resolution on the order of hundreds of microns. This resolution was sufficient for monitoring bleeding from femoral artery punctures, where extravasated blood pool dimensions were expected to be >1mm, but transducers with better resolution could enable ARFI hemostasis assessment from smaller vessels or slower bleeds that generate blood pools with dimensions <0.5 mm. Moreover, three-dimensional imaging transducers could improve estimation of time to hemostasis onset by monitoring extravasated blood volume as opposed to cross-sectional area, which is likely to be a more accurate indication of active bleeding given the potential asymmetric geometries of blood pools. Three-dimensional ARFI imaging could also allow quantification of lost blood volume as well as bleeding and diffusion rates. For sufficiently slow bleeding rates, three-dimensional ARFI imaging may be possible with the currently employed one-dimensional linear array transducer by sweeping multiple acquisitions across the arteriotomy region. However, human anatomy near the femoral artery could make maintaining parallel imaging planes during the sweep difficult and sophisticated motion rejection and image registration algorithms would be required.
Finally, it is important to note that treatment of arteriotomies following cardiac catheterization – whether an APCD, hemostatic dressing or manual compression alone is used – is a blinded procedure in modern standard of care. The clinician must use his/her judgment as to when hemostasis is obtained and when it is safe to release manual pressure. In these studies, ARFI imaging was not performed in real-time. However, had the ARFI images of figure 5 been available to the cardiologist while he was treating the volunteer, he may have elected to resume stronger pressure and the hematoma may have been avoided. In this manner, ARFI imaging of hemostasis at femoral arteriotomies has the potential to reduce vessel complications and individualize manual compression and time to ambulation following catheterization.
Conclusions
In this pilot clinical study conducted in 20 adult patient volunteers undergoing percutaneous diagnostic cardiac catheterization, we observed that arteriotomies were more highly displaceable by ARFI excitation than adjacent arterial wall tissue soon after sheath removal. We also observed that the area of relatively large displacements with high variance in the soft tissue above the artery increased with time after sheath removal. This was consistent with our expectation that pooled extravasated blood would decorrelate faster than soft tissue and experience relatively large peak displacement in response to ARFI excitation and was considered to be indicative of bleeding. Custom software was developed to render hybrid ARFI/B-Mode images and determine ARFI-derived time to hemostasis, which was on average 27% shorter (9.44 vs. 13.00 min; p = 0.0069) when a p-GlcNAc fiber-based dressing was used to augment manual compression in this investigation.
Acknowledgments
Funding from Marine Polymer Technologies, Inc., Danvers MA, supported this work. We thank the staff, cardiology fellows and attendings at the C.V. Richardson Cardiac Catheterization Laboratory at University of North Carolina at Chapel Hill for their support.
References
- 1.Behler RH, Nichols TC, Bellinger DA, et al. ARFI ultrasound for in vivo hemostasis assessment post cardiac catheterization, part I: preclinical studies. Ultrasonic Imaging. 2009;31:151–158. doi: 10.1177/016173460903100301. [DOI] [PMC free article] [PubMed] [Google Scholar]
- 2.Koreny M, Riedmuller E, Nikfardjam M, et al. Arterial puncture closure devices compare with standard manual compression after cardiac catheterization: systematic review and meta-analysis. J Amer Med Ass. 2004;291(3):350–357. doi: 10.1001/jama.291.3.350. [DOI] [PubMed] [Google Scholar]
- 3.Dauerman HL, Applegate RJ, Cohen DJ. Vascular closure devices. J Amer Coll Cardiol. 2007;50:1617–26. doi: 10.1016/j.jacc.2007.07.028. [DOI] [PubMed] [Google Scholar]
- 4.Doyle BJ, Konz BA, Lennon RJ, et al. Ambulation 1 hour after diagnostic cardiac catheterization: a prospective study of 1009 procedures. Mayo Clinic Proc. 2006;81:1537–1540. doi: 10.4065/81.12.1537. [DOI] [PubMed] [Google Scholar]
- 5.Nikolsky E, Mehran R, Halkin A, et al. Vascular complications associated with arteriotomy closure devices in patients undergoing percutaneous coronary procedures: a meta-analysis. J Am Coll Cardiol. 2004;44:1200–1209. doi: 10.1016/j.jacc.2004.06.048. [DOI] [PubMed] [Google Scholar]
- 6.Carey D, Martin JR, Moore CA, et al. Complications of femoral artery closure devices. Catheter Cardiovasc Interv. 2001;52:3–7. doi: 10.1002/1522-726x(200101)52:1<3::aid-ccd1002>3.0.co;2-g. [DOI] [PubMed] [Google Scholar]
- 7.Dangas G, Mehran R, Kokolis S, et al. Vascular complications after percutaneous coronary interventions following hemostasis with manual compression versus arteriotomy closure devices. J Am Coll Cardiol. 2001;38:638–641. doi: 10.1016/s0735-1097(01)01449-8. [DOI] [PubMed] [Google Scholar]
- 8.Nehler MR, Lawrence WA, Whitehill TA, et al. Iatrogenic vascular injuries from percutaneous vascular suturing devices. J Vasc Surg. 2001;33:943–947. doi: 10.1067/mva.2001.115002. [DOI] [PubMed] [Google Scholar]
- 9.Sohail MR, Khan AH, Holmes DR, Jr, et al. Infectious complications of percutaneous vascular closure devices. Mayo Clin Proc. 2005;80:1011–1015. doi: 10.4065/80.8.1011. [DOI] [PubMed] [Google Scholar]
- 10.Wille J, Vos JA, Overtoom TT, et al. Acute leg ischemia: the dark side of a percutaneous femoral artery closure device. Ann Vasc Surg. 2006;20:278–281. doi: 10.1007/s10016-006-9005-3. [DOI] [PubMed] [Google Scholar]
- 11.Najjar SF, Healey NA, Healey CM, et al. Evalulation of poly-n-acetyl glucosamine as a hemostatic agent in patients undergoing cardiac catheterization: A double-blind, randomized study. J Trauma. 2004;57:S38–S41. doi: 10.1097/01.ta.0000136749.20063.f0. [DOI] [PubMed] [Google Scholar]
- 12.Palmer BL, Gantt DS, Lawrence ME, et al. Effectiveness and safety of manual hemostasis facilitated by the SyvekPatch with one hour of bedrest after coronary angiography using six-French catheters. Am J Cardiol. 2004;93:96–97. doi: 10.1016/j.amjcard.2003.08.077. [DOI] [PubMed] [Google Scholar]
- 13.Nader RG, Garcia JC, Drushal K, Pesek T. Clinical evaluation of SyvekPatch in patients undergoing interventional, EPS and diagnostic cardiac catheterization procedures. J Invasive Cardiol. 2002;14:305–307. [PubMed] [Google Scholar]
- 14.Palmeri M, Nightingale K. On the thermal effects associated with radiation force imaging in soft tissue. Ultrasound in Medicine and Biology. 2004;26:29–40. [Google Scholar]
- 15.Behler R, Merricks E, Nichols T, Gallippi C. A rigid wall approach to physiological motion rejection in arterial ARFI imaging: Simulation and in vivo demonstration. Proc IEEE Ultrasonics Symp. 2007:359–364. [Google Scholar]
- 16.Booi RC, Carson PL, O'Donnell M, et al. Diagnosing cysts with correlation coefficient images from 2-dimensional freehand elastography. J Ultrasound Med. 2007;26:201–207. doi: 10.7863/jum.2007.26.9.1201. [DOI] [PubMed] [Google Scholar]
- 17.Pan TT, Chiang HK. Ultrasound low-velocity flow estimation using cross-correlation and decorrelation: a thread phantom study. Med Engineer Phys. 2007;19:602–614. doi: 10.1016/j.medengphy.2006.06.006. [DOI] [PubMed] [Google Scholar]
- 18.Li W, van der Steen AFW, Lancee CT, et al. Temproal correlation of blood scattering signals in vivo from radiofrequency intravascular ultrasound. Ultrasound Med Biol. 1996;22:583–590. doi: 10.1016/0301-5629(96)00023-3. [DOI] [PubMed] [Google Scholar]
- 19.Ledoux LA, Willigers JM, Brands PJ, et al. Experimental verification of the correlation behavior of analytic ultrasound radiofrequency signals received from moving structures. Ultrasound Med Biol. 1998;24:1381–1396. doi: 10.1016/s0301-5629(98)00101-x. [DOI] [PubMed] [Google Scholar]