Abstract
Objective
To evaluate the use of inflation-fixed lung tissue for emphysema quantification with CT and 3He MR diffusion imaging.
Methods
Fourteen subjects representing a range of chronic obstructive pulmonary disease severity who underwent complete or lobar lung resection were studied. CT measurements of lung attenuation and MR measurements of the hyperpolarized 3He apparent diffusion coefficient (ADC) in resected specimens fixed in inflation with heated formalin vapor were compared with measurements obtained before fixation.
Results
The mean CT emphysema index was 56% ± 17% before and 58% ± 19% after fixation (P=0.77; R=0.76). Index differences correlated with differences in lung volume (R2=0.47). The mean 3He ADC was 0.40 ± 0.15 cm2/sec before and 0.39 ± 0.14 cm2/sec after fixation (P=0.03, R=0.98). The CT emphysema index and the 3He ADC were correlated before (R=0.89) and after fixation (R=0.79).
Conclusion
Concordance of CT and 3He MR imaging measurements in unfixed and inflation-fixed lungs supports the use of inflation-fixed lungs for quantitative imaging studies in emphysema.
INTRODUCTION
Emphysema can be quantified noninvasively from CT measurements of lung attenuation and MR measurements of the apparent diffusion coefficient (ADC) of hyperpolarized 3He.1,2 Technical parameters such as the CT tube current,3,4 section thickness,5 and reconstruction algorithm,6,7 and the MR diffusion time8 and gradient strength9 may influence these measurements. For the controlled evaluation of the impact of such scanning and image reconstruction parameters on quantitative imaging measurements, the ability to perform repeated scans of the same lungs under constant conditions would be desirable.
Fixation of the lung in inflation using heated formalin vapor is a means of obtaining a histologically10–12 and radiographically11,12 accurate representation of in vivo inflated state of the lung. To our knowledge, however, the quantitative CT imaging characteristics of inflation-fixed lungs and the ability to perform 3He MR imaging with inflation-fixed lungs have not been assessed. We hypothesized that lung tissue fixed in inflation with heated formalin vapor could serve as a realistic physical model for quantitative CT and 3He MR measurements of emphysema. To evaluate this, we compared CT and 3He MR measurements of emphysema in lungs scanned before and after fixation.
MATERIALS AND METHODS
Subjects and Lung Specimens
This investigation was performed with approval of the local institutional review board, and informed consent was obtained from patients or relatives as appropriate.
The specimens were acquired from 14 patients (Table 1): 5 who had lobectomy for treatment of lung cancer; 7 who had lung transplantation for end-stage chronic obstructive pulmonary disease; and 2 organ donor victims of fatal head trauma without radiographic pulmonary infiltrates. Both lungs were obtained from four of the lung transplant patients and one of the head trauma victims, for a total of 19 lung specimens from the 14 subjects. There was no clinical evidence of active lung infection or history of asthma or diffuse lung disease other than emphysema, and no pulmonary infiltrate or more than subsegmental atelectasis on preoperative chest radiograph or CT scan. Lung cancer did not involve the central bronchi occupied less than 25% of the lobe to be resected. Previous CT and MR imaging-pathology correlation studies involving the lung specimens used in this study confirmed a wide range of airspace enlargement characteristic of emphysema as measured by quantitative histology.13,14
TABLE 1.
Subject characteristics
| Transplant (N=7) | Lobectomy (N=5) | Donor (N=2) | |
|---|---|---|---|
| F:M | 4:3 | 3:2 | 0:2 |
| Age, yrs (range) | 58.6 ± 3.2 (54.3–63.8) | 67.9 ± 4.0 (62.3–73.6) | 21.5 (21–22) |
| Smoking history, pack years (range) | 56 ± 21 35–90 | 81 ± 39 42–135 | NA* |
| FEV1, % of predicted (range) | 18 ± 4 (13–25) | 72 ± 21 (45–95) | NA |
| FVC, % of predicted (range) | 53 ± 19 (36–90) | 98 ± 16 (78–118) | NA |
| TLC, % of predicted (range) | 145 ± 19 (113–171) | 129 ± 32 (95–180) | NA |
| RV, % of predicted (range) | 285 ± 79 (146–395) | 186 ± 86 (111–320) | NA |
| DLCO, % of predicted (range) | 28 ± 10 (15–45) | 71 ± 12 (53–82) | NA |
Values are mean ± std. dev.
FEV1-forced vital capacity in 1 second; FVC-forced vital capacity; TLC-total lung capacity; RV-residual volume; DLCO-diffusing capacity for carbon monoxide
The 21-year-old subject smoked an unknown amount for two years, and the 22-year old subject had a one pack year smoking history.
Upon resection, the deflated lobectomy and pneumonectomy specimens were stored in a refrigerated room kept at 4.4° C. The specimens were prepared for imaging and formalin vapor fixation within one day in the vast majority of cases, and within three days in all cases. The preparation involved attachment of a polytetrafluoroethylene graft and plastic connector with flexible tubing to the bronchial stump for inflation of the lung, with subsequent sealing of any air leaks.15
Lung Fixation
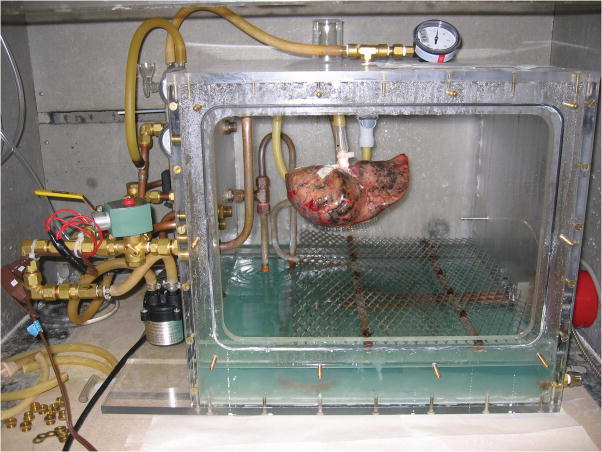
The lungs were fixed in inflation for 4–10 hours with heated formalin vapor using a method based on previously reported techniques.10–12 This method prevents the collection of water the lung airspaces by continuous, externally-driven ventilation of the lung. In summary, the lung specimen was suspended inside a sealed Plexiglas chamber by tubing connected from the bronchus to a ventilation circuit (Fig. 1). Heated formalin vapor was produced by a heating coil within a pool of 50% formalin in the bottom of the chamber heated to 46°C. The lung was ventilated under positive pressure of 12–25 cm H2O using a diaphragm pump, with an electronically controlled circuit that provided a brief exhalation (< 1 sec) every 6–8 sec.
FIGURE 1.
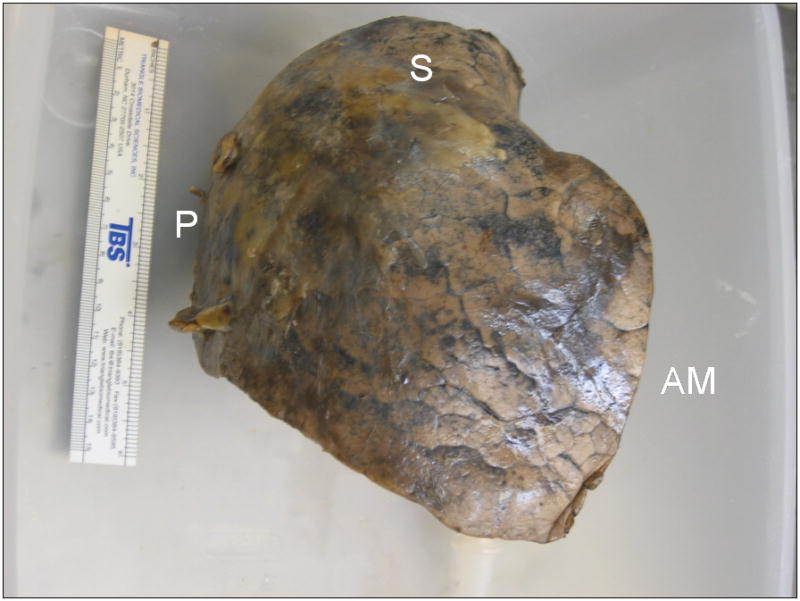
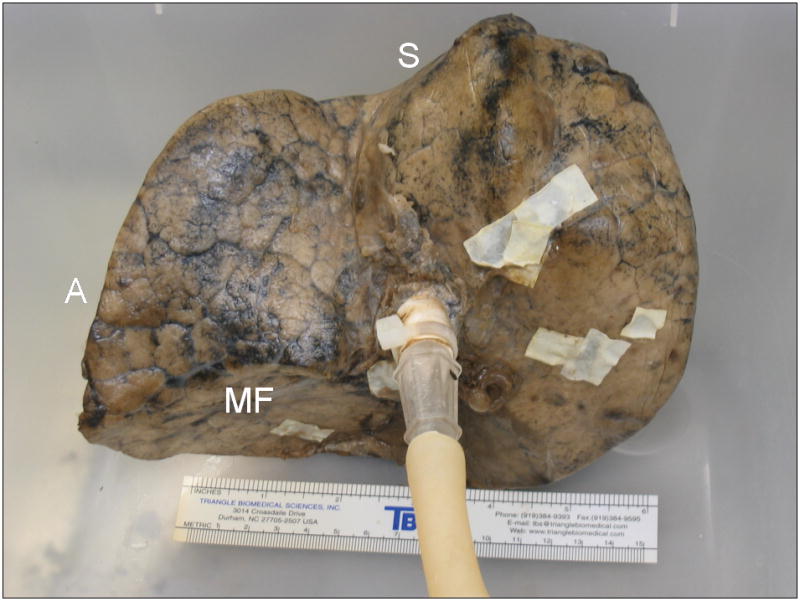
Process of fixation in inflation with heated formalin vapor. A, Right upper lobe, resected from a 68-year-old man due to a 2 cm bronchoalveolar cell carcinoma, suspended by ventilation tubing within fixation chamber at the start of the fixation process. The front panel of the chamber has been removed. The fixation apparatus consists of a heating coil within a pool of 37% formalin inside the chamber, and an electronically-controlled ventilation circuit connected to a diaphragm pump, seen to the left of the chamber. B, Anterolateral surface view of the inflation-fixed lobe removed from the chamber after 10 hours of fixation. A 15 cm ruler is shown for scale. C, Medial surface view shows connection to bronchus and multiple glued patches of latex cut from medical gloves used to seal leaks in the pleural surface. S-superior aspect; P-posterior aspect; AM-anteromedial aspect; A-anterior aspect; MF-minor fissure surface.
Imaging Studies
CT
CT was performed preoperatively in vivo, and postoperatively on the inflation-fixed specimens. Preoperative CT scans were not obtainable for the two head trauma victims, or for two of the lung cancer patients due to patient availability and scheduling constraints. Thus, in vivo and post-fixation CT images of 14 specimens from 10 subjects were available for comparison. The in vivo CT images were acquired within 24 hours of surgery in all but two cases, in which CT was performed 7 and 9 days prior to surgery.
CT scanning was performed on a Siemens 16-row multidetector scanner (Sensation 16) at full inspiration, without intravenous contrast, using a low-radiation-dose technique (30 effective mAs). Technical parameters were: 120 kVp; 90 mA; scan time 0.5 sec; pitch 1.5; and detector collimation 0.75 mm. Specimens were scanned in a plastic tub in an orientation approximating that during in vivo scanning with the patient supine. All CT scans were reconstructed at 10 mm slice thickness using a medium-smooth reconstruction filter (Siemens’ B30f), except for the scan of one lung transplant patient in which a sharp reconstruction filter (Siemens’ B60f) was used for both the in vivo and post-fixation images.
MR
Pre-fixation MR scanning was performed on the resected lung specimens rather than preoperatively in vivo. This was done to ensure a uniform distribution of 3He gas for measurement of the ADC throughout the lungs before and after fixation, as regional heterogeneity of 3He gas distribution with multifocal defects may be present after a single breath inhalation in vivo in chronic obstructive pulmonary disease.16–18
A pre-fixation MR scan was not obtainable for the lung specimens of three patients due to scanner-related technical problems or scheduling constraints. Thus, prefixation and post-fixation 3He MR scans of 13 specimens from 11 subjects were available for comparison. The pre-fixation MR scans were performed within 2 days after resection in all but two cases, in which MR was performed on specimens from lung transplant patients 4 and 9 days after resection. Post-fixation MR scanning was performed with the fixed, inflated lung specimens positioned in the same orientation as the pre-fixation scan.
The MR scans were performed on a Siemens 1.5 T MR scanner (Magnetom Vision), using a lab-built, transmit-receive, single-turn solenoid coil tuned to the 3He resonance frequency of 48.47 MHz. The 3He gas was laser-polarized by the spin-exchange technique19 using a lab-built apparatus or a commercial polarizer (GE Healthcare), both of which provided polarization levels of 30–40%. To prevent oxygen-induced depolarization of the 3He gas,20 the lung specimens, tubing, and 1 liter gas delivery syringe were purged with 100% N2 gas immediately prior to imaging. Approximately 350–500 ml of 3He were mixed with 500–650 ml of N2 in the delivery syringe. This was injected to an intrapulmonary pressure of 13–18 cm H20, withdrawn, and reinjected to the same pressure two to three more times to distribute 3He gas throughout the lung. The inflation-fixed lungs had limited distensibility and contained small leaks that resulted in prompt equilibration of the lungs to atmospheric pressure after gas was injected.
The MR images were obtained using two interleaved 2D gradient echo pulse sequences, with a bipolar diffusion gradient applied between imaging pulses.21 Technical parameters were: diffusion time (beginning of positive lobe to beginning of negative lobe of bipolar gradient pulse) = 1.6 msec; b-value (γ2G2t3 , where γ is the nuclear gyromagnetic ratio, G is the gradient amplitude, t is the bipolar pulse duration, and is a dimensionless number related to the shape of the pulse 22) = 0 s/cm2 for the first image and 1.38 s/cm2 for the second image; repetition time = 18.2 msec; echo time = 6.0 msec; flip angle = 1–5°; slice thickness = 1.0 cm; no interslice gap; matrix = 64 x 64; and field of view = 35 cm (5.5 mm x 5.5 mm pixel dimensions).
Image Analysis
CT
The CT images were analyzed using the Pulmonary Analysis Software Suite and Emphysema Profiler desktop computer program (VIDA Diagnostics, Iowa City, IA) .23,24 The outer lung margins were automatically segmented by the program on the in vivo scans, and manually traced on the ex vivo specimen scans. For the lobectomy cases in which lobar segmentation of the in vivo CT was required for comparison with the ex vivo fixed specimen CT, the automated segmentation result was edited manually to further segment the lobe. An emphysema index was quantified as the percentage of all lung pixels having attenuation lower than −910 H.25 Additional calculated lung histogram attenuation statistics included the mean attenuation and the total segmented lung volume.
MR
The MR images were analyzed using custom software written in C. ADC values were calculated for each pixel according to the formula ADC = 1/b × ln(S0/Sb), where b=1.38 s/cm2,S0 is the signal intensity at b=0 s/cm2, and Sb is the signal intensity at b=1.38 s/cm2. Emphysema was quantified as the mean ADC of all voxels in each specimen having signal intensity at least 2.5 times the background noise level. The lung volume was determined as the total volume of all voxels used to calculate the mean ADC.
Statistical Analysis
Each lung specimen was processed individually and thus treated as a separate data point. Data are presented as mean values ± standard deviation. Imaging measurements obtained before and after fixation were compared using two-tailed, paired t-tests and Pearson correlation. Calculations were made using Microsoft Excel 2003 (Redmond, WA). P values < 0.05 are considered statistically significant.
RESULTS
All lungs were successfully fixed in inflation. The CT appearance of the fixed lungs resembled the in vivo CT appearance (Fig. 2A). With MR imaging, the 3He injected via the ventilation syringe became homogeneously distributed throughout the lung or lobe both before and after fixation (Fig. 2B).
FIGURE 2.
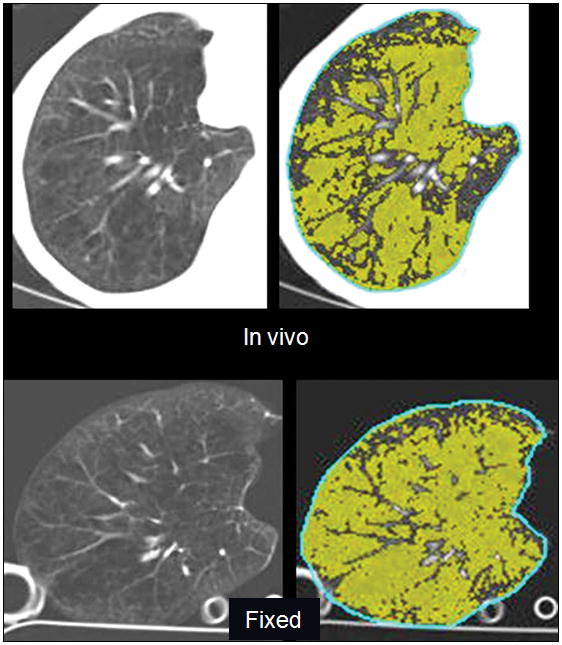
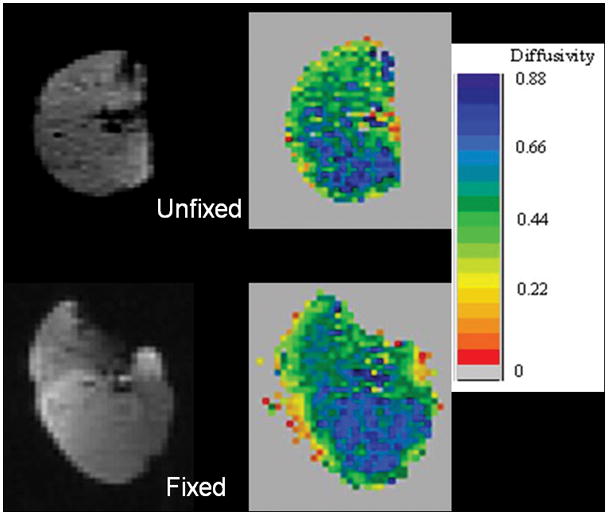
A, CT images of right lung of a 58-year-old woman with severe emphysema obtained in vivo prior to transplantation, and after fixation of the explanted specimen, show a similar appearance of vascular anatomy and emphysematous changes (left), and similar areas of pixels with attenuation <−910 H (right, highlighted in green). Emphysema index for the whole lung was 62% in vivo and 76% in the fixed specimen. B, 3He MR images from same lung as in (A) show a uniform distribution of 3He signal on the 3He-density images (left). Despite a 15% increase in volume on the post-fixation images, note similar distribution of ADC values on ADC maps (right) before and after fixation. Mean whole-lung ADC was 0.55 cm2/sec before fixation and 0.54 cm2/sec after fixation.
CT in vivo vs. post-fixation
There was no significant difference between the mean in vivo and post-fixation CT emphysema index or mean lung attenuation, and the measurements were correlated (Table 2, Fig. 3B). In 9 of the 14 specimens, the post-fixation CT emphysema index was within 6 percentage points of the in vivo index. In the other 5 specimens, the postfixation index was from 12 to 24 percentage points higher or lower than the in vivo index; these 5 specimens were all from lung transplant patients with severe emphysema in whom the in vivo index was greater than 60%.
TABLE 2.
Comparison of pre- and post-fixation CT and 3He MR measurements
| Pre-fixation | Post-fixation | Mean difference | Pa | Rb | |
|---|---|---|---|---|---|
| CT (14 specimens) | |||||
| CT emphysema index (%) | 0.56 ± 0.17 | 0.58 ± 0.19 | 0.01 ± 0.12 | .77 | .76 |
| Mean attenuation (HU) | −890 ± 24 | −891 ± 36 | −2 ± 31 | .71 | .54 |
| CT volume (ml) | 3135 ± 1551 | 2792 ± 1261 | −343 ± 598 | .05 | .93 |
| MR (13 specimens) | |||||
| ADC (cm2/s) | 0.40 ± 0.15 | 0.39 ± 0.14 | −0.02 ± 0.03 | .02 | .98 |
| MR volume (ml) | 1946 ± 1173 | 2087 ± 1147 | 141 ± 752 | .51 | .79 |
ADC-apparent diffusion coefficient of 3He
Two-tailed, paired t-test pre- vs. post- fixation
Pearson correlation coefficient pre- vs. post-fixation (all P<0.05)
FIGURE 3.
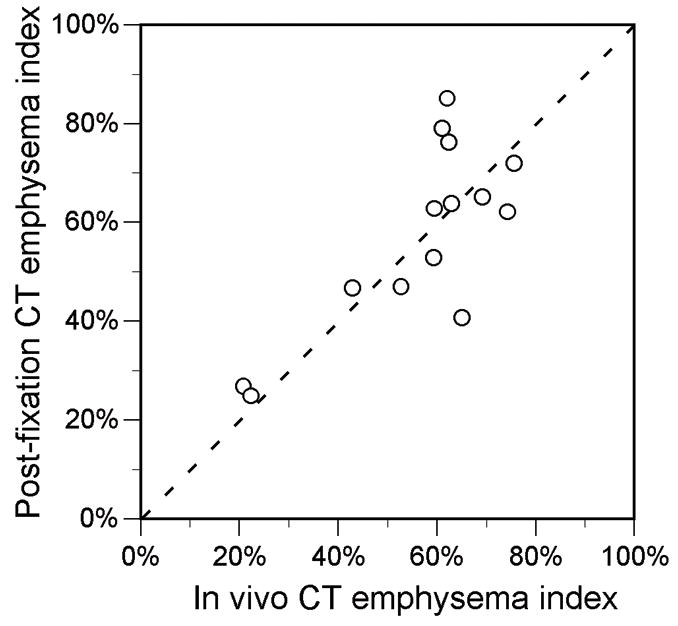
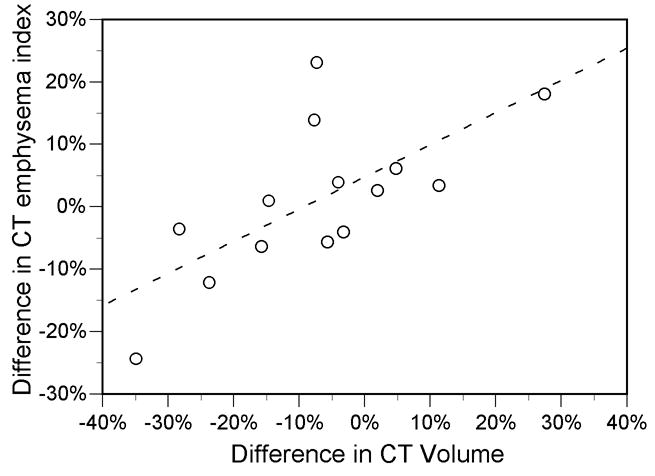
A, Scatter plot shows correlation between in vivo and fixed specimen CT emphysema index measurements (R=0.76, P=0.001). Dotted line is line of identity. B, Scatter plot shows relationship between difference in CT lung volume and difference in CT emphysema index (R =0.68, P<0.01). Values are post-fixation minus in vivo measurements. Solid line is from linear regression (slope=0.90, y-intercept=−0.08).
The post-fixation specimen volume measured by CT correlated with the in vivo volume (Table 2). However, the mean post-fixation volume measured by CT was 11% smaller than the in vivo volume, and ranged from 27% smaller to 35% larger. The in vivo-to-post-fixation difference in CT-measured lung volume correlated with the difference in emphysema index (R=0.68, P<0.01) (Fig. 3B).
3He MR pre- vs. post-fixation
A statistically significant but minimal decrease in the mean ADC of 0.01 cm2/s was found on the post-fixation scans, and the pre-fixation and post-fixation ADC were strongly correlated (Table 2, Fig. 4). In 9 of the 13 specimens, the post-fixation ADC measurement was within 0.02 cm2/s (5%) of the pre-fixation value. In the other 4 specimens, the post-fixation ADC was 0.04 to 0.06 cm2/s (10–14%) lower than the pre-fixation ADC.
FIGURE 4.
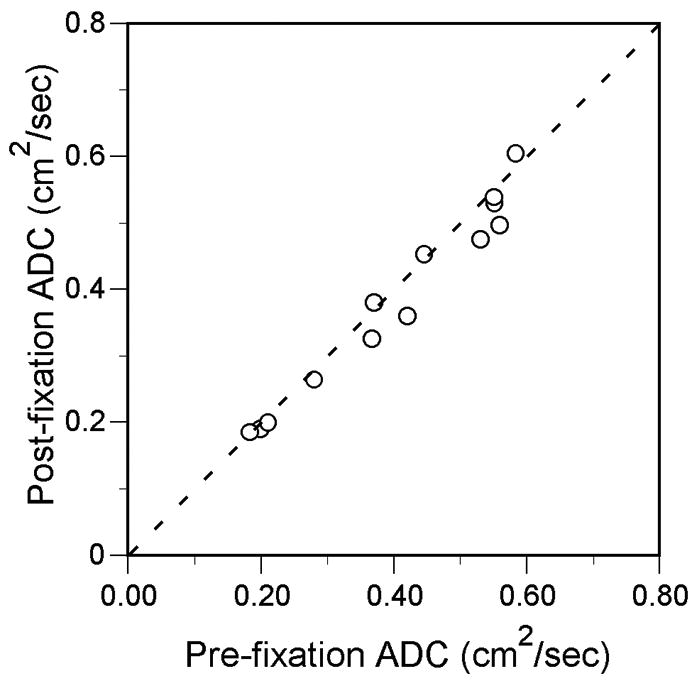
Scatter plot shows correlation between individual specimen 3He ADC measurements before and after fixation (R=0.98, P<0.001). Dotted line is line of identity.
The post-fixation specimen volume measured by 3He MR correlated with the prefixation volume (Table 2). There was no statistical difference between the mean pre- and post-fixation 3He MR volumes (Table 2), though the post-fixation measurements ranged from 59% smaller to 107% larger than the pre-fixation measurements. There was a non-significant trend toward correlation between the pre-post fixation differences in volume and the differences in ADC measurements (R=−0.47, P=0.10).
CT vs. 3He MR
The CT emphysema index and the 3He ADC were correlated in the 8 cases before fixation and in the 16 cases after fixation in which both CT and MR were performed (Fig. 5). The CT and 3He MR-measured lung volume also were correlated in the 8 common pre-fixation cases (R=0.78, P=0.02) and 16 common post-fixation cases (R=0.94, P<0.001). However, there was a trend for the CT volume to be greater than the 3He MR volume: the mean volume of the 8 common pre-fixation cases was 2899 ± 2019 ml for CT vs. 1934 ± 1308 ml for 3He MR (P=0.07), and the mean volume of the 16 common postfixation cases was 2663 ± 1249 ml for CT vs. 2455 ± 1019 ml for 3He MR (P=0.09).
FIGURE 5.
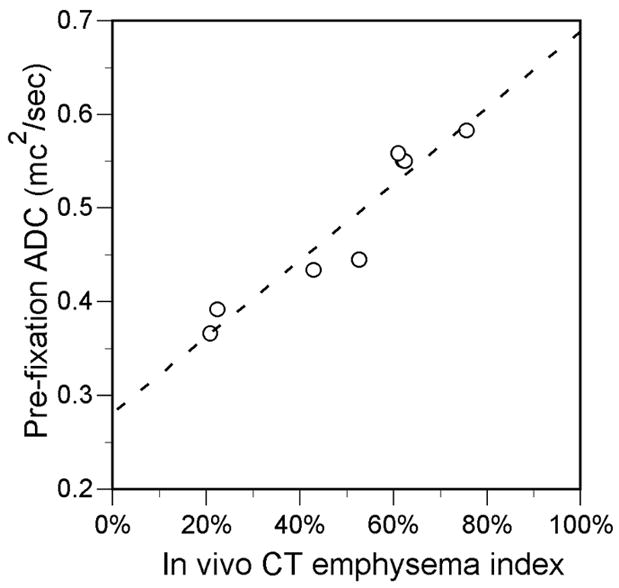
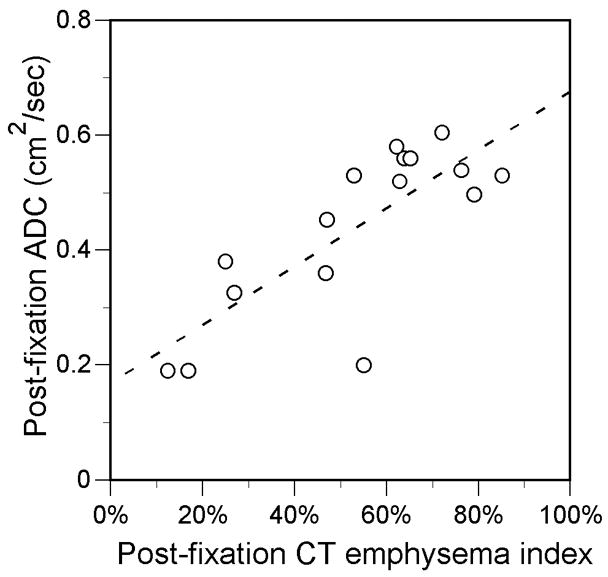
Scatter plots show relationship between CT emphysema index and 3He ADC measurements obtained in the same individual specimens. A, Before fixation (R=0.95, P<0.001; slope=0.41, y-intercept=0.28). B, After fixation. (R=0.78, P<0.001; slope=0.51, y-intercept=0.17) fixation. Solid lines are from linear regression.
DISCUSSION
Materials such as cork,26 synthetic foam,27 and dried potato flakes28 have been used to investigate the influence of technical factors on CT measurements in the low attenuation range of lung tissue. Although these materials may produce appropriate attenuation values, they do not replicate the complex structure of normal or emphysematous lungs. Thus, they may not be ideal for assessing technical issues related to CT emphysema quantification. Preparation of explanted lungs for radiographic and CT imaging studies by instilling and subsequently draining liquid formalin inflation has been described, though the effects of this method on the quantitative imaging characteristics of the lungs were not fully evaluated.29,30
Previous studies have shown that fixation of the lung in inflation with heated formalin vapor preserves its microscopic architecture.11,12,31 Good correlation between subjective emphysema grading of CT scans of inflation-fixed lungs and pathologic grade has been demonstrated.32 Our study shows that lung tissue fixed in inflation with heated formalin vapor also retains the CT and 3He diffusion MR imaging characteristics relevant to emphysema quantification. This supports the use of inflation-fixed lung tissue as a highly realistic phantom for technical studies involving CT and 3He MR quantification of emphysema.
The concordance of post-fixation specimen CT attenuation measurements with measurements obtained from the preoperative in vivo CT scans was good on average, but was somewhat inconsistent across subjects. Differences between the in vivo and postfixation volume of the lung were found to be a major reason for this, accounting for nearly half of the variability in the emphysema index measurements (Fig. 3b), similar to previous estimates.33,34 Unfortunately, the post-fixation volume of air in the lung, which depends on the distending pressure during fixation, the elasticity of the tissue after fixation, and the amount of formalin-induced tissue shrinkage, is difficult to control in a predictable manner.
It is likely that variation in the degree of exsanguination of the lungs during removal also contributed to the variation in the CT emphysema index between the in vivo and ex vivo scans, as a greater degree of exsanguination and less intravascular blood would be expected to increase the index, and vice-versa. Variability in the amount of formalin vapor absorbed by the lung tissue, or collection of fluid in the airspaces during fixation should have a similar effect. However, we did not measure lung weight before and after fixation, and could not assess whether there were differences that correlated with differences in CT attenuation measurements. X-ray beam attenuation by chest wall and mediastinal structures, and lung motion artifacts caused by cardiac pulsation, also may have had a variable impact on the in vivo lung attenuation measurements that was not present on the specimen scans.
In contrast to the CT measurements, a statistically significant decrease in the ADC was found on the post-fixation 3He MR diffusion measurements. However, this difference of 0.01 cm2/sec was exceedingly small, and there was a high degree of direct concordance for the pre- and post-fixation MR measurements in most individual cases. This suggests that the size and architecture of the lung airspaces in their inflated state is preserved by the fixation process.
Relatively reduced distention of the airspaces after fixation, interstitial thickening due to absorption of formalin, or collection of fluid in the airspaces would be expected to reduce the ADC, while fixing the lung in an overinflated or dried state would increase the ADC. However, there was only a small range of differences between the pre- and postfixation ADC values, and these differences were not significantly correlated to the differences in lung volume. This relative insensitivity of the ADC to lung volume changes corroborates data reported in other studies.35,36 It likely reflects the geometric relationship between radius and volume, in which the radius of a sphere or cylinder changes by the cube root or square root, respectively, of the change in volume (i.e., more slowly than the volume itself). The relative role of collateral pathways,37 which include interalveolar pores, bronchioloalveolar communications, and interbronchiolar channels, on gas diffusion and ADC measurements is uncertain. Normal interalveolar pores may be blocked by surfactant in vivo,38 while a reduced resistance to collateral airflow in emphysema37,39 suggests that collateral pathways are enlarged and/or new ones are created. Regardless of any effect of formalin fixation on the patency, number, and size of collateral pathways, there was little net effect of formalin fixation on the ADC measurements.
Lungs air dried in inflation are another potential model system for 3He MR diffusion imaging, as shown in a study of four normal rabbit lungs40 A relative advantage of air-dried lungs is the lack of noxious fumes, which are fairly strong with formalin vapor-fixed lungs. To our knowledge, use of air-dried lungs in 3He MR diffusion imaging has not been evaluated in the setting of emphysema. A disadvantage is that air-dried lungs have a stiff, brittle texture and are somewhat fragile. Because all water is removed, in contrast to formalin vapor-fixed lungs, they would be expected to have much lower CT attenuation and likely would not be useful as a CT phantom.
There are several limitations to this study and the fixation technique used. Both pre- and post-fixation imaging with CT and MR was not obtainable in all cases, resulting in comparisons of different numbers and combinations of subjects for the CT and MR parameters. We had no specimens from normal subjects for the CT analysis, which slightly limited the range of lung attenuation evaluated in the CT comparisons. The use of single lungs and lobes for the analyses precluded comparisons with spirometry and plethysmographic lung volume measurements. It should be noted that the use of concentrated formalin requires caution during fixation, handling, and storage of the lungs due to strong toxic fumes. Though the inflation-fixed lung tissue maintains a distended state, it retains some compliance and must be handled with care as external pressure can result in permanent deformation. The long-term stability of the measurements was not assessed, but could be affected by continued formalin-induced shrinkage or eventual drying.
In summary, this study demonstrates that fixation of lungs with heated formalin vapor preserves the unique quantitative imaging characteristics of lung tissue altered by emphysema. Due to the apparent sensitivity of the CT and MR measurements to several variables associated with lung fixation that may be difficult to control, the post-fixation CT measurements may deviate from pre-fixation measurements in a minority of cases. Nevertheless, lungs fixed in inflation with heated formalin vapor may provide a realistic physical model for investigating the effects of technical imaging parameters on emphysema quantification, and. may also be used for detailed study of the effects of emphysema on the lungs using imaging techniques. In contrast to the in vivo setting, the technique allows repeated imaging of the lungs under stable volume conditions, without concern for patient safety or tolerance.
Acknowledgments
Supported by National Institutes of Health grants R01HL72369 and R01HL70037, and an equipment loan from GE Healthcare.
References
- 1.Ley-Zaporozhan J, Ley S, Kauczor HU. Morphological and functional imaging in COPD with CT and MRI: present and future. Eur Radiol. 2008;18:510–521. doi: 10.1007/s00330-007-0772-1. [DOI] [PubMed] [Google Scholar]
- 2.Sverzellati N, Molinari F, Pirronti T, et al. New insights on COPD imaging via CT and MRI. Int J Chron Obstruct Pulmon Dis. 2007;2:301–312. [PMC free article] [PubMed] [Google Scholar]
- 3.Gierada DS, Pilgram TK, Whiting BR, et al. Comparison of standard- and low-radiation-dose CT for quantification of emphysema. AJR Am J Roentgenol. 2007;188:42–47. doi: 10.2214/AJR.05.1498. [DOI] [PubMed] [Google Scholar]
- 4.Yuan R, Mayo JR, Hogg JC, et al. The effects of radiation dose and CT manufacturer on measurements of lung densitometry. Chest. 2007;132:617–623. doi: 10.1378/chest.06-2325. [DOI] [PubMed] [Google Scholar]
- 5.Madani A, De Maertelaer V, Zanen J, et al. Pulmonary emphysema: radiation dose and section thickness at multidetector CT quantification--comparison with macroscopic and microscopic morphometry. Radiology. 2007;243:250–257. doi: 10.1148/radiol.2431060194. [DOI] [PubMed] [Google Scholar]
- 6.Ley-Zaporozhan J, Ley S, Weinheimer O, et al. Quantitative analysis of emphysema in 3D using MDCT: influence of different reconstruction algorithms. Eur J Radiol. 2008;65:228–234. doi: 10.1016/j.ejrad.2007.03.034. [DOI] [PubMed] [Google Scholar]
- 7.Boedeker KL, McNitt-Gray MF, Rogers SR, et al. Emphysema: effect of reconstruction algorithm on CT imaging measures. Radiology. 2004;232:295–301. doi: 10.1148/radiol.2321030383. [DOI] [PubMed] [Google Scholar]
- 8.Salerno M, Brookeman JR, Mugler JP., 3rd Time-dependent hyperpolarized 3He diffusion MR imaging: initial experience in healthy and emphysematous lungs. Proceedings of the 9th Annual Meeting of ISMRM; Glasgow, Scotland. 2001. p. 950. [Google Scholar]
- 9.Altes TA, Mata J, de Lange EE, et al. Assessment of lung development using hyperpolarized helium-3 diffusion MR imaging. J Magn Reson Imaging. 2006;24:1277–1283. doi: 10.1002/jmri.20723. [DOI] [PubMed] [Google Scholar]
- 10.Barbera JA, Ramirez J, Lopez FA, et al. New design for fixation of surgically obtained lung specimens. Pathol Res Pract. 1989;184:630–634. doi: 10.1016/s0344-0338(89)80169-4. [DOI] [PubMed] [Google Scholar]
- 11.Mittermayer C, Wybitul K, Rau WS, et al. Standardized fixation of human lung for radiology and morphometry; Description of a “two chamber”-system with formaldehyde vapor inflation. Pathol Res Pract. 1978;162:115–130. doi: 10.1016/S0344-0338(78)80134-4. [DOI] [PubMed] [Google Scholar]
- 12.Wright BM, Slavin G, Kreel L, et al. Postmortem inflation and fixation of human lungs. A technique for pathological and radiological correlations. Thorax. 1974;29:189–194. doi: 10.1136/thx.29.2.189. [DOI] [PMC free article] [PubMed] [Google Scholar]
- 13.Gierada DS, Woods JC, Bierhals AJ, et al. Effects of diffusion time on short-range hyperpolarized (3)He diffusivity measurements in emphysema. J Magn Reson Imaging. 2009;30:801–808. doi: 10.1002/jmri.21912. [DOI] [PMC free article] [PubMed] [Google Scholar]
- 14.Gierada DS, Bierhals AJ, Choong CK, et al. Effects of CT section thickness and reconstruction kernel on emphysema quantification relationship to the magnitude of the CT emphysema index. Acad Radiol. 2010;17:146–156. doi: 10.1016/j.acra.2009.08.007. [DOI] [PMC free article] [PubMed] [Google Scholar]
- 15.Choong CK, Haddad FJ, Martinez C, et al. A simple, reproducible, and inexpensive technique in the preparation of explanted emphysematous lungs for ex vivo studies. J Thorac Cardiovasc Surg. 2005;130:922–923. doi: 10.1016/j.jtcvs.2005.03.046. [DOI] [PubMed] [Google Scholar]
- 16.Salerno M, de Lange EE, Altes TA, et al. Emphysema: hyperpolarized helium 3 diffusion MR imaging of the lungs compared with spirometric indexes--initial experience. Radiology. 2002;222:252–260. doi: 10.1148/radiol.2221001834. [DOI] [PubMed] [Google Scholar]
- 17.Woodhouse N, Wild JM, Paley MN, et al. Combined helium-3/proton magnetic resonance imaging measurement of ventilated lung volumes in smokers compared to never-smokers. J Magn Reson Imaging. 2005;21:365–369. doi: 10.1002/jmri.20290. [DOI] [PubMed] [Google Scholar]
- 18.Parraga G, Ouriadov A, Evans A, et al. Hyperpolarized 3He ventilation defects and apparent diffusion coefficients in chronic obstructive pulmonary disease: preliminary results at 3.0 Tesla. Invest Radiol. 2007;42:384–391. doi: 10.1097/01.rli.0000262571.81771.66. [DOI] [PubMed] [Google Scholar]
- 19.Leawoods JC, Yablonskiy DA, Saam B, et al. Hyperpolarized 3He Gas Production and MR Imaging of the lung. Concepts Magn Reson. 2001;13:277– 293. [Google Scholar]
- 20.Saam BT, Happer W, Middleton H. Nuclear relaxation of 3He in the pressence of O2. Phy Rev A. 1995;52:862–865. doi: 10.1103/physreva.52.862. [DOI] [PubMed] [Google Scholar]
- 21.Saam BT, Yablonskiy DA, Kodibagkar VD, et al. MR imaging of diffusion of (3)He gas in healthy and diseased lungs. Magn Reson Med. 2000;44:174–179. doi: 10.1002/1522-2594(200008)44:2<174::aid-mrm2>3.0.co;2-4. [DOI] [PubMed] [Google Scholar]
- 22.Yablonskiy DA, Sukstanskii AL, Leawoods JC, et al. Quantitative in vivo assessment of lung microstructure at the alveolar level with hyperpolarized 3He diffusion MRI. Proc Natl Acad Sci U S A. 2002;99:3111–3116. doi: 10.1073/pnas.052594699. [DOI] [PMC free article] [PubMed] [Google Scholar]
- 23.Guo J, Reinhardt JM, Kitaoka H, et al. Integrated system for CT-based assessment of parenchymal lung disease. IEEE International Symposium on Biomedical Imaging. 2002:871–874. [Google Scholar]
- 24.Hoffman EA, Reinhardt JM, Sonka M, et al. Characterization of the interstitial lung diseases via density-based and texture-based analysis of computed tomography images of lung structure and function. Acad Radiol. 2003;10:1104–1118. doi: 10.1016/s1076-6332(03)00330-1. [DOI] [PubMed] [Google Scholar]
- 25.Muller NL, Staples CA, Miller RR, et al. “Density mask”. An objective method to quantitate emphysema using computed tomography. Chest. 1988;94:782–787. doi: 10.1378/chest.94.4.782. [DOI] [PubMed] [Google Scholar]
- 26.Groell R, Rienmueller R, Schaffler GJ, et al. CT number variations due to different image acquisition and reconstruction parameters: a thorax phantom study. Comput Med Imaging Graph. 2000;24:53–58. doi: 10.1016/s0895-6111(99)00043-9. [DOI] [PubMed] [Google Scholar]
- 27.Kemerink GJ, Lamers RJ, Thelissen GR, et al. CT densitometry of the lungs: scanner performance. J Comput Assist Tomogr. 1996;20:24–33. doi: 10.1097/00004728-199601000-00006. [DOI] [PubMed] [Google Scholar]
- 28.Reinhardt JM, D’Souza ND, Hoffman EA. Accurate measurement of intrathoracic airways. IEEE Trans Med Imaging. 1997;16:820–827. doi: 10.1109/42.650878. [DOI] [PubMed] [Google Scholar]
- 29.Hamada T, Sasaguri T, Hisaoka M, et al. Mild emphysema: a novel method using formalin-fixed lungs for computed tomography and pathological analyses. Virchows Arch. 1995;426:597–602. doi: 10.1007/BF00192115. [DOI] [PubMed] [Google Scholar]
- 30.Satoh K, Kobayashi T, Ohkawa M, et al. Preparation of human whole lungs inflated and fixed for radiologic-pathologic correlation. Acad Radiol. 1997;4:374–379. doi: 10.1016/s1076-6332(97)80120-1. [DOI] [PubMed] [Google Scholar]
- 31.Weibel ER, Vidone RA. Fixation of the lung by formalin steam in a controlled state of air inflation. Am Rev Respir Dis. 1961;84:856–861. doi: 10.1164/arrd.1961.84.6.856. [DOI] [PubMed] [Google Scholar]
- 32.Hruban R, Meziane M, Zerhouni E, et al. High resolution computed tomography of inflation fixed lungs. Pathologic-radiologic correlation of centrilobular emphysema. Am Rev Respir Dis. 1987;136:935–940. doi: 10.1164/ajrccm/136.4.935. [DOI] [PubMed] [Google Scholar]
- 33.Gierada DS, Yusen RD, Pilgram TK, et al. Repeatability of quantitative CT indexes of emphysema in patients evaluated for lung volume reduction surgery. Radiology. 2001;220:448–454. doi: 10.1148/radiology.220.2.r01au46448. [DOI] [PubMed] [Google Scholar]
- 34.Gietema HA, Schilham AM, van Ginneken B, et al. Monitoring of smoking-induced emphysema with CT in a lung cancer screening setting: detection of real increase in extent of emphysema. Radiology. 2007;244:890–897. doi: 10.1148/radiol.2443061330. [DOI] [PubMed] [Google Scholar]
- 35.Waters B, Owers-Bradley J, Silverman M. Acinar structure in symptom-free adults by Helium-3 magnetic resonance. Am J Respir Crit Care Med. 2006;173:847–851. doi: 10.1164/rccm.200411-1595OC. [DOI] [PubMed] [Google Scholar]
- 36.Diaz S, Casselbrant I, Piitulainen E, et al. Hyperpolarized 3He apparent diffusion coefficient MRI of the lung: reproducibility and volume dependency in healthy volunteers and patients with emphysema. J Magn Reson Imaging. 2008;27:763–770. doi: 10.1002/jmri.21212. [DOI] [PubMed] [Google Scholar]
- 37.Terry PB, Traystman RJ, Newball HH, et al. Collateral ventilation in man. N Engl J Med. 1978;298:10–15. doi: 10.1056/NEJM197801052980103. [DOI] [PubMed] [Google Scholar]
- 38.Bastacky J, Goerke J. Pores of Kohn are filled in normal lungs: low-temperature scanning electron microscopy. J Appl Physiol. 1992;73:88–95. doi: 10.1152/jappl.1992.73.1.88. [DOI] [PubMed] [Google Scholar]
- 39.Hogg JC, Macklem PT, Thurlbeck WM. The resistance of collateral channels in excised human lungs. J Clin Invest. 1969;48:421–431. doi: 10.1172/JCI105999. [DOI] [PMC free article] [PubMed] [Google Scholar]
- 40.Mata JF, Altes TA, Ruppert K, et al. Assessment of in vitro vs. in vivo lung structure using hyperpolarized helium-3 diffusion magnetic resonance imaging. Magn Reson Imaging. 2009;27:845–851. doi: 10.1016/j.mri.2009.01.014. [DOI] [PubMed] [Google Scholar]


