Abstract
Purpose
First-pass perfusion MRI is a promising technique for detecting ischemic heart disease. However, the diagnostic value of the method is limited by the low spatial coverage, resolution, SNR, and cardiac motion related image artifacts. A combination of sliding window and CG-HYPR method has been proposed in healthy volunteer studies to reduce the acquisition window for each slice while maintaining the temporal resolution of one frame per heartbeat in myocardial perfusion MR imaging. This method allows for improved spatial coverage, resolution and SNR.
Materials and Methods
In this study, we use a controlled animal model to test whether the myocardial territory supplied by a stenotic coronary artery can be detected accurately by SW-CG-HYPR perfusion method under pharmacological stress.
Results
Results from six mongrel dogs (15–25 kg) studies demonstrate the feasibility of SW-CG-HYPR to detect regional perfusion defects. Using this method, the acquisition time per cardiac cycle was reduced by a factor of 4, and the spatial coverage was increased from 2–3 to 6 slices as compared to the conventional techniques including both turbo-FLASH and EPI. The SNR of the healthy myocardium at peak enhancement with SW-CG-HYPR (12.68±2.46) is significantly higher (p<0.01) than the turbo-FLASH (8.65±1.93) and EPI (5.48±1.24). The spatial resolution of SW-CG-HYPR images is 1.2×1.2×8.0 mm3, which is better than the turbo-FLASH (1.8×1.8×8.0 mm3) and EPI (2.0×1.8×8.0 mm3).
Conclusion
SW-CG-HYPR is a promising technique for myocardial perfusion MRI. This technique provides higher image quality with respect to significantly improved SNR and spatial resolution of the myocardial perfusion images, which might improve myocardial perfusion imaging in a clinical setting.
Keywords: Magnetic resonance imaging, myocardial perfusion, coronary artery disease, animal studies
Introduction
First-pass contrast-based perfusion MRI during pharmacologic vasodilatation is a promising noninvasive technique for detecting and evaluating ischemic heart disease (1). However, the diagnostic value of the method is limited by the relatively low spatial coverage, resolution, SNR, and cardiac motion related image artifacts. Reduced imaging time per slice in each heartbeat will allow greater coverage of the heart and reduced motion artifacts, especially during stress imaging with high heart rates. Parallel data acquisition (2) such as GRAPPA (3,4) and SENSE (5,6) and echo-planar imaging (EPI) (7) methods have been applied in myocardial perfusion MRI, but the spatial coverage is still limited to 3–4 slices with relatively low spatial resolution and SNR, and relatively long acquisition window per heartbeat (8).
Time-resolved data acquisition with HighlY constrained back-PRojection reconstruction (HYPR) has been used to provide a higher reduction factor with radial sampling, reduced streak artifacts, while maintaining high spatial resolution and SNR (9). This method decomposes an image by its spatial and temporal information. Composite image with spatial information is reconstructed by combining undersampled k-space from different time points, and the weighting maps with temporal information are calculated from the unfiltered back-projection of each segment. Conjugate Gradient (CG) processing has been previously proposed for parallel imaging reconstruction of non-Cartesian data (10). CG iterated HYPR (CG-HYPR) was proposed (9) for optimal image reconstruction which further improves the accuracy of signal changes, especially for the closely spaced pixels with different time courses. Sliding window has been used to reconstruct the composite images and update the averaged changing signals frequently.
A combination of sliding window and CG-HYPR methods (SW-CG-HYPR) have been proposed to reduce the acquisition window for each slice while maintaining the temporal resolution of one frame per heartbeat in myocardial perfusion MR imaging. This method allows for increased number of slices, reduced motion artifacts, and preserves the high SNR and spatial resolution of the composite images at the same time (11).
The feasibility of myocardial perfusion MRI with SW-CG-HYPR has been evaluated using computer simulations and experimentally in healthy volunteer studies at rest (11). In this work, we used a controlled animal model to test whether the myocardial territory supplied by a stenotic coronary artery can be detected accurately by SW-CG-HYPR under in stress conditions. We compared this method with conventional clinical protocols (both turbo-FLASH and EPI) for myocardial perfusion imaging.
Materials and Methods
Animal preparation
Six mongrel dogs (15–25 kg) were surgically instrumented and scanned with approval from institutional Animal Care and Use Committee. The animals were intubated and ventilated, and gas anesthesia was administered (2.0%–2.5% isoflurane and 100% oxygen). Using a sterile technique, a left lateral thoracotomy was performed between the 8th and 9th intercostals space and the pericardium was opened and sewed into a cradle. The heart was exposed and the left circumflex coronary artery (LCX) was identified. Reversible LCX coronary artery stenoses was created using an external hydraulic occluder placed surrounding LCV coronary artery 1.0–1.5 cm from the bifurcation of the left main coronary artery. Right atrial catheter was placed for administration of adenosine. A catheter was placed in the aortic root and connected to a fluid-filled pressure transducer for measurement of the central aortic pressure. A Doppler flow probe (Crystal Biotech, Northborough, MA) was placed 2–3 cm downstream from the occluder, in order to measure the LCX blood velocity. At the end of the surgical procedure, the chest was closed and the animals were allowed to recover for 7 days with appropriate antibiotic and analgesic treatment before MRI scans were performed. Before imaging, each dog was sedated and intubated. After intubation, the animals were placed on a ventilator with gas anesthesia (isoflurane 2.0–2.5% and 100% oxygen) during imaging.
MR sequence design and reconstruction method
To acquire the data for SW-CG-HYPR myocardial perfusion imaging, an ECG-triggered FLASH sequence with Multi-Slice per Saturation Recovery pre-pulse (MS-SR) structure and radial k-space sampling was used, as shown in Figure 1. ECG triggering was used to assess cardiac motion, and a saturation recovery (SR) preparation pulse was used for background suppression based on T1 weighting. The k-space datasets were acquired by radial sampling in a segmented interleaved fashion, and was highly undersampled at each cardiac cycle to achieve high temporal resolution. Only 16 projections were acquired for each slice per cardiac cycle. Compared to the significantly shortened data acquisition window by SW-CG-HYPR technique, the SR preparation per slice is relatively long. To improve the efficiency of data acquisition, data was acquired for multiple slices after each saturation recovery preparation. In this study, 2 slices per SR preparation were acquired. Therefore, the number of slices per cardiac cycle (spatial coverage) was increased to 6 even when the R-R interval was less than 600 ms for dog studies under stress condition. Sliding window was used to reconstruct the composite images combining the k-space data over 10 cardiac cycles. The time-resolved images (one image per cardiac cycle) were reconstructed after CG-HYPR processing (9).
Figure 1.
Schematic of the segmented 2D-multislice radial k-space acquisition using interleaved sliding window. Sliding window method is used to reconstruct composite images. Time-resolved images (one single image one cardiac cycle) are achieved after CG-HYPR post-processing.
Myocardial perfusion MR imaging
All images were acquired on a 1.5T scanner (ESPREE, Siemens Medical Solutions, Erlangen, Germany) in dogs during a single breath hold. A flexible, phased-array surface coil was placed over the chest for signal reception. An infusion pump (Harvard apparatus, Holliston, MA) was connected to the right atrial catheter for delivery of adenosine. Adenosine was infused into the right atrial catheter to induce global coronary vasodilatation. After the increase of flow velocity was confirmed by Doppler measurements, LCX stenosis was achieved at a level between 80% and 100% by the hydraulic occluder. Myocardial perfusion images were acquired during the first-pass of the contrast agent. Gadopentetate dimeglumine (Magnevist, Berlex, Wayne, NJ, USA) was delivered at a dose of 0.075 mmol/kg, and chased by 12 ml of saline solution. Both were delivered intravenously using a power injector (Spectris, Medrad, Indianala, PA, USA) at a rate of 4ml/s.
The radial k-space datasets were collected continuously over 60 heartbeats and t h e R-R interval was between 400 and 600 ms. Within the collected datasets, approximately 15 – 20 heartbeats were used for the first-pass contrast enhancement. The ECG-triggered FLASH sequence with MS-SR structure and radial k-space sampling was performed with the following parameters: TR/TE/flip-angle = 3.0/1.5 ms/12°, FOV = 240×240 mm2, matrix = 192×192, number of projections per slice each cardiac cycle = 16, spatial resolution = 1.2×1.2×8.0 mm3 and the number of slices = 6. The position and TI time (100 ms) of slice 2, 4 and 6 were matched to the slices acquired by conventional protocols for comparison purpose. Slices 1, 3 and 5 were acquired with a shorter TI time of 60 ms, within the range of acceptable TI times commonly used. The data acquisition time each slice per cardiac cycle was 45 ms.
To compare the image quality and verify the signal changes after contrast administration, a conventional first-pass perfusion scan with either turbo-FLASH or EPI was performed with the same contrast injection scheme. Due to the higher heart rate in dogs compared to humans with further reduction in R-R interval following the injection of adenosine, a spatial coverage of 3 slices was not always possible with turbo-FLASH. In that case, EPI, with a faster speed, was used as the reference method. We used 650 ms as the threshold for the dog’s R-R interval. Turbo-FLASH was used for the dogs with R-R interval greater than 650 ms, and EPI was used for the dogs with R-R interval lower than the threshold. Within the six dog studies, three turbo-FLASH and three EPI scans were performed. The parameters for turbo-FLASH included: TR/TE/flip-angle = 2.5 ms/1.2 ms/12°, FOV = 140×280 mm2, matrix = 80×192, spatial resolution = 1.8×1.8×8.0 mm3, GRAPPA factor = 2, TI = 100 ms and number of slices = 2 – 3 (depending on the R-R interval). The parameters for EPI included: Flip-angle = 25°, TE = 1.5 ms, EPI factor = 4, FOV =140×343 mm2, matrix = 70×192, spatial resolution = 2.0×1.8×8.0 mm3, GRAPPA factor = 2, TI = 100 ms and number of slices = 3. The dynamic signal changes from the conventional scan were used as a reference to compare those obtained from SW-CG-HYPR images.
Image reconstruction and data analysis
Myocardial perfusion images acquired with the radial MS-SR FLASH method were reconstructed offline using MATLAB (Mathworks, Inc). Sliding window was used to reconstruct the composite images by the conventional regridding technique, and the time-resolved images during the first-pass contrast perfusion were reconstructed by the CG-HYPR post-processing to achieve the temporal resolution of one image per heartbeat.
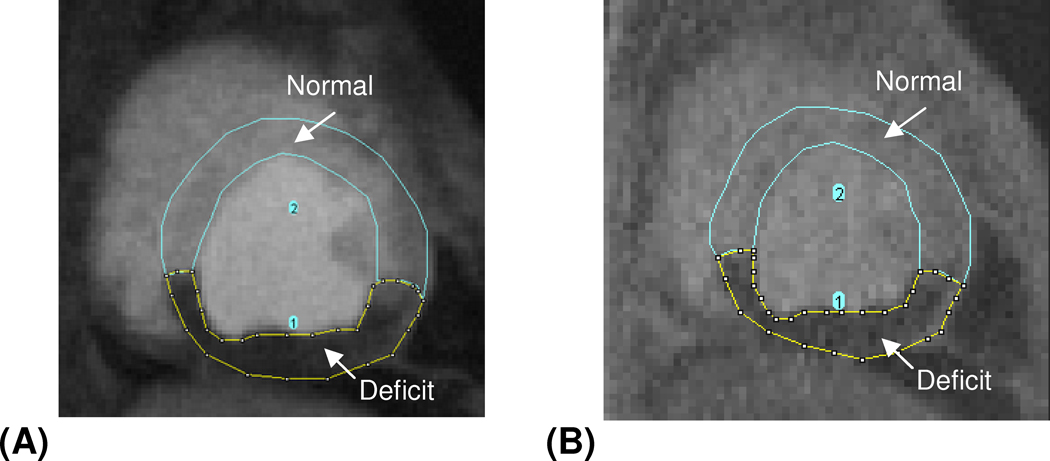
Signal intensity (SI) versus time curves of the left ventricle, healthy myocardium and myocardial deficit territories were compared between the SW-CG-HYPR images and reference images (turbo-FLASH and EPI), and the curves of healthy myocardium and myocardial deficits were normalized by the blood pool signal peak. Myocardial-to-LV upslope index ratio (upslope of the myocardial SI curve normalized by upslope of left ventricle SI curve) for the healthy myocardium of the SW-CG-HYPR and reference methods were also calculated and compared. To validate the accuracy for depicting the flow deficit with SW-CG-HYPR, the percentage of the deficit area in the total myocardial area from the SW-CG-HYPR images was measured (Figure 2) and compared against reference methods.
Figure 2.
A typical example showing the measurement of the perfusion deficits area and the total myocardial area from SW-CG-HYPR image (A) and turbo FLASH image (B). The area of flow deficits and normal myocardium was measured separately first, and the deficits percentage was calculated by dividing the area of deficits with the total myocardial area (the sum of area of normal myocardium and that of flow deficits).
SNR was measured for both the SW-CG-HYPR images and the conventional perfusion images including turbo-FLASH images and EPI images. The ROI was drawn in the healthy myocardium where the signals are relatively uniform, and the SNR were calculated as: SNR = SROI/σnoise, given by the original HYPR paper (9), where σnoise is the standard deviation of the signals in the ROI. The SNR of the three images for each slice around signal intensity peak were averaged and compared between two methods.
Correlation and statistical analysis
Correlation coefficients of the SI curves for the healthy myocardium between the SW-CG-HYPR and reference images were calculated. Because the contrast kinetics and deficit situation were different between different dog studies, paired two-tailed t-test with a 95% confidence interval was used for the statistical analysis of the myocardial-to-LV upslope index ratio and the percentage of the deficit area in the total myocardial area. The average SNRs of the different methods were first calculated and the improvement of the SNR for one method compared to another was tested using a paired one-tailed t-test with a 95% confidence interval.
Results
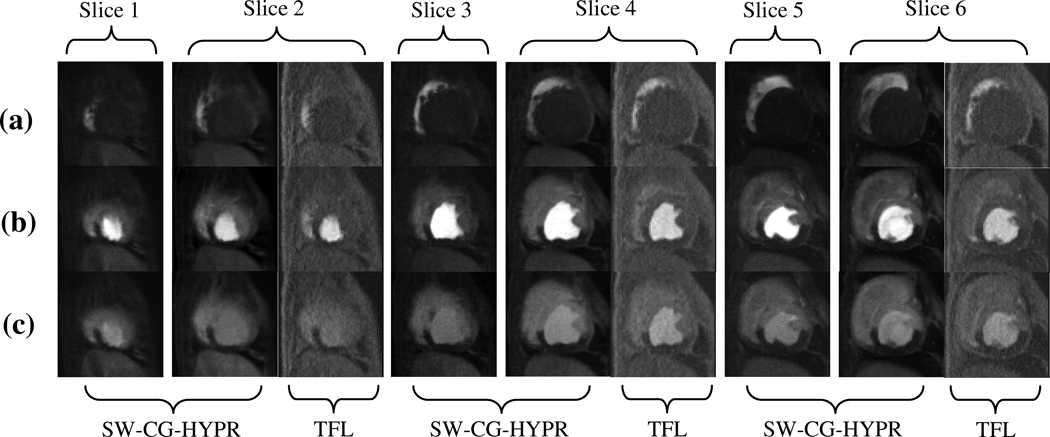
With the SW-CG-HYPR method, fewer lines were acquired for each slice per each cardiac cycle compared to the conventional protocol and the data acquisition window was reduced dramatically, from 140–180 ms to 45 ms. Combined with the MS-SR structure, the spatial coverage of the SW-CG-HYPR myocardial perfusion was increased from 2–3 to 6. Figure 3 showed a typical example to compare the spatial coverage of SW-CG-HYPR and conventional turbo-FLASH method.
Figure 3.
A typical example showing the comparison of the perfusion images from SW-CG-HYPR and turbo-FLASH (TFL). With an R-R interval of 550 ms, SW-CG-HYPR method covered 6 slices compared to only 3 slices by conventional turbo-FLASH method. To compare the intensity changes and image quality, we matched the position of slice 2, 4 and 6 of SW-CG-HYPR images to the apex, mid-ventricular and basal images acquired with the conventional methods.
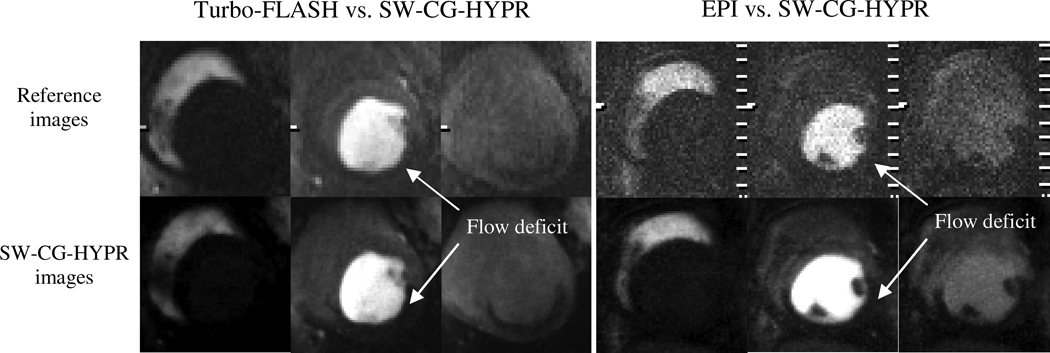
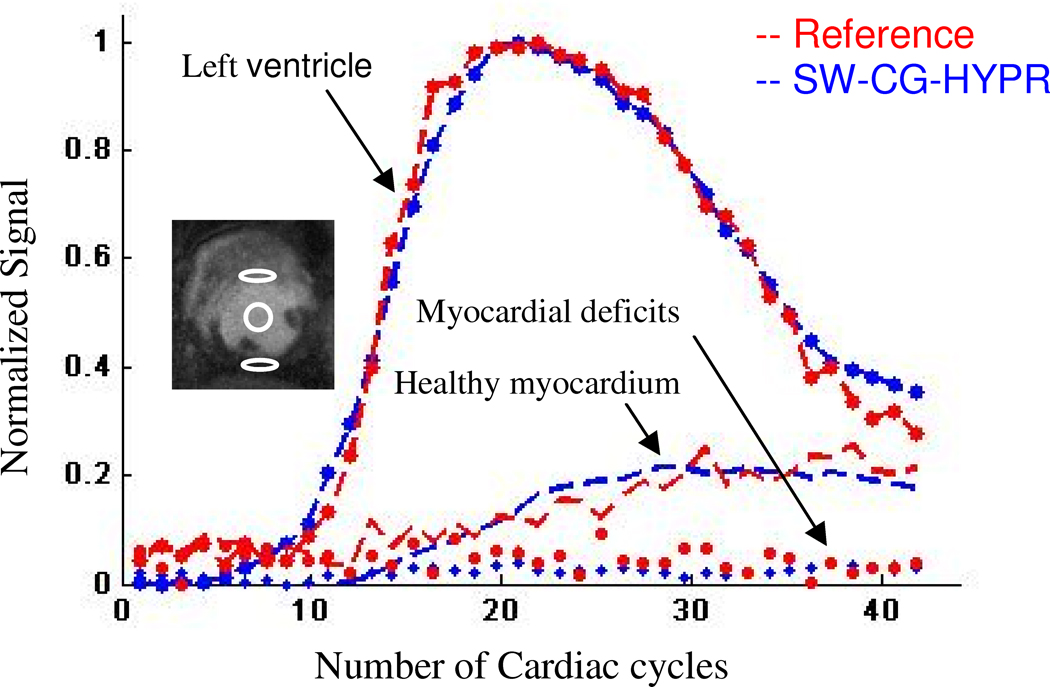
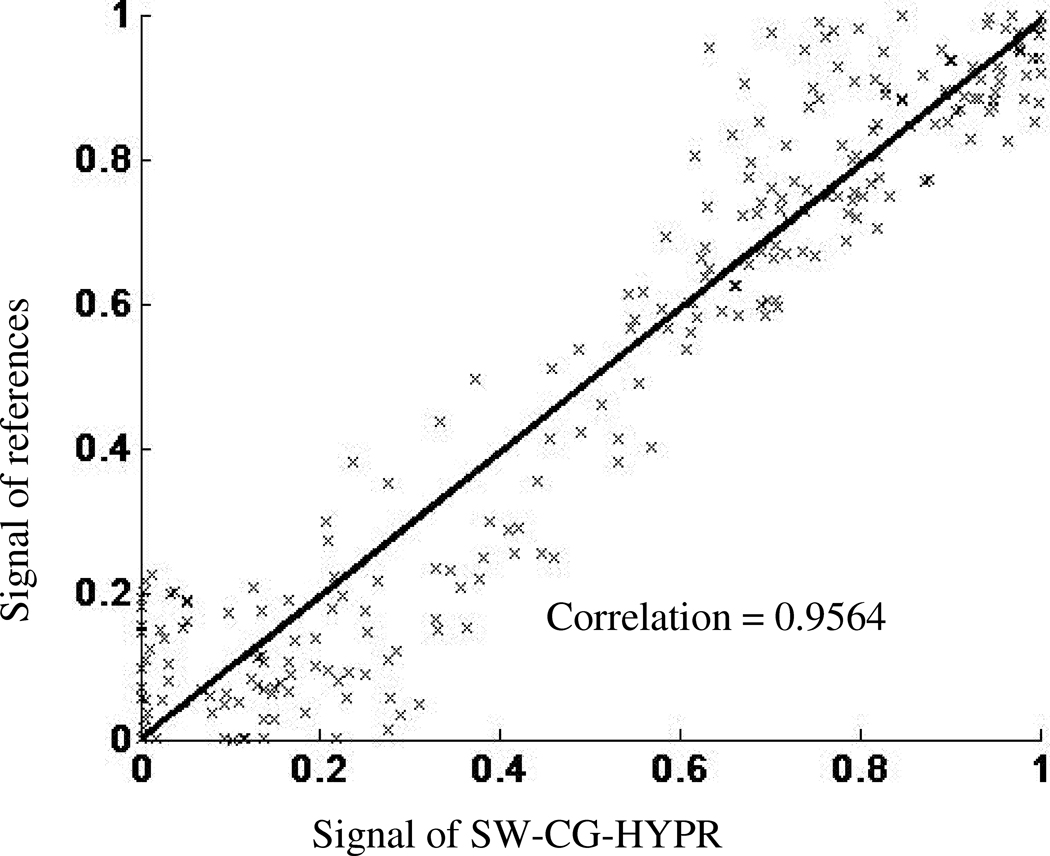
Figure 4 showed examples of the conventional perfusion images and SW-CG-HYPR perfusion images from the dog studies. The signal intensity changes of the left ventricle and myocardium in SW-CG-HYPR images (Figure 4, bottom row) closely followed those observed in images obtained using the conventional protocols (Figure 4, top row). The defects caused by LCX stenosis could be clearly delineated in SW-CG-HYPR images with improved SNR and spatial resolution. Typical ROIs used to measure SI of the left ventricle, healthy myocardium and myocardial deficits were shown in Figure 5. The signal intensity changes of the left ventricle and healthy myocardium between the new and conventional methods were highly correlated. The SIs of myocardial deficits for the new and conventional methods were also very similar in all the cases (almost flat along time axis due to the severe coronary stenosis), but were not compared by the correlation methods in this study because the correlation coefficients between a flat curve and any other curve is always zero. Correlation for the SI data for healthy myocardium in all six dog studies was illustrated in Figure 6. The correlation coefficient for all of the data collected in the six dog studies between SW-CG-HYPR and reference images was 0.9564 for healthy myocardial signals with a significant correlation(p<0.01). The Myocardial-to-LV upslope index ratios for SW-CG-HYPR and conventional protocol were 0.17±0.04, 0.16±0.08, respectively. The statistical analysis detected no significant Myocardial-to-LV upslope index ratio differences between the SW-CG-HYPR and reference methods with a 95% confidence interval. The average percentage of the deficit area in the total myocardial area from the SW-CG-HYPR images and that from images with the conventional protocol were 46.7%, 46.1% respectively. The statistical analysis showed no significant difference between the deficit area percentage obtained with the SW-CG-HYPR and conventional methods with a 95% confidence interval.
Figure 4.
Comparison of conventional method (first line) and SW-CG-HYPR (bottom line). Similar signal changes in the left ventricle and myocardium were observed between the SW-CG-HYPR and the conventional methods. The spatial resolution and the apparent SNR of the SW-CG-HYPR images were higher than the conventional images. The myocardial territories supplied by the LCX artery is better delineated in SW-CG-HYPR images than in the reference images.
Figure 5.
A typical example of the SI comparison for left ventricular, healthy and ischemic myocardium between images from SW-CG-HYPR and EPI. The signal intensity changes of the two methods are highly correlated from each other. The ROIs used to measure the three groups of curves are shown in the inset image.
Figure 6.
Correlation between signal intensity measured from the healthy myocardium with conventional method and SW-CG-HYPR method for all the six dog studies. The two datasets were highly correlated, with a correlation efficient of 0.9564.
The SNR of the healthy myocardium at peak enhancement with SW-CG-HYPR (12.68±2.46) was significantly higher (p<0.01) than the turbo-FLASH (8.65±1.93) and EPI (5.48±1.24).
Discussion
The results of this study demonstrated the potential feasibility of using SW-CG-HYPR for myocardial perfusion imaging in an in-vivo animal setting. Compared to the existing methods, using the acquisition time per cardiac cycle can be reduced dramatically, which allows an increased number of slices to be imaged with reduced motion artifacts. Also, the SNR and the spatial resolution of the SW-CG-HYPR images are significantly higher than the conventional methods. The MS-SR structure increased the efficiency of the data acquisition and further increased the spatial coverage. SNR and spatial resolution were improved for the SW-CG-HYPR images compared to turbo-FLASH and EPI methods. The accuracy of the signal intensity changes of left ventricle and myocardium was validated by the comparison with conventional protocols. Most importantly, the perfusion deficits caused by LCX stenosis can be clearly delineated in SW-CG-HYPR images with improved SNR and spatial resolution.
Demonstrated by the original HYPR paper (12), the SNR and the spatial resolution of the SW-CG-HYPR images mainly depend on the composite images, which are based on the full k-space data acquisition in this study. However, the data acquisitions of the conventional methods are based on GRAPPA method with an undersample reduction factor and relatively low spatial resolution. Therefore, the SW-CG-HYPR images have better SNR and spatial resolution than the conventional protocol. The signal intensity changes can be accurately estimated by the SW-CG-HYPR method (11) so that the upslope index ratios are similar between the SW-CG-HYPR method and the conventional protocol.
One consideration of the experiments and comparison methods is the comparisons between different methods have to be done through multiple trials: although with the same animal, the signal changes and breath-hold position of different scans may not be exactly the same. 20-minue delay time was inserted between the acquisitions to allow the contrast wash-out. During the wait period, the LCX stenosis were released and were reestablished to previous level under the Doppler guidance. The assumption is that blood flow will not change within 20 minutes with the same level of stenosis controlled by the Doppler flow probe.
One major limitation of this SW-CG-HYPR perfusion method is that breath - holding is required over the imaging time. Otherwise, respiratory motion may cause artifacts in the composite images, which will be propagated to time-resolved images reconstructed by CG-HYPR. Respiratory control was possible in the dogs. However, it may be difficult for patients to hold the breath for 20 seconds. Nevertheless, even conventional first-pass protocols demand breath holding to reduce the motion artifacts. Although SW-CG-HYPR is less sensitive to motion during the breath hold because of the shorter data acquisition window and radial sampling, it is more sensitive to motion during free breathing data acquisition because it combines data from different cardiac cycles to reconstruct the composite image. Further technical developments are expected to be necessary to address this problem.
In conclusion, reduced acquisition window, increased spatial coverage, improved spatial resolution and SNR makes SW- CG-HYPR a promising method for improving myocardial perfusion. Patient studies are needed to demonstrate the feasibility of this method to detect regional perfusion defects in clinical practice.
Acknowledgments
Grant support: American Heart Association pre-doctoral fellowship
Footnotes
Publisher's Disclaimer: This is a PDF file of an unedited manuscript that has been accepted for publication. As a service to our customers we are providing this early version of the manuscript. The manuscript will undergo copyediting, typesetting, and review of the resulting proof before it is published in its final citable form. Please note that during the production process errors may be discovered which could affect the content, and all legal disclaimers that apply to the journal pertain.
References
- 1.Muhler A. Assessment of myocardial perfusion using contrast-enhanced MR imaging: current status and future developments. MAGMA. 1995;3(1):21–33. doi: 10.1007/BF02426397. [DOI] [PubMed] [Google Scholar]
- 2.Irwan R, Lubbers DD, van der Vleuten PA, Kappert P, Gotte MJ, Sijens PE. Parallel imaging for first-pass myocardial perfusion. Magn Reson Imaging. 2007;25(5):678–683. doi: 10.1016/j.mri.2006.10.012. [DOI] [PubMed] [Google Scholar]
- 3.Griswold MA, Jakob PM, Heidemann RM, Nittka M, Jellus V, Wang J, Kiefer B, Haase A. Generalized autocalibrating partially parallel acquisitions (GRAPPA) Magn Reson Med. 2002;47(6):1202–1210. doi: 10.1002/mrm.10171. [DOI] [PubMed] [Google Scholar]
- 4.Park J, Zhang Q, Jellus V, Simonetti O, Li D. Artifact and noise suppression in GRAPPA imaging using improved k-space coil calibration and variable density sampling. Magn Reson Med. 2005;53(1):186–193. doi: 10.1002/mrm.20328. [DOI] [PubMed] [Google Scholar]
- 5.Plein S, Ryf S, Schwitter J, Radjenovic A, Boesiger P, Kozerke S. Dynamic contrast-enhanced myocardial perfusion MRI accelerated with k-t sense. Magn Reson Med. 2007;58(4):777–785. doi: 10.1002/mrm.21381. [DOI] [PubMed] [Google Scholar]
- 6.Hoge WS, Brooks DH. On the complimentarity of SENSE and GRAPPA in parallel MR imaging; Conf Proc IEEE Eng Med Biol Soc; 2006. pp. 755–758. [DOI] [PubMed] [Google Scholar]
- 7.Poncelet BP, Koelling TM, Schmidt CJ, Kwong KK, Reese TG, Ledden P, Kantor HL, Brady TJ, Weisskoff RM. Measurement of human myocardial perfusion by double-gated flow alternating inversion recovery EPI. Magn Reson Med. 1999;41(3):510–519. doi: 10.1002/(sici)1522-2594(199903)41:3<510::aid-mrm13>3.0.co;2-g. [DOI] [PubMed] [Google Scholar]
- 8.Theisen D, Wintersperger BJ, Huber A, Dietrich O, Reiser MF, Schonberg SO. Myocardial first pass perfusion imaging with gadobutrol: impact of parallel imaging algorithms on image quality and signal behavior. Invest Radiol. 2007;42(7):522–528. doi: 10.1097/RLI.0b013e3180383572. [DOI] [PubMed] [Google Scholar]
- 9.Griswold MA, Barkauskas K, Blaimer M, Moriguchi H, Sunshine J, Duerk J. More Optimal HYPR Reconstructions Using a Combination of HYPR and Conjugate-Gradient Minimization. Berlin, Germany: 2007. [Google Scholar]
- 10.Pruessmann KP, Weiger M, Bornert P, Boesiger P. Advances in sensitivity encoding with arbitrary k-space trajectories. Magn Reson Med. 2001;46(4):638–651. doi: 10.1002/mrm.1241. [DOI] [PubMed] [Google Scholar]
- 11.Ge L, Bi X, Lai P, Li D. Time-resolved contrast-enhanced coronary magnetic resonance angiography with highly constrained projection reconstruction. Magn Reson Imaging. 2009;28(2):195–199. doi: 10.1016/j.mri.2009.08.001. [DOI] [PMC free article] [PubMed] [Google Scholar]
- 12.Mistretta CA, Wieben O, Velikina J, Block W, Perry J, Wu Y, Johnson K. Highly constrained backprojection for time-resolved MRI. Magn Reson Med. 2006;55(1):30–40. doi: 10.1002/mrm.20772. [DOI] [PMC free article] [PubMed] [Google Scholar]


