Abstract
Purpose
To examine the reproducibility of the single breath-hold T2* technique from different scanners, after installation of standard methodology in 5 international centers.
Materials and Methods
Up to 10 patients from each center were scanned twice locally for local interstudy reproducibility of heart and liver T2*, and then flown to a central MR facility to be rescanned on a reference scanner for intercenter reproducibility. Interobserver reproducibility for all scans was also assessed.
Results
Of the 49 patients scanned, the intercenter reproducibility for T2* was 5.9% for the heart and 5.8% for the liver. Local interstudy reproducibility for T2* was 7.4% for the heart and 4.6% for the liver. Interobserver reproducibility for T2* was 5.4% for the heart and 4.4% for the liver.
Conclusion
These data indicate that T2* MR may be developed into a widespread test for tissue siderosis providing that well defined and approved imaging and analysis techniques are used.
Keywords: Thalassaemia, Cardiac siderosis, cardiomyopathy, Cardiovascular MR
Introduction
Thalassaemia is the commonest single gene defect worldwide and requires life-long blood transfusions for survival, but in time these may result in tissue iron loading and multiple organ complications. The main cause of mortality in thalassaemia major is heart failure secondary to myocardial iron overload.(1) This cardiomyopathy is reversible if appropriate chelation is commenced early,(2) but diagnosis is often delayed due to the late onset of symptoms when morbidity and mortality is high.(3;4) Conventional methods for assessing cardiac iron overload such as serum ferritin and liver iron concentration have not proved adequate for prediction of heart failure.(2;5–7) Similarly measurements of ventricular dysfunction only diagnose cardiac siderosis in the late stages when treatment is less successful. Attention has therefore shifted to direct measurement of cardiac iron levels. The single breath-hold T2* magnetic resonance (MR) technique is non-invasive, robust and fast for assessing tissue iron loading,(7–9) and therefore has important implications for clinical management of iron overload and the tailoring of chelation regimes. It is now evident that MR relaxometry has the potential to become the method of choice for clinical diagnosis and management of patients with iron overload,(10;11) and there is evidence that identification of patients with myocardial siderosis reduces cardiac mortality,(12) and newer chelation regimes may contribute to this improvement.(13) In order for the technique to be adopted internationally however, the reproducibility between multiple centers across the world needs to be established. We therefore conducted a study assessing the reproducibility of breath-hold T2* MR of 5 international centers using standardized acquisition and analysis techniques.
Methods
This study had full ethical approval and all patients gave written informed consent. Patients were recruited and scanned from five international sites in the study: Site 1 (Siemens Sonata, 1.5T scanner); Site 2 (GE Signa LX 1.5T MRI scanner ); Site 3 (Siemens Avanto, 1.5T scanner); Site 4 (Siemens Avanto, 1.5T scanner); Site 5 (GE Signa CV/I 1.5T MRI scanner). Patients were then rescanned using a Siemens Sonata 1.5T MRI scanner at a central MR facility. No additional patients were recruited from the central MR facility. International thalassaemia centres were defined as tertiary referral centres with an expertise in thalassaemia. Of the 49 patients included in the study, 43 had thalassaemia major and 6 had Bthal/HbE. HbE is a form of thalassemia in which abnormal splicing results both in reduced accumulation of translatable mRNA and the production of a structurally abnormal globin polypeptide. An individual who inherits HbE from one parent and beta thalassemia from the other (HbE-beta thalassemia) suffers from thalassemia intermedia or, occasionally, thalassemia major. There was a good range of T2* values seen in patients from different sites as shown in the patient demographics table. The average age was 30.9 ± 8.8 years and the average yearly blood transfusion was 29.2 ± 11.9 units. A detailed list of patient demographics is shown in table 1. After sequence installation and training in acquisition and analysis techniques at each center, all patients were scanned using the single breath-hold T2* technique previously described.(14) For the Siemens scanners an RF-spoiled gradient-echo sequence from the scanner manufacturer was used with parameters set to a flip angle of 20°, a matrix of 128×256 pixels, a field of view of 40cm, and a sampling bandwidth of 810 Hz/pixel. For the GE scanners the matrix was set as or very close to that of Siemens. The bandwidth was typically set as 62.5K HZ (244 HZ per pixel) for heart and 125K HZ (976 Hz per pixel) for liver. Following a single excitation pulse, a single short axis 10mm mid-ventricular slice was acquired at eight echo times (2.6–16.7ms, with 2.0ms increments) within a single breath-hold. The TR between each radio-frequency pulse was 20ms. The pulse sequence had been developed by main MRI vendors (Siemens, GE, and Philips). With respect to the analysis software, Thalassaemia-Tools (https://www.cmrtools.com), which has obtained CE Mark and recent FDA approval, is commercially available. To further benefit the patients and the society, this study can help develop a commonly accepted protocol in the near future. For analysis a homogeneous full-thickness region of interest was chosen in the left ventricular septum, encompassing both epicardial and endocardial regions. The mean signal intensity of this region was measured for each image using the only currently commercially available software which is FDA and EU approved for T2* analysis (Thalassemia-tools, Cardiovascular Imaging Solutions, London), and this was then plotted against the echo time to form an exponential decay curve. To derive T2*, an exponential trendline was fitted with an equation in the form y=Ke−TE/T2* where K represents a constant, TE represents the echo time and y represents the image signal intensity. Exponential fits were truncated in late echo images when appropriate as described previously.(15) Similarly, a single transaxial 10mm slice through the centre of the liver was scanned at a series of 20 different echo times (0.97–13.9ms, with 0.68ms increments). A manufacturer’s multiecho gradient-echo sequence was used, with parameters set to a flip angle of 20°, a matrix of 128x128 pixels, a field of view of 40cm, and a sampling bandwidth of 1950 Hz/pixel. All sites used a cardiac phased array coil. Owing to inherent differences in scanner performance and software at the various sites, the sequence parameters (particularly TE and TR) were not identical in all sites, but were kept similar to those described above. These variations would not be expected to significantly affect the T2* measurement. For analysis, a large (>3cm2) region of interest was chosen in a homogenous area of liver parenchyma without blood vessels. The subsequent derivation of T2* was the same as described previously in the heart.
Table 1.
Patient characteristics. AF- atrial fibrillation; SVT- supraventricular tachycardia; VT- ventricular tachycardia.
| All Patients | Site 1 | Site 2 | Site 3 | Site 4 | Site 5 | |
|---|---|---|---|---|---|---|
| Thalassemia major | 43 | 10 | 10 | 9 | 10 | 4 |
| BThal/HbE | 6 | 0 | 0 | 0 | 0 | 6 |
| Male | 17 | 3 | 4 | 2 | 5 | 3 |
| Female | 32 | 7 | 6 | 7 | 5 | 7 |
| Age [years] | 30.9 +/− 8.8 | 38.3 +/− 4.4 | 27.7 +/− 3.7 | 35.4 +/− 10.5 | 22.0 +/− 3.5 | 31.3 +/− 9.5 |
| Mean Myocardial T2* +/− SD | 24.9 +/− 14.9 | 24.5 +/− 12.5 | 13.7 +/− 6.4 | 34.2 +/− 12.9 | 25.0 +/− 19.1 | 28.2 +/− 15.1 |
| Myocardial T2* range | 2.7 – 52.9 | 4.9 – 40.9 | 8.0 – 29.1 | 17.4 – 52.9 | 2.7 – 51.1 | 6.7 – 52.3 |
| Mean Liver T2* +/− SD | 6.5 +/− 7.3 | 8.7 +/− 9.5 | 9.6 +/− 9.5 | 4.7 +/− 3.0 | 3.2 +/− 2.5 | N/A |
| Liver T2* range | 0.5 – 26.2 | 1.1 – 26.2 | 0.5 – 23.0 | 2.3 – 11.8 | 0.8 – 7.5 | N/A |
| Time between scans [days] | 20.1 +/− 19.0 | 12 | 2 | 56 | 26 | 8 |
| History of heart Failure | 1 | 0 | 0 | 0 | 0 | 1 |
| History of arrhythmia | 6 | 1 SVT | 1 AF,1 VT | 1 AF | 1 AF | 1 VT |
| History of coronary or valvular disease | 0 | 0 | 0 | 0 | 0 | 0 |
| Blood transfusions per year | 29.2 +/− 11.9 | 34.4 +/− 7.2 | 29.8 +/− 12.8 | 33.0 +/− 4.0 | 35.1 +/− 9.1 | 14.2 +/− 10.6 |
| Serum ferritin ug/L | 2950 +/−3068 | 5025 +/− 3976 | 2369 +/− 2479 | 1705 +/− 1102 | 2799 +/− 2504 | 2728 +/− 3758 |
| Deferoxamine | 16 | 0 | 2 | 5 | 5 | 4 |
| Deferiprone | 4 | 1 | 0 | 2 | 1 | 0 |
| Deferasirox | 3 | 0 | 1 | 2 | 0 | 0 |
| Deferoxamine + deferiprone | 24 | 9 | 7 | 0 | 4 | 4 |
| No Chelation | 2 | 0 | 0 | 0 | 0 | 2 |
| Cardiac Medication | 6 | 2 | 2 | 0 | 1 | 1 |
For inter-study reproducibility the patients were scanned twice in the same scanner at the local sites, with a delay of at least 20 minutes between scans. All patients except one, who was unable to fly for personal reasons, were then flown to the central MR facility to be scanned in a Siemens Sonata 1.5T scanner for intercenter reproducibility. There were a total of 48 scans for comparison of cardiac T2*. Due to technical problems in reducing the TE sufficiently in the GE Signa scanner in Site 5 to fit with the liver T2* protocol, this was not done at this site and therefore 39 scans were available for comparison of liver T2*. The average time between scans at the local site and the central MR facility was 20.1 ± 19.0 days. For interobserver reproducibility, all the scans from the local sites and the central MR facility were anonomysed, and analysed blindly by 6 independent readers (one from each centre). For all measures of reproducibility, we used the coefficient of variation (CoV), defined as the standard deviation of the differences between the measurements divided by their mean, and expressed as a percentage. A CoV less than 10% was considered good reproducibility, with increasing values indicating worse reproducibiulity. The data are presented as scatter plots and Bland-Altman plots as used in previous T2* studies.(8–10) Other values are expressed as mean ±standard deviation
Results
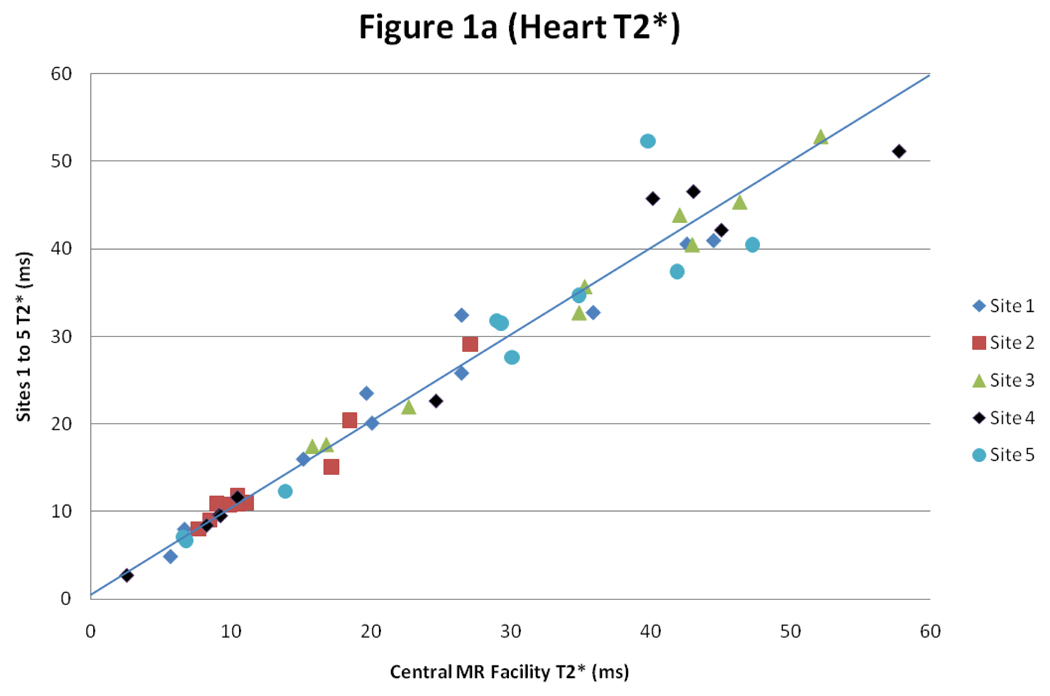
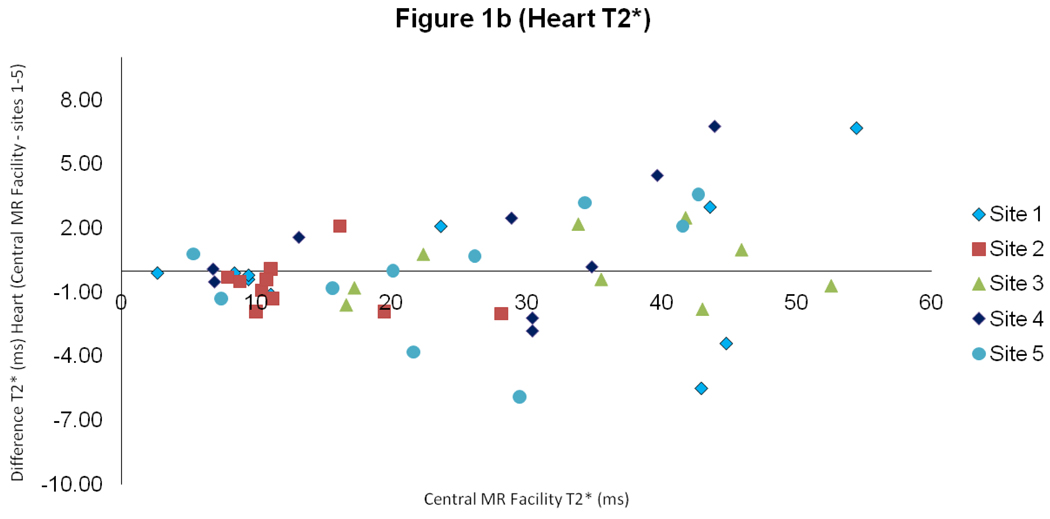
For heart T2*, there was good intercenter reproducibility between the local sites and the central MR facility with a CoV of 5.9% (figure 1). The interstudy reproducibility of heart T2* at the local sites was also good (CoV 7.4%), as was the interobserver reproducibility (CoV of 5.4%).
Figure 1.
Scatter plot with line of identity, and Bland Altman plot of myocardial T2* comparing results between the values obtained at the sites 1–5 and in the central MR facility
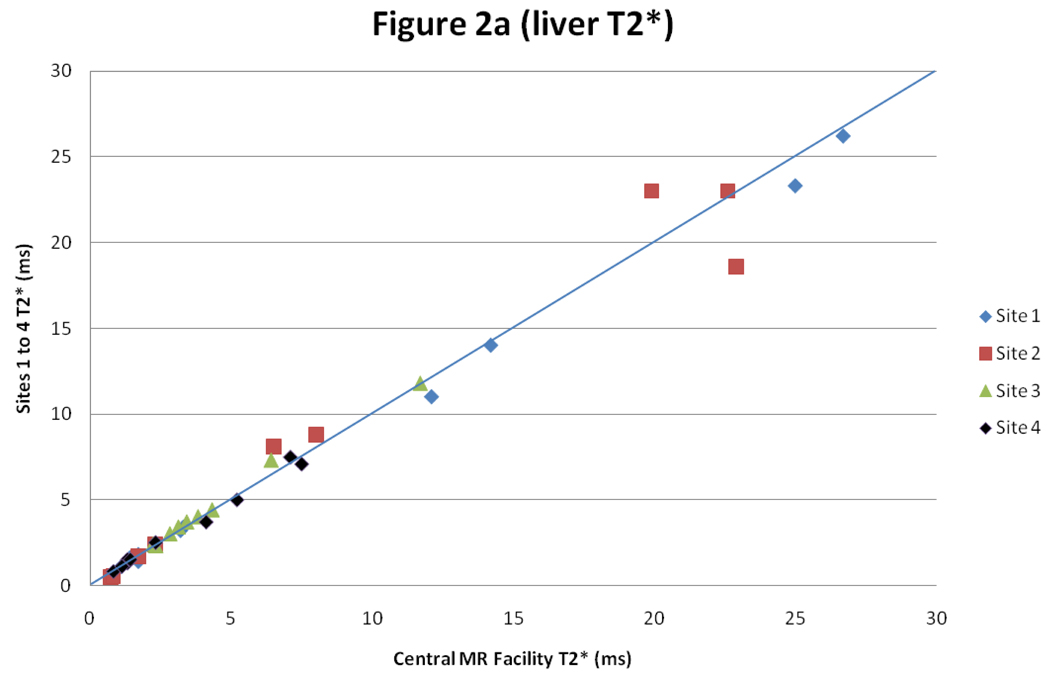
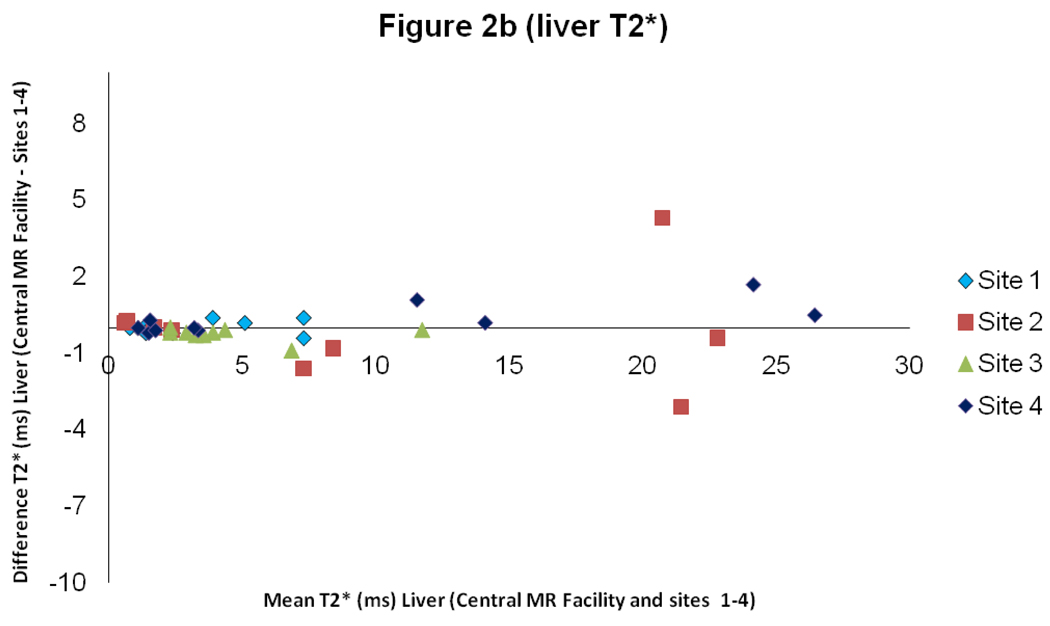
For liver T2*, there was good intercenter reproducibility between the local sites and the central MR facility with a CoV of 5.8% (figure 2). The interstudy reproducibility of liver T2* at the local sites was also good (CoV 4.6%), as was the interobserver reproducibility (CoV of 4.4%).
Figure 2.
Scatter graph with line of identity, and Bland Altman plot of liver T2* comparing results between the values obtained at the sites 1–4 and in the central MR facility
Discussion
Serum ferritin and liver iron concentration have long been used as surrogate measures for the accumulation of cardiac iron, which drives the majority of deaths in beta thalassemia major through development of toxic cardiomyopathy and heart failure. These measures have now been shown to have a poor correlation with direct measures of cardiac iron using cardiac T2* MR(7;16;17). These insights have generated growing international interest in using cardiac T2* to manage the cardiac risk in thalassemia patients, and at least 50 sites worldwide have adopted this methodology. There is however, very limited data on the reproducibility of the single breath-hold T2* technique between centres operating different scanners across different countries. There is one limited report of reproducibility in 10 patients from 2 European centers.(8) The current study considerably expands on this experience by establishing the reproducibility of the T2* technique across 5 centres worldwide stretching from the United States to the Far East in 49 patients, with all patients being scanned both locally and on a reference scanner in the central MR facility. Such studies are complex logistically, and expensive to perform but are very important in building confidence in the technique such that centres managing thalassemia patients can communicate results between each other for clinical management.
This study demonstrates that the intercenter reproducibility (expressed as the coefficient of variation) for T2* of heart and liver is 5.9% and 5.8% respectively. These results indicate that differences in T2* between centres are small in comparison with changes in T2* seen in clinical practice with chelation treatment,(2;18;19) and also small relative to the scale of current clinical management thresholds of 20ms to define cardiac iron overload,(7) and 10ms used to indicate severe cardiac iron overload and an increased likelihood of future development of cardiac events.(17) The other measures of reproducibility were also satisfactory with local interstudy reproducibility being 4.6–7.4%, and interobserver variability (6 observers) being from 3.9–7.5%.
In conclusion, these data indicate that measurement of tissue T2* (heart and liver) can be achieved reproducibly between centres across the world, provided that appropriate clinical governance measures are followed, which include the installation and use of standardised manufacturers’ T2* sequences, image analysis using software approved by the regulatory authorities, and suitable training in the acquisition and analysis.
Acknowledgments
Funded by National Institutes of Health Grant Award 5 R01 DK066084-02 Registered with Clinical Trials.gov NCT00520559
Footnotes
Explanation of Author's Contributions
Kirk P - 1st author responsible for the running of project and writing of paper
He T - Physicist who was responsible for co-running the project and was supported by the British Heart Foundation (BHF).
Anderson LJ - Previously responsible for grant application and visiting 1st site Roughton M - Statistician
Tanner MA, Lam WWM, Au WY, Chu WCW, Chan G, Galanello R, Matta G, Fogel M, Cohen AR, Tan RS, Chen K, Ng I, Lai A, Fucharoen S, Laothamatas J, Chuncharunee S, Jongjirasiri S, Firmin DN, Smith GC - All researchers from the 5 collaborating sites. Responsible for the selection and coordination of patients.
Pennell DJ - Supervisor for project
Reference List
- 1.Borgna-Pignatti C, Rugolotto S, De SP, Zhao H, Cappellini MD, Del Vecchio GC, et al. Survival and complications in patients with thalassemia major treated with transfusion and deferoxamine. Haematologica. 2004;89(10):1187–1193. [PubMed] [Google Scholar]
- 2.Anderson LJ, Westwood MA, Holden S, Davis B, Prescott E, Wonke B, et al. Myocardial iron clearance during reversal of siderotic cardiomyopathy with intravenous desferrioxamine: a prospective study using T2* cardiovascular magnetic resonance. Br J Haematol. 2004;127(3):348–355. doi: 10.1111/j.1365-2141.2004.05202.x. [DOI] [PubMed] [Google Scholar]
- 3.Porter JB. Practical management of iron overload. Br J Haematol. 2001;115(2):239–252. doi: 10.1046/j.1365-2141.2001.03195.x. [DOI] [PubMed] [Google Scholar]
- 4.Jessup M, Manno CS. Diagnosis and management of iron-induced heart disease in Cooley's anemia. Ann N Y Acad Sci. 1998;850:242–250. doi: 10.1111/j.1749-6632.1998.tb10481.x. [DOI] [PubMed] [Google Scholar]
- 5.Tanner MA, Galanello R, Dessi C, Westwood MA, Smith GC, Nair SV, et al. Myocardial iron loading in patients with thalassemia major on deferoxamine chelation. J Cardiovasc Magn Reson. 2006;8(3):543–547. doi: 10.1080/10976640600698155. [DOI] [PubMed] [Google Scholar]
- 6.Walker JM. The heart in thalassaemia. Eur Heart J. 2002;23(2):102–105. doi: 10.1053/euhj.2001.2850. [DOI] [PubMed] [Google Scholar]
- 7.Anderson LJ, Holden S, Davis B, Prescott E, Charrier CC, Bunce NH, et al. Cardiovascular T2-star (T2*) magnetic resonance for the early diagnosis of myocardial iron overload. Eur Heart J. 2001;22(23):2171–2179. doi: 10.1053/euhj.2001.2822. [DOI] [PubMed] [Google Scholar]
- 8.Westwood MA, Firmin DN, Gildo M, Renzo G, Stathis G, Markissia K, et al. Intercentre reproducibility of magnetic resonance T2* measurements of myocardial iron in thalassaemia. Int J Cardiovasc Imaging. 2005;21(5):531–538. doi: 10.1007/s10554-005-0651-2. [DOI] [PubMed] [Google Scholar]
- 9.Tanner MA, He T, Westwood MA, Firmin DN, Pennell DJ. Multi-center validation of the transferability of the magnetic resonance T2* technique for the quantification of tissue iron. Haematologica. 2006;91(10):1388–1391. [PubMed] [Google Scholar]
- 10.Argyropoulou MI, Astrakas L. MRI evaluation of tissue iron burden in patients with beta-thalassaemia major. Pediatr Radiol. 2007;37(12):1191–1200. doi: 10.1007/s00247-007-0567-1. [DOI] [PMC free article] [PubMed] [Google Scholar]
- 11.Wood JC. Magnetic resonance imaging measurement of iron overload. Curr Opin Hematol. 2007;14(3):183–190. doi: 10.1097/MOH.0b013e3280d2b76b. [DOI] [PMC free article] [PubMed] [Google Scholar]
- 12.Modell B, Khan M, Darlison M, Westwood MA, Ingram D, Pennell DJ. Improved survival of thalassaemia major in the UK and relation to T2* cardiovascular magnetic resonance. J Cardiovasc Magn Reson. 2008;10(1):42. doi: 10.1186/1532-429X-10-42. [DOI] [PMC free article] [PubMed] [Google Scholar]
- 13.Tanner MA, Galanello R, Dessi C, Smith GC, Westwood MA, Agus A, et al. Combined chelation therapy in thalassemia major for the treatment of severe myocardial siderosis with left ventricular dysfunction. J Cardiovasc Magn Reson. 2008;10(1):12. doi: 10.1186/1532-429X-10-12. [DOI] [PMC free article] [PubMed] [Google Scholar]
- 14.Westwood M, Anderson LJ, Firmin DN, Gatehouse PD, Charrier CC, Wonke B, et al. A single breath-hold multiecho T2* cardiovascular magnetic resonance technique for diagnosis of myocardial iron overload. J Magn Reson Imaging. 2003;18(1):33–39. doi: 10.1002/jmri.10332. [DOI] [PubMed] [Google Scholar]
- 15.He T, Gatehouse PD, Smith GC, Mohiaddin RH, Pennell DJ, Firmin DN. Myocardial T2* measurements in iron-overloaded thalassemia: An in vivo study to investigate optimal methods of quantification. Magn Reson Med. 2008;60(5):1082–1089. doi: 10.1002/mrm.21744. [DOI] [PMC free article] [PubMed] [Google Scholar]
- 16.Wood JC, Otto-Duessel M, Aguilar M, Nick H, Nelson MD, Coates TD, et al. Cardiac iron determines cardiac T2*, T2, and T1 in the gerbil model of iron cardiomyopathy. Circulation. 2005;112(4):535–543. doi: 10.1161/CIRCULATIONAHA.104.504415. [DOI] [PMC free article] [PubMed] [Google Scholar]
- 17.Kirk P, Roughton M, Porter JB, Walker JM, Tanner MA, Patel J, et al. Cardiac T2* magnetic resonance for prediction of cardiac complications in thalassemia major. Circulation. 2009;120(20):1961–1968. doi: 10.1161/CIRCULATIONAHA.109.874487. [DOI] [PMC free article] [PubMed] [Google Scholar]
- 18.Pennell DJ, Berdoukas V, Karagiorga M, Ladis V, Piga A, Aessopos A, et al. Randomized controlled trial of deferiprone or deferoxamine in beta-thalassemia major patients with asymptomatic myocardial siderosis. Blood. 2006;107(9):3738–3744. doi: 10.1182/blood-2005-07-2948. [DOI] [PubMed] [Google Scholar]
- 19.Tanner MA, Galanello R, Dessi C, Smith GC, Westwood MA, Agus A, et al. A randomized, placebo-controlled, double-blind trial of the effect of combined therapy with deferoxamine and deferiprone on myocardial iron in thalassemia major using cardiovascular magnetic resonance. Circulation. 2007;115(14):1876–1884. doi: 10.1161/CIRCULATIONAHA.106.648790. [DOI] [PubMed] [Google Scholar]


