

Abstract
Background
The antiviral activity of pegylated interferon-alpha-2a has not been studied in untreated HIV-1-infected subjects without chronic hepatitis C virus (HCV) infection.
Methods
Untreated HIV-1-infected volunteers without HCV received weekly pegylated interferon alfa-2a (180 μg) for twelve weeks. Changes in HIV-1 RNA (pVL), CD4+ T-cell counts, pharmacokinetics, pharmacodynamic measurements of 2’,5’ oligoadenylate synthetase (OAS) activity, and induction of interferon inducible genes (IFIG) were measured. Nonparametric statistical analysis was performed.
Results
Eleven subjects completed 12 weeks of therapy. Median pVL decline and change in CD4 T-cell counts at week 12 were 0.61 log10 cp/mL [90% CI:0.20,1.18] and −44 (− 95, 85) cells/mm3, respectively. There was no correlation between pVL declines and concurrent pegylated interferon plasma concentrations. However, subjects with larger increases in OAS exhibited greater decreases in pVL at weeks 1 and 2 (estimated Spearman correlations -0.75 [-0.93,-0.28]) and -0.61 [-0.87,-0.09], respectively). Subjects with higher baseline IFIG levels had smaller week 12 declines in pVL (0.66[0.06,0.91]), while those with larger IFIG induction exhibited larger declines in pVL (-0.74 [-0.93,-0.21]).
Conclusion
Pegylated interferon alfa-2a was well tolerated and had significant anti-HIV-1 activity in HIV-1-monoinfected patients. The anti-HIV-1 effect correlated with OAS protein (weeks 1 and 2) and IFIG induction (week 12), but not with pegylated interferon concentrations.
Introduction
Interferon-alpha is produced predominately by B-lymphocytes, null lymphocytes, macrophages and dendritic cells (DC) after exposure to foreign eukaryotic, tumor, or virus-infected cells. Interferons have potent and diverse immunoregulatory effects, which include induction of other cytokines, activation of macrophages and DC, augmentation of natural killer (NK) cell cytotoxicity, antibody-dependent cellular cytotoxicity and T-cell cytotoxicity, and alterations of cell trafficking (1-3). Studies of both RNA and DNA viruses indicate that inhibition of translation and virion assembly appears to be the principal mode of the antiviral effects of interferons (4-6). Several enzyme systems that are induced by interferon (Interferon-inducible genes – IFIG) have been shown to interfere with viral replication. These include among others, 2’,5’oligoadenylate synthetase (OAS), which catalyzes the synthesis of oligonucleotides that activate the endoribonuclease RNAse L which in turn produces cleavage of viral RNA.
Interferon-alpha inhibits both early HIV-1 replication and integration (7) and late-stage assembly and packaging of viral particles (8). Over thirty different IFIG have been implicated as playing a potential role in the inhibition of various viruses (5;6;9;10). Measurement of IFIGs has provided insight into the antiviral effects of interferon therapy in the setting of hepatitis C virus (HCV) treatment and may play a role in predicting treatment response (11).
Pegylated interferon alfa-2a (hereafter referred to as PegIFN) is a commercial preparation of recombinant interferon alfa-2a covalently attached to a branched mobile 40kD polyethylene glycol moiety, which inhibits enzymatic degradation, allowing for weekly administration. The pegylation increases the half-life of interferon alfa-2a for a sustained virologic response when compared to nonpegylated interferon alfa-2a (12;13). PegIFN is approved for the treatment of HCV and hepatitis B virus (HBV) infections and has a more favorable pharmacokinetic and safety profile than previously available alfa interferons (14;15). Pegylated interferon alfa-2b and PegIFN have only been tested for HIV-1 treatment in the setting of acute HIV-1 infection in conjunction with highly active antiretroviral therapy (16;17). This study was therefore undertaken to test the antiviral activity, safety, and tolerability of PegIFN (Pegasys®) in HCV-uninfected, HIV-1-infected volunteers not currently receiving antiretroviral therapy(ART).
Materials and Methods
Subjects were eligible to enroll into AIDS Clinical Trials Network Protocol 5192 if they had a CD4+ T-cell count ≥ 300 cells/mm3, plasma HIV-1 RNA ≥ 5000 copies/mL, and were ART-naïve or were ART-experienced but currently off therapy for at least 12 weeks. The patients must have been negative for HBV surface antigen and HCV antibody and have less than grade 1 transaminase levels at entry. Exclusion criteria included a history of severe psychiatric illness or any history of a chronic illness, such as cardiopulmonary disorder, that could be worsened by interferon therapy. All participants expressed a willingness to defer initiation (or re-initiation) of ART until after the completion of the study, though a safety clause for study withdrawal for CD4+ T-cell count ≤ 200 cells/mm3 was stipulated in the toxicity management section of the protocol. Filgrastim (Neupogen; provided by Amgen), a granulocyte colony-stimulating factor analog, was available for treatment of neutropenia through the study for providers to use per local standard of care practices. Written informed consent was obtained from all subjects.
The primary endpoints were change in plasma HIV-1 RNA from baseline to week 12, and safety and tolerability of PegIFN (provided by Roche Pharmaceuticals) at 180 μg given subcutaneously weekly by study personnel for 12 weeks. Post hoc, a decision was made to include analyses at weeks 1 and 2, when the largest decreases in HIV-1 RNA were seen. Secondary objectives included: assessment of HIV-1-specific CD4+ T-cell immunity while on treatment compared with baseline levels by lymphocyte proliferation response (LPA) to p24Ag and whole inactivated HIV-1 antigen; measurement of weekly and end of study serum trough levels of PegIFN and 2’,5’, oligoadenylate synthetase (OAS); durability of the virologic and immunologic responses to peginterferon alfa-2a therapy 6 weeks after discontinuation of study drug (week 18); and correlations among baseline and concurrent week-specific changes in plasma HIV-1 RNA, CD4+ T-cell count and OAS, and concurrent absolute concentrations of peginterferon alfa-2a and OAS. Post hoc examinations of the effect of missed doses on viral load change were performed. After the correlations between OAS and HIV-1 viral load changes were observed, a substudy was designed to explore the induction of IFIG.
Viral load measurements were performed by the Amplicor HIV-1 Monitor PCR assay (Roche Diagnostics, Indianapolis, IN) at pre-entry and entry and then during weeks 1, 2, 3, 4, 6, 8, 10 and 12 just prior to each weekly injection of study drug as well as at weeks 13 and 18 (2 and 7 weeks after therapy had been discontinued). With the exception of week 1, CD4+ T-cell counts were measured at the same times.
Conventional LPA were performed on freshly obtained PBMC within 24 hours of collection using the following stimulants: tetanus, Candida, phytohemaglutinin (PHA), HIV-1 p24 antigen, and whole inactivated HIV-1 antigen. LPA is described in terms of the stimulation index (SI), which is defined as the median counts per minute (CPM) in the stimulated replicates divided by the median CPM in the appropriate control replicates.
PegIFN concentrations were measured by Quest Pharmaceutical Services (QPS) [Newark, DE] using an enzyme-linked immunosorbent assay that has been used previously, with lower limits of quantification of 0.250 ng/mL for alfa interferon (18). The assay is specific for pegylated interferon and does not recognize non-pegylated (endogenous) interferon up to a concentration of 25 ng/mL. Post-treatment interferon levels reported as below the lower limit of quantification (LLQ, 0.250 ng/mL) were assigned the value 0.125 ng/mL (one-half the LLQ). Average steady-state trough interferon concentration was calculated as the mean of concentrations at weeks 6, 8, 10 and 12 (a priori definition). For subjects for whom week 0 and at least one other PegIFN concentration were available, area under the pegylated interferon trough concentration-time curve (AUC) was calculated from week 0 to 12 using the linear trapezoidal rule as an estimate of total drug exposure after multiple weekly doses. PegIFN clearance was calculated assuming complete absorption from subcutaneous injections as the dosing rate (180 μg/week, 135 μg/week for subjects with reduced doses) divided by average steady-state trough concentration, divided by 168 to obtain L/h. Weight-adjusted clearance was calculated as clearance divided by the subject’s pre-treatment weight (kg).
The activity of 2’–5’OAS in serum was measured in duplicate by QPS using a radioimmunoassay assay (RIA) kit obtained from EIKEN Chemical Co LTD, Japan and distributed by ALPCO Diagnostic, that measures the amount of ATP converted into oligoadenylate. OAS levels reported as ‘undetectable’ (10 pmol/dL) were assigned the value 5 pmol/dL. Three distinct isoforms of OAS exist in human cells, small, medium and large. Based on the principle of the RIA assay used, it is assumed that this assay measures total activity of OAS.
PBMC stored at weeks 0, 3, 6, 12 and 18 were used to measure IFIG. Quantitation was performed using a novel customized bDNA multiplex assay capable of detecting the expression of 35 genes (11). The expression of individual genes was measured in relation to housekeeping genes, i.e., in a one-to-one relationship. The IFIG levels reported herein represent the average mean fluorescence intensity (MFI) across the individual measured genes.
The study was designed to provide 80% power, with twelve evaluable subjects, to detect a 0.56 log10 change in viral load at week 12, assuming use of a one-sided t-test with alpha set to 5% and a standard deviation of 0.88 log10. After study design, the decision was made to use nonparametric methods and two-sided confidence intervals (CIs) with significance level 0.10 without adjustments for multiple testing. Continuous measures are summarized by medians and associated 90% CI. Rank-based Spearman correlations, adjusted for bias using Fisher’s z-transformation, assessed associations between continuous variables. Baseline viral load was defined as the average of pre-entry and entry levels.
Results
Thirteen HIV-1-infected volunteers enrolled. Two subjects discontinued therapy early in the course of the trial, one due to a central nervous system lymphoma that in retrospect was present prior to enrollment, and the other for travel difficulties; these two subjects were included in the safety analysis only. The remaining 11 subjects, for whom Table 1 presents baseline characteristics, completed 12 weeks of weekly PegIFN injections and two post-treatment follow-up visits to 6 weeks post-treatment.
Table 1.
Baseline demographic and clinical characteristics.
| Subject ID | GENDER | AGE (yrs) | RACE/ETHNICITY* | CD4 count cells/mm3 | CD4 % | HIV-1-RNA (log10 cp/mL) |
|---|---|---|---|---|---|---|
| 001 | M | 62 | AA | 357 | 30.5 | 4.47 |
| 002 | M | 35 | AA | 367.5 | 35.5 | 4.37 |
| 003 | M | 45 | C | 480 | 23.5 | 4.49 |
| 004 | M | 37 | C | 929.5 | 27 | 4.10 |
| 005 | M | 46 | C | 650 | 33.5 | 3.57 |
| 006 | M | 37 | AA | 372 | 30.5 | 4.39 |
| 007 | F | 36 | C | 510 | 21.5 | 4.56 |
| 008 | M | 42 | C | 325.5 | 13 | 4.72 |
| 009 | M | 30 | AA | 298 | 16 | 3.86 |
| 010 | M | 32 | AA | 612 | 27.5 | 3.84 |
| 011 | M | 45 | AI | 359.5 | 26 | 4.76 |
| median | 37 | 372 | 27 | 4.39 |
AA= Black non-Hispanic; C = White non-Hispanic; AI = American Indian / Alaskan Native
Safety and Tolerability
The treatments were generally well tolerated with only 1 subject who experienced grade 2 treatment related depression. The most common treatment-related (or possibly related) adverse events were grade 1 or 2 absolute neutrophil count (ANC) decreases (11/13 (85%) subjects) and fatigue (6/13 [46%]). There were three grade 3 treatment related toxicities: fatigue in one subject and decreased ANC in two subjects. Fatigue was experienced in 5 other subjects: 4 with grade 2 and 1 with grade 1 fatigue reported at some point during the treatment period. Filgrastim (one dose) was administered to one of the subjects and all three completed the trial at reduced doses according to protocol dosage adjustment schemas (Figure 1A-B). Overall the median (Q1, Q3) change from week 0 to week 12 for white blood cell count, ANC, and platelet counts were −2.0 (− 2.6, −0.8) × 103 cells/mm3, −1345 (− 1870, −372) cells/mm3, and −64 (− 79, −28) × 103 cells/mm3, respectively.
Figure 1.

A. Plasma HIV-1 RNA, log10 copies/mL, subject-specific trajectories shown in black, median values shown in blue. Vertical line shows study week at which last injection of pegylated-interferon occurred. The number of subjects with available data is shown at the top of the graph.
B. Plasma HIV-1 RNA changes from baseline, log10 copies/mL, trajectories of subject-specific changes in red (three subjects with reduced dosing) and black (all other subjects). Horizontal line at zero (no change from baseline); vertical line at last weekly injection of study drug.
C. Median changes in CD4+ T-cell count (solid red lines) and percent (broken blue lines) by study week, intervals represent 90% CIs around the medians.
Virologic response
HIV-1 RNA changes from baseline ranged from a decrease of 1.47 to an increase of 0.20 log10 cp/mL at week 1, from −1.82 to −0.18 log10 cp/mL at week 2, and from −1.58 to +0.03 log10 cp/mL at week 12 (Figure 1A-B). The largest median decrease from baseline was at week 2 (− 1.30 [CI −1.75, −0.58]) log10 cp/mL). At the primary endpoint at week 12, the median change was −0.61 (− 1.18, −0.20) log10 cp/mL. There were significant decreases from baseline to each of weeks 1-13 (all CIs excluded value zero); however, at week 18, viral load change from baseline was not significant (CI −0.10, 0.50 log10 cp/mL).
Correlations between pre-entry viral load and changes in viral load from entry to weeks 1, 2 and 12 were not significant. Correlations of week 1, 2 and 12 viral load changes with baseline CD4+ T-cell count (week 12 viral load shown in Figure 4B) and baseline OAS (not shown) were also not significant.
Figure 4.

A. Week 12 serum OAS change from baseline plotted against absolute CD4+ T-cell count at baseline; estimated Spearman correlation r = 0.63 (90% CI, 0.15, 0.87).
B. Week 12 plasma HIV-1 RNA log10 copies/mL changes from baseline plotted against absolute CD4+ T-cell count at baseline; r=-0.40 (90% CI, −0.76, 0.16)
C. IFIG levels at baseline, MFI, plotted against baseline CD4+ T-cell count; estimated Spearman correlation −0.81 (90% CI, −0.95, −0.38).
D. IFIG change from baseline at week 12, MFI, plotted against baseline CD4+ T-cell count; r = 0.76 (90% CI, 0.26, 0.94).
Immunologic responses
Changes in CD4+ T-cell count from baseline were not significant except for small increases at weeks 2 and 4: median 37.8 (CI 28, 76) and 13.5 (7, 57) cells/mm3, respectively (Figure 1C). At week 12, the median change from baseline was −44 (− 95, 85) cells/mm3. Most subjects had CD4+ percent increases from baseline while on treatment, and the increases were statistically significant at week 4 (median 4.5%, CI: 2.5%, 5.5%) and week 12 (1.5%, CI: 1.0%, 4.0%). There was no evidence of a relationship between the corresponding CD4+ T-cell change and viral load change from baseline to week 2 (r = −0.21 [− 0.68, 0.39] or to week 12 (r = 0.23 [− 0.34, 0.67]).
There was no significant association between baseline CD4+ T-cell count and change in viral load from baseline to week 12 (r = −0.40, [CI -0.76, 0.16])(4B) nor between baseline CD4 count and baseline viral load (r = −0.41, [CI -0.77, 0.15]). In addition, there was no significant association between changes in CD4+ T-cell counts (week 0-12) with either absolute week 12 PegIFN levels or AUCweek0-12 concentration curve (r= −0.13 [−0.61,0.42] and r= −0.10 [− 0.59,0.45], respectively).
LPA to all antigens tested during and after treatment were not different from baseline (not shown).
Figure 2A provides an overview of study findings, showing median week-specific peginterferon alfa-2a concentrations and (scaled) median changes in OAS, IFIG expression and plasma HIV-1 RNA by study week. This graph demonstrates the relationships between these parameters and emphasizes the pharmacokinetic and pharmacodynamic effects that accompany the administration of PegIFN. The observed increases in IFIG levels with PegIFN dosing are expected, but further confirm the appropriateness of the selected genes in the panel of IFIGs.
Figure 2.

A. Median log10 interferon (ng/mL; black squares, blacks solid line), median OAS change from baseline (fold-change; red diamonds, red broken line), median IFIG change from baseline (MFI; blue circles, blue dashed line) and median plasma HIV-1 RNA change from baseline (log10 copies/mL; green triangles, green broken line) plotted against study week. Intervals represent 90% CIs around medians. Y-axis truncated at 2.5. OAS fold-change CIs: week 1 (1.3 to 4.8), week 2 (1.7 to 8.0), week 3 (1.2 to 5.7), week 4 (1.2 to 5.0), week 6 (1.7 to 4.4), week 8 (1.2 to 7.7), week 10 (1.0 to 7.7), week 12 (1.2 to 4.5), week 13 (0.7 to 3.9) and week 18 (1.3 to 3.4).
B. Scatterplot of subject-specific changes in viral load against concurrent changes in OAS protein at week 0 (open black circle), week 1 (filled red circle; estimated Spearman correlation r = −0.75 [− 0.93, −0.28]), week 2 (blue square; r = −0.61 [− 0.87, −0.09]), and week 12 (green diamond; r = −0.51 [CI: −0.81, 0.02]).
C. Scatterplot of subject-specific changes in viral load against changes in IFIG at week 0 (open black circle), week 3 (filled red circle; r = -0.62 [90% CI -0.90, 0.02]), week 6 (blue square; r = -0.64 [-0.90, -0.02]), week 12 (green diamond; r = -0.74 [-0.93, -0.21]) and week 18 (open gray diamond; r = 0.07 [−0.64, 0.71]).
Pharmacokinetics
PegIFN trough concentrations increased rapidly and remained elevated during treatment (through week 12) (Figure 2A). Steady state was achieved by week 6 and was maintained during the remainder treatment period. Weekly trough PegIFN levels were consistently stable in each subject after reaching steady state. At week 12, PegIFN trough concentrations ranged from 10.2 to 27.5 ng/mL, and the coefficient of variation (CV) was 25%. Table 2 summarizes week-specific PegIFN concentrations and derived pharmacokinetic parameters AUC, and the estimated systemic clearance at steady-state.
Table 2.
Statistical summary of pharmacokinetic and pharmacodynamic parameters.
| Week | N | Median | 90% CI on Median | CV(%) | Range (Min, Max) | ||
|---|---|---|---|---|---|---|---|
| Interferon | Concentration (ng/mL) | 1 | 10 | 11.80 | (9.94, 16.60) | 28% | (8.52, 19.20) |
| 2 | 11 | 16.70 | (13.80, 19.40) | 32% | (3.84, 21.20) | ||
| 3 | 11 | 18.10 | (10.10, 20.40) | 42% | (2.96, 27.50) | ||
| 6 | 11 | 21.00 | (19.50, 23.40) | 22% | (9.95, 27.80) | ||
| 12 | 11 | 21.90 | (19.30, 25.20) | 25% | (10.20, 27.50) | ||
| 13 | 11 | 6.69 | (3.42, 11.00) | 68% | (3.01, 22.10) | ||
| 18 | 10 | 0.13 | (0.13, 0.49) | 83% | (0.13, 0.77) | ||
| Average steady state concentration (ng/mL) | 11 | 21.53 | (20.08, 24.25) | 20% | (11.28, 26.58) | ||
| Clearance (L/h) | 11 | 0.047 | (0.043, 0.053) | 21% | (0.037, 0.071) | ||
| Weight adjusted clearance (L/h/kg) | 11 | 0.0006 | (0.0005, 0.0007) | 31% | (0.0004, 0.0012) | ||
| AUC0-12 (ng.wk/mL) | 11 | 219.45 | (183.34, 242.15) | 17% | (147.67, 275.96) | ||
| OAS | Concentration (pmol/dL) | 0 | 11 | 86.74 | (43.01, 148.06) | 125% | (14.91, 588.91) |
| 1 | 10 | 202.03 | (132.99, 304.46) | 64% | (5.00, 484.60) | ||
| 2 | 10 | 212.92 | (170.56, 310.71) | 39% | (150.71, 445.50) | ||
| 3 | 11 | 194.69 | (128.57, 346.88) | 54% | (104.45, 492.49) | ||
| 6 | 11 | 234.57 | (120.64, 293.92) | 50% | (79.38, 456.52) | ||
| 12 | 11 | 177.11 | (114.62, 285.04) | 57% | (79.82, 485.65) | ||
| 13 | 11 | 166.69 | (123.70, 282.89) | 49% | (62.17, 359.07) | ||
| 18 | 10 | 107.52 | (80.68, 200.89) | 46% | (71.71, 242.99) | ||
| Change in concentration from baseline | 1 | 10 | 71.84 | (51.48, 161.52) | (-104.31, 164.07) | ||
| 2 | 10 | 140.69 | (67.13, 176.22) | (-143.41, 233.46) | |||
| 3 | 11 | 127.57 | (31.50, 170.47) | (-96.42, 294.49) | |||
| 6 | 11 | 134.02 | (61.69, 193.39) | (-132.40, 222.97) | |||
| 12 | 11 | 100.04 | (18.78, 216.45) | (-103.26, 317.49) | |||
| 13 | 11 | 93.72 | (-29.51, 123.67) | (-229.84, 271.07) | |||
| 18 | 10 | 51.75 | (19.66, 103.52) | (-60.86, 114.15) | |||
| IFIG | Concentration (MFI) | 0 | 8 | 4.94 | (4.53, 6.04) | 13% | (4.46, 6.16) |
| 3 | 8 | 6.21 | (5.80, 6.57) | 6% | (5.63, 6.70) | ||
| 6 | 8 | 6.44 | (6.24, 6.75) | 5% | (5.85, 6.87) | ||
| 12 | 8 | 6.45 | (6.27, 6.73) | 4% | (6.16, 6.95) | ||
| 18 | 7 | 5.04 | (4.61, 6.02) | 15% | (3.74, 6.02) | ||
| Change in concentration from baseline | 3 | 8 | 1.09 | (0.41, 1.59) | (-0.41, 2.17) | ||
| 6 | 8 | 1.15 | (0.58, 2.10) | (0.24, 2.34) | |||
| 12 | 8 | 1.30 | (0.57, 2.17) | (0.23, 2.49) | |||
| 18 | 7 | -0.17 | (-0.41, 0.63) | (-0.72, 0.63) | |||
There was no correlation between viral load declines and concurrent PegIFN concentrations for weeks 1, 2 and 12, respectively, or between the AUC and viral load at weeks 1, 2 or 12. Three subjects (002, 006, and 011) did not take full doses (red dashed lines in Figure 1B and red triangles in Figures 3A and B). Their total number of doses administered was 10.75 (i.e., 10 doses followed by 3 at 180 μg and 135μg, respectively), 10.25 and 9.25 of a possible 12. Although the subjects whose dose of PegIFN was reduced were among those with the lowest viral load declines, both their absolute PegIFN concentrations at week 12 (Figure 3A) and their AUCs (Figure 3B) covered the spectrum of values observed among study subjects.
Figure 3.
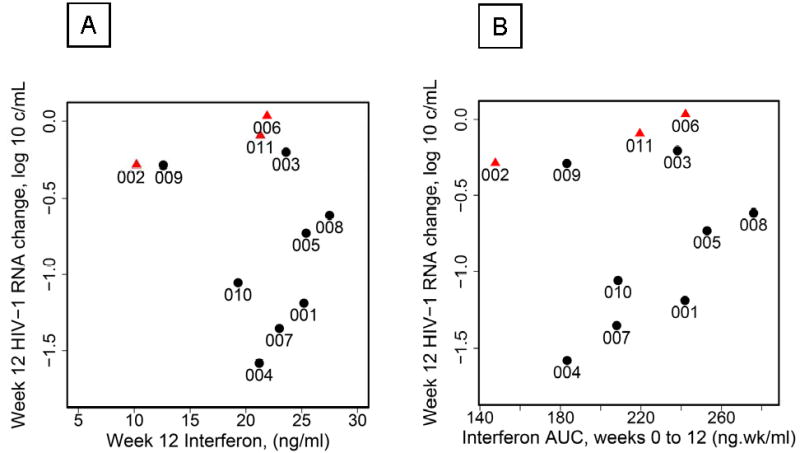
A. Week 12 plasma HIV-1 RNA changes from baseline (average of pre-entry and entry, log10 copies/mL) plotted against week 12 plasma concentrations for pegylated interferon alpha-2a. Red triangles, 3 subjects with reduced dosing; black circles, remaining subjects; estimated Spearman correlation r = −0.11 (90% CI −0.60 to 0.44).
B. Week 12 plasma HIV-1 RNA changes from baseline (average of pre-entry and entry, log10 copies/mL) plotted against area under the concentration-time curve (weeks 0-12) for interferon. Red triangles, 3 subjects with reduced dosing; black circles, remaining subjects; r = 0.16 (90% CI, −0.39 to 0.63)
Pharmacodynamic responses
Pretreatment OAS concentrations ranged from 14.9 to 588.9 pmol/dL; CV was 59% when a single outlier was excluded. Figure 2A shows OAS concentrations increasing to week 3 and remaining elevated during treatment. Subject-specific averages over weeks 6 to 12 ranged from 112 to 470 pmol/dl (CV of 48%, not shown). At week 12, OAS concentrations ranged from 79.8 to 485.6 pmol/dL. OAS exhibited larger variability than PegIFN; the CV at week 12 was 57%.
Changes in OAS were not significantly correlated with concurrent PegIFN concentrations at weeks 1, 2 or 12.
Baseline OAS and baseline viral load levels or CD4+ T-cell count were not significantly correlated; however, at weeks 1 and 2, subjects with larger increases in OAS tended to have larger declines in viral load (r = −0.75 [− 0.93, −0.28] and −0.61 [− 0.87, −0.09], respectively, while the correlation at week 12 was not statistically significant (Figure 2B). Subjects with higher baseline CD4+ T-cell counts tended to have larger increases in OAS (r = 0.63 [0.15, 0.87] at week 12 (Figure 4A); week 1 and 2 correlations are also statistically significant).
Correlations between viral load changes and IFIG level changes from baseline are demonstrated in Figure 2C and show a consistent relationship between the induction of IFIG and change in viral load over the treatment period. At weeks 6 and 12, correlations between decline in viral load and the level of IFIG induction were statistically significant.
Baseline IFIG levels were also highly predictive of changes in viral load at weeks 2 and 12 (but not at week 1): subjects with higher IFIG expression levels prior to therapy showed poorer responses to therapy. At both weeks 2 and 12, the estimated correlations between baseline IFIG levels and viral load changes were 0.66 (0.06, 0.91). (The estimated correlation of baseline IFIG and week 1 viral-load change was also large [r=0.65], but did not reach statistical significance [− 0.05, 0.92]). Thus subjects with higher baseline IFIG levels tended to have either increases or smaller decreases in viral load, as was seen with OAS.
Baseline IFIG levels were inversely correlated with baseline CD4+ T-cell counts: r=−0.81 (− 0.95, −0.38) (figure 4C). Changes in IFIG levels at week 12 were positively correlated with baseline CD4+ T-cell counts: r=0.76 (0.26, 0.94; figure 4D).
Discussion
This clinical trial represents the first report of PegIFN monotherapy for the treatment of HIV-1 in the absence of chronic viral hepatitis or opportunistic malignancies. After 12 weeks of treatment, subjects experienced a median decline of 0.61 log10 cp/mL which is comparable to the virologic effect of many antiretroviral agents, particularly nucleoside reverse transcriptase inhibitors. However, no apparent plasma concentration-response was observed with respect to individual drug exposure. While the virologic response of alfa interferon therapy is dose dependent in the therapeutic setting of HCV disease, this relationship does not appear to hold in the setting of HIV-1 disease (19). This study was not designed to address the effect of multiple dosing regimens in this context. There was also no significant association between changes in absolute CD4+ T-cell counts and PegIFN levels. This observation does not provide support for the hypothesis that type I interferons are pro-apoptotic molecules in this cellular compartment in the setting of HIV-1 infection (20). In addition, there was no significant association between decline in viral load and changes in absolute CD4 count, suggesting that the observed viral load decline is not accounted for by fewer CD4+ T-cells producing virus.
Since the antiviral properties of interferon were first recognized in the late 1950’s, efforts to identify additional viruses to target as well as better tolerated preparations have continued (21). Early in the AIDS epidemic, researchers sought to learn whether interferon-alfa could play a role in the therapeutic management of HIV-1 (22). Krown, Volberding and others recognized a potential anti-HIV-1 clinical benefit of interferon-alfa therapy in the setting of its use for the treatment of Kaposi’s sarcoma (23-26). Early accounts of the anti-HIV-1 effects of interferon-alfa treatment presented by Lane et. al. (27) and de Wit et. al. (28) in this setting demonstrated a modest decline in p24 antigen in a subset of patients. Several clinical trials have employed various interferon-alfa preparations in combination with antiviral medications that supported the safety and potential efficacy of this approach (16;17;29-34).
Among the few trials that have treated subjects without other antiviral agents, Skillman et al. administered interferon alfa–n3 in 20 subjects with CD4 counts > 400 cells/mm3; a cohort similar to those enrolled in our study (35). In this dose ranging study, those receiving the highest dose of an average of 44 MIU/week showed a 1.86 log10 reduction at 60 days of treatment. Also similar to our study, adverse events were uncommon and CD4+ T-cell decline was modest and associated with CD4+ percent increases. Hatzakis et al. undertook a 28-day trial of recombinant interferon alfa-2b as monotherapy for HIV-1 (36). Baseline CD4+ T-cell count was 394 cells/mm3. The average viral load decline was 0.89, 1.10, 1.03, and 0.97 log10 on days 7, 14, 21, and 28, respectively. The adverse event profile was noted for grade I symptoms that were not dose-limiting.
The anti-HIV-1 properties of interferon alfa have been examined in the setting of HCV treatment (37-39). Neumann et. al. examined the HIV-1 kinetics in nine study participants with detectable HIV-1 loads prior to initiation of interferon alfa-2b treatment. The decline in HIV-1 load was 1.1 log10 cp/mL after one week and the changes in HIV-1 load were not correlated with interferon concentrations. This is consistent with our findings and is a point further emphasized by the lack of a significant association of viral load declines and interferonAUC measures. In the APRICOT study, among those HIV-HCV co-infected participants who had detectable HIV plasma viral loads at entry, a decline of 0.7 log10 cp/mL HIV RNA was observed at 48 weeks (39).
The observed PegIFN plasma concentrations (measured at the trough) were in the range of expected values for the doses of PegIFN administered in this study and were remarkably stable once steady-state was achieved in all subjects. Given a constant weekly dosing rate, this also suggests constancy of PegIFN clearance in these subjects over the 12-week study period. Our clearance estimates at steady-state (dosing rate/mean trough steady state concentration) in the range of 0.037 – 0.071 L/hr are somewhat lower than previously reported using noncompartmental approaches (Dose/AUC0-168 hrs) (40;41). This probably reflects our use of trough PegIFN concentrations that underestimated the true mean steady state concentration over a weekly dosing interval. However, a concentration-response relationship was not apparent between either PegIFN and HIV-1 plasma viral load changes or peg-interferon and OAS levels. This was also the case when analyzing AUC0-12week-trough as a measure of overall drug exposure and the response parameters of interest.
The findings in this study go beyond the primary objective of determining the viral load decline that follows PegIFN administration in the absence of active HBV and HCV infections or other anti-viral agents. Rather, this study explores correlates of antiviral activity. It suggests that the anti-HIV-1 effect could be mediated by interferon induced antiviral responses, based on correlations with OAS and IFIG levels that influence the antiviral response. These factors are likely reflected in the observation that induction of the interferon response pathway prior to initiation of therapy results in refractoriness to an anti-virologic response following exogenously administered interferon.
This novel information about potential pathways for the antiviral effect raises several questions not addressed in the design of this study. The inverse relationship between baseline CD4+ T-cell counts and IFIG levels was observed among that subset of participants least likely to respond to exogenous interferon with a further increase in IFIG and OAS levels and reduction in viral load. The mechanism for these relationships is not known and may represent a unique feature of HIV-1 disease progression not previously appreciated. Longitudinal studies will be required to identify which host and/or viral factors contribute most to this constellation of conditions.
Acknowledgments
The ACTG Study Team wishes to acknowledge the study participants without whose participation the study would not have been possible. We also wish to acknowledge the active involvement and support of the Division of AIDS Representative, Marjorie Dehlenger, DNSc, the Study Pharmacist, Paul Tran, R.Ph., and the Clinical Trials Specialists Vicki Stocker, RN, MS, and Lara Hosey, MS. The team would also like to acknowledge the contributions of statistician Tianxi Cai, PhD, to the study and to Teresa Greenwell-Wild, NIDCR and Dr. Xiao-Li Huang from the University of Pittsburgh ACTG Immunology Specialty Laboratory, for coordinating and processing of specimens.
We would like to thank Roche Pharmaceutical for supplying Pegasys® and Amgen for providing Filgastrim®.
Grant support was provided by the ACTG grant (1U01-AI068636), the ACTG Statistical and Data Analysis Center Grant (1U01-AI068634), and the individual site grants (1U01-AI069471 [NU]; 1U01-AI069432 [UCSD]; 1U01-AI069484 [DU]) and Immunology Support Laboratory grants 201IC001 [UCD] and 204IC006 [UP]. This research was supported in part by the Intramural Research Program of the NIH, National Institute of Dental and Craniofacial Research.
Footnotes
This work was previously presented at the 4th International AIDS Society Conference on HIV Pathogenesis, Treatment and Prevention 22-25 July 2007, Sydney, Australia (Abstract TUPE0050) and the 16th Conference on Retroviruses and Opportunistic Infections, Montreal, Canada, February 8-11, 2009 (Abstracts 89 and 527).
Potential conflicts of interest. No authors have any conflicts to report.
Reference List
- 1.Biron CA. Role of early cytokines, including alpha and beta interferons (IFN-alpha/beta), in innate and adaptive immune responses to viral infections. Semin Immunol. 1998;10(5):383–90. doi: 10.1006/smim.1998.0138. [DOI] [PubMed] [Google Scholar]
- 2.Knop J. Immunologic effects of interferon. J Invest Dermatol. 1990;95(6 Suppl):72S–4S. doi: 10.1111/1523-1747.ep12874780. [DOI] [PubMed] [Google Scholar]
- 3.Le Bon A, Etchart N, Rossmann C, et al. Cross-priming of CD8+ T cells stimulated by virus- induced type I interferon. Nat Immunol. 2003;4(10):1009–15. doi: 10.1038/ni978. [DOI] [PubMed] [Google Scholar]
- 4.Nokta MA, Reichman RC, Pollard RB. Pathogenesis of Viral Infections. In: Galasso GJ, Whitley RJ, Merigan TC, editors. Antiviral Agents and Viral Diseases of Man. Third. New York: Raven Press; 1990. pp. 49–85. [Google Scholar]
- 5.Samuel CE. Antiviral actions of interferons. Clin Microbiol Rev. 2001;14(4):778–809. doi: 10.1128/CMR.14.4.778-809.2001. table. [DOI] [PMC free article] [PubMed] [Google Scholar]
- 6.Malmgaard L. Induction and regulation of IFNs during viral infections. J Interferon Cytokine Res. 2004;24(8):439–54. doi: 10.1089/1079990041689665. [DOI] [PubMed] [Google Scholar]
- 7.Shirazi Y, Pitha PM. Alpha interferon inhibits early stages of the human immunodeficiency virus type 1 replication cycle. J Virol. 1992;66(3):1321–8. doi: 10.1128/jvi.66.3.1321-1328.1992. [DOI] [PMC free article] [PubMed] [Google Scholar]
- 8.Dianzani F, Castilletti C, Gentile M, Gelderblom HR, Frezza F, Capobianchi MR. Effects of IFN alpha on late stages of HIV-1 replication cycle. Biochimie. 1998;80(8-9):745–54. doi: 10.1016/s0300-9084(99)80028-5. [DOI] [PubMed] [Google Scholar]
- 9.Peng G, Lei KJ, Jin W, Greenwell-Wild T, Wahl SM. Induction of APOBEC3 family proteins, a defensive maneuver underlying interferon-induced anti-HIV-1 activity. J Exp Med. 2006;203(1):41–6. doi: 10.1084/jem.20051512. [DOI] [PMC free article] [PubMed] [Google Scholar]
- 10.Chen K, Huang J, Zhang C, et al. Alpha interferon potently enhances the anti-human immunodeficiency virus type 1 activity of APOBEC3G in resting primary CD4 T cells. J Virol. 2006;80(15):7645–57. doi: 10.1128/JVI.00206-06. [DOI] [PMC free article] [PubMed] [Google Scholar]
- 11.Lempicki RA, Polis MA, Yang J, et al. Gene expression profiles in hepatitis C virus (HCV) and HIV coinfection: class prediction analyses before treatment predict the outcome of anti-HCV therapy among HIV-coinfected persons. J Infect Dis. 2006;193(8):1172–7. doi: 10.1086/501365. [DOI] [PubMed] [Google Scholar]
- 12.Perry CM, Jarvis B. Peginterferon-alpha-2a (40 kD): a review of its use in the management of chronic hepatitis C. Drugs. 2001;61(15):2263–88. doi: 10.2165/00003495-200161150-00013. [DOI] [PubMed] [Google Scholar]
- 13.Rajender RK, Modi MW, Pedder S. Use of peginterferon alfa-2a (40 KD) (Pegasys) for the treatment of hepatitis C. Adv Drug Deliv Rev. 2002 Jun 17;54(4):571–86. doi: 10.1016/s0169-409x(02)00028-5. [DOI] [PubMed] [Google Scholar]
- 14.Fried MW, Shiffman ML, Reddy KR, et al. Peginterferon alfa-2a plus ribavirin for chronic hepatitis C virus infection. N Engl J Med. 2002;347(13):975–82. doi: 10.1056/NEJMoa020047. [DOI] [PubMed] [Google Scholar]
- 15.Chan HL, Leung NW, Hui AY, et al. A randomized, controlled trial of combination therapy for chronic hepatitis B: comparing pegylated interferon-alpha2b and lamivudine with lamivudine alone. Ann Intern Med. 2005;142(4):240–50. doi: 10.7326/0003-4819-142-4-200502150-00006. [DOI] [PubMed] [Google Scholar]
- 16.Adalid-Peralta L, Godot V, Colin C, et al. Stimulation of the primary anti-HIV antibody response by IFN-alpha in patients with acute HIV-1 infection. J Leukoc Biol. 2008;83(4):1060–7. doi: 10.1189/jlb.1007675. [DOI] [PMC free article] [PubMed] [Google Scholar]
- 17.Emilié D, Burgard M, Lascoux-Combe C, et al. Early control of HIV replication in primary HIV-1 infection treated with antiretroviral drugs and pegylated IFN α: results from the Primoferon A (ANRS 086) Study. AIDS. 2001;15:1345–7. doi: 10.1097/00002030-200107270-00014. [DOI] [PubMed] [Google Scholar]
- 18.Di Bisceglie AM, Ghalib RH, Hamzeh FM, Rustgi VK. Early virologic response after peginterferon alpha-2a plus ribavirin or peginterferon alpha-2b plus ribavirin treatment in patients with chronic hepatitis C. J Viral Hepat. 2007;14(10):721–9. doi: 10.1111/j.1365-2893.2007.00862.x. [DOI] [PubMed] [Google Scholar]
- 19.Diago M, Crespo J, Olveira A, et al. Clinical trial: pharmacodynamics and pharmacokinetics of retreatment with fixed-dose induction of peginterferon alpha-2a in hepatitis C virus genotype 1 true non-responder patients. Aliment Pharmacol Ther. 2007;26(8):1131–8. doi: 10.1111/j.1365-2036.2007.03470.x. [DOI] [PubMed] [Google Scholar]
- 20.Herbeuval JP, Shearer GM. HIV-1 immunopathogenesis: how good interferon turns bad. Clin Immunol. 2007;123(2):121–8. doi: 10.1016/j.clim.2006.09.016. [DOI] [PMC free article] [PubMed] [Google Scholar]
- 21.Isaacs AJ, Lindenmann JA. Virus interference. I. The interferon. Proc R Soc Lond B Biol Sci. 1957;147(927):258–67. doi: 10.1098/rspb.1957.0048. [DOI] [PubMed] [Google Scholar]
- 22.Ho DD, Hartshorn KL, Rota TR, et al. Recombinant human interferon alfa-A suppresses HTLV-III replication in vitro. Lancet. 1985;1(8429):602–4. doi: 10.1016/s0140-6736(85)92144-0. [DOI] [PubMed] [Google Scholar]
- 23.Krown SE, Real FX, Vadhan-Raj S, et al. Kaposi’s sarcoma and the acquired immune deficiency syndrome. Treatment with recombinant interferon alpha and analysis of prognostic factors. Cancer. 1986;57(8 Suppl):1662–5. doi: 10.1002/1097-0142(19860415)57:8+<1662::aid-cncr2820571305>3.0.co;2-y. [DOI] [PubMed] [Google Scholar]
- 24.Krown SE, Real FX, Cunningham-Rundles S, et al. Preliminary observations on the effect of recombinant leukocyte A interferon in homosexual men with Kaposi’s sarcoma. N Engl J Med. 1983;308(18):1071–6. doi: 10.1056/NEJM198305053081806. [DOI] [PubMed] [Google Scholar]
- 25.Abrams DI, Volberding PA. Alpha interferon therapy of AIDS-associated Kaposi’s sarcoma. Semin Oncol. 1986;13(3 Suppl 2):43–7. [PubMed] [Google Scholar]
- 26.Volberding PA, Mitsuyasu R. Recombinant interferon alpha in the treatment of acquired immune deficiency syndrome-related Kaposi’s sarcoma. Semin Oncol. 1985;12(4 Suppl 5):2–6. [PubMed] [Google Scholar]
- 27.Lane HC, Kovacs JA, Feinberg J, et al. Anti-retroviral effects of interferon-alpha in AIDS-associated Kaposi’s sarcoma. Lancet. 1988;2(8622):1218–22. doi: 10.1016/s0140-6736(88)90811-2. [DOI] [PubMed] [Google Scholar]
- 28.de Wit R, Schattenkerk JK, Boucher CA, Bakker PJ, Veenhof KH, Danner SA. Clinical and virological effects of high-dose recombinant interferon-alpha in disseminated AIDS-related Kaposi’s sarcoma. Lancet. 1988 Nov 26;2(8622):1214–7. doi: 10.1016/s0140-6736(88)90810-0. [DOI] [PubMed] [Google Scholar]
- 29.Krown SE, Gold JW, Niedzwiecki D, et al. Interferon-alpha with zidovudine: safety, tolerance, and clinical and virologic effects in patients with Kaposi sarcoma associated with the acquired immunodeficiency syndrome (AIDS) Annals of Internal Medicine. 1990;112(11):812–21. doi: 10.7326/0003-4819-112-11-812. published erratum appears in Ann Intern Med 1990 Aug 15;113(4):334. [DOI] [PubMed] [Google Scholar]
- 30.Krown SE, Lee JY, Lin L, Fischl MA, Ambinder R, Von Roenn JH. Interferon-alpha 2b with protease inhibitor-based antiretroviral therapy in patients with AIDS-associated Kaposi sarcoma: an AIDS malignancy consortium phase I trial. J Acquir Immune Defic Syndr. 2006;41(2):149–53. doi: 10.1097/01.qai.0000194237.15831.23. [DOI] [PubMed] [Google Scholar]
- 31.Krown SE, Aeppli D, Balfour HH., Jr Phase II, randomized, open-label, community-based trial to compare the safety and activity of combination therapy with recombinant interferon-alpha2b and zidovudine versus zidovudine alone in patients with asymptomatic to mildly symptomatic HIV infection. HIV Protocol C91-253 Study Team. J Acquir Immune Defic Syndr Hum Retrovirol. 1999;20(3):245–54. doi: 10.1097/00042560-199903010-00005. [DOI] [PubMed] [Google Scholar]
- 32.Krown SE, Paredes J, Bundow D, Polsky B, Gold JW, Flomenberg N. Interferon-alpha, zidovudine, and granulocyte-macrophage colony-stimulating factor: a phase I AIDS Clinical Trials Group study in patients with Kaposi’s sarcoma associated with AIDS. J Clin Oncol. 1992;10(8):1344–51. doi: 10.1200/JCO.1992.10.8.1344. [DOI] [PubMed] [Google Scholar]
- 33.Mildvan D, Bassiakos Y, Zucker ML, et al. Synergy, activity and tolerability of zidovudine and interferon-alpha in patients with symptomatic HIV-1 infection: AIDS Clincal Trial Group 068. Antivir Ther. 1996;1(2):77–88. [PubMed] [Google Scholar]
- 34.Fernandez-Cruz E, Lange JM, Frissen J, et al. Zidovudine plus interferon-alpha versus zidovudine alone in HIV-infected symptomatic or asymptomatic persons with CD4+ cell counts > 150 × 10(6)/L: results of the Zidon trial. Zidon Study Group. AIDS. 1995;9(9):1025–35. [PubMed] [Google Scholar]
- 35.Skillman DR, Malone JL, Decker CF, et al. Phase I trial of interferon alfa-n3 in early-stage human immunodeficiency virus type 1 disease: evidence for drug safety, tolerance, and antiviral activity. J Infect Dis. 1996;173(5):1107–14. doi: 10.1093/infdis/173.5.1107. [DOI] [PubMed] [Google Scholar]
- 36.Hatzakis A, Gargalianos P, Kiosses V, et al. Low-dose IFN-alpha monotherapy in treatment-naive individuals with HIV-1 infection: evidence of potent suppression of viral replication. J Interferon Cytokine Res. 2001;21(10):861–9. doi: 10.1089/107999001753238114. [DOI] [PubMed] [Google Scholar]
- 37.Torriani FJ, Ribeiro RM, Gilbert TL, et al. Hepatitis C virus (HCV) and human immunodeficiency virus (HIV) dynamics during HCV treatment in HCV/HIV coinfection. J Infect Dis. 2003;188(10):1498–507. doi: 10.1086/379255. [DOI] [PubMed] [Google Scholar]
- 38.Neumann A, Polis M, Rozenberg L, et al. Differential antiviral effect of PEG-interferon-alpha-2b on HIV and HCV in the treatment of HIV/HCV co-infected patients. AIDS. 2007;21(14):1855–65. doi: 10.1097/QAD.0b013e32825eaba7. [DOI] [PubMed] [Google Scholar]
- 39.Torriani FJ, Rodriguez-Torres M, Rockstroh JK, et al. Peginterferon Alfa-2a plus ribavirin for chronic hepatitis C virus infection in HIV-infected patients. N Engl J Med. 2004 Jul 29;351(5):438–50. doi: 10.1056/NEJMoa040842. [DOI] [PubMed] [Google Scholar]
- 40.Zeuzem S, Welsch C, Herrmann E. Pharmacokinetics of peginterferons. Semin Liver Dis. 2003;23(Suppl 1):23–8. doi: 10.1055/s-2003-41631. [DOI] [PubMed] [Google Scholar]
- 41.Bruno R, Sacchi P, Ciappina V, et al. Viral dynamics and pharmacokinetics of peginterferon alpha-2a and peginterferon alpha-2b in naive patients with chronic hepatitis c: a randomized, controlled study. Antivir Ther. 2004;9(4):491–7. [PubMed] [Google Scholar]