Abstract
Purpose
MR thermometry using the proton resonance frequency shift (PRFS) method has been used to measure temperature changes during clinical hyperthermia treatment. However, frequency drift of the MRI system can add large errors to the measured temperature change. These drifts can be measured and corrected using oil references placed around the treatment region. In this study, the number and position of four or more oil references were investigated to obtain a practical approach to correct frequency drift during PRFS thermometry in phantoms and in vivo.
Materials and Methods
Experiments were performed in a 140 MHz four antenna mini-annular phased array (MAPA) heat applicator (for treatment of extremity tumors) and an applicator for heating of the breast, with symmetric and asymmetric positioning of the oil references, respectively. Temperature change PRFS images were obtained during an hour or more of measurement with no application of heat. Afterwards, errors in calculating temperature change due to system drift were quantified with and without various oil reference correction arrangements.
Results
Results showed good temperature correction in phantoms and in a human leg, with average errors of 0.28°C and 0.94°C respectively. There was further improvement in the leg when using 8 or more oil references, reducing the average error to 0.44°C, while the phantoms showed no significant improvement.
Conclusions
These results indicate that oil reference correction performs well in vivo, and that eight references can improve the correction by up to 0.5°C compared to four references.
Keywords: Magnetic Resonance Temperature Imaging (MRTI), Non-Invasive Thermometry, Oil Reference, Correction, MR Frequency Drift
Introduction
Numerous studies have shown that the combination of radiation therapy and hyperthermia, when delivered at moderate temperatures (40°–45°C) for sustained times (30–90 minutes), can help to provide palliative relief and augment tumor response, local control, and survival [1–3]. Positive phase III clinical trials comparing radiation therapy with or without hyperthermia have been reported for several sites, including recurrent breast cancer on the chest wall [4], melanoma [5], advanced head and neck cancer [6], esophageal cancer [7], and cervical cancer [8, 9]. In some trials where temperatures were measured invasively during treatment, retrospective analysis has shown that descriptors of temperatures achieved were significantly correlated with beneficial outcome [10–14]. The dependence of treatment success on achieved temperature highlights the need for accurate thermal dosimetry, so that prescribed thermal dose can be delivered to the tumor. In fact, phase III trials [15–17] have demonstrated that controlled delivery of thermal dose is clearly related to treatment outcome. However, this control was only possible with extensive invasive thermometry, which cannot be done in a routine fashion, particularly in deep-seated tumors.
Fortunately, a number of research groups have demonstrated that magnetic resonance (MR) imaging is effective and accurate for noninvasively assessing temperature changes in tissues associated with absorption of nonionizing radiation [18–24]. The most common MR imaging method used to measure temperature changes is the proton resonant frequency shift (PRFS) method. The PRFS method measures change in the temperature dependent proton resonance frequency of water in tissue and uses it to calculate temperature change. This temperature dependence of MR frequency is a well-established constant for most materials and has been well established in the literature [25]. Because the MR image phase is a linear function of the frequency (at a fixed echo time–TE), a change in temperature results in a change in MR image phase, allowing temperature changes to be measured. This is accomplished by acquiring MR phase images at two points in time and using the phase difference between the images to calculate temperature change at each pixel. PRFS imaging thus results in temperature sampling densities of the tumor volume and surrounding tissue that are the pixel density of the acquired digital images. Because of this high density of temperature measurements, the PRFS method provides data that may be used for improved treatment planning, dynamic control of treatment delivery [26], and post-treatment assessment of tissue damage [27].
While the PRFS method thus shows promise, a major difficulty with its use is image phase “drift” (slow change) over the time of a series of temperature measurements which may span 1 to 2 hours for hyperthermia therapy. The phase drift seen reflects a variety of factors such as the gradual decrease in the main magnetic field, B0, over time due to slow loss of persistence of the superconducting current or temperature changes of the magnet structure or gradient coils that can also cause non monotonic changes. A maximum specification of the rate of magnetic field drift in a modern commercial MRI system magnet is 0.1 ppm/hour, or approximately 6.4 Hz/hour at 1.5T. The resonant frequency of water also changes at −0.01 ppm/°C, or 0.64 Hz/°C at 1.5T, meaning that an hour long hyperthermia treatment could have up to 10°C of temperature error due to B0 drift, alone, if not corrected. Considering that the maximum amount of temperature change for a typical hyperthermia treatment is between 6–8 °C, field drift could be a significant problem for accurate measurement of temperature change. Fortunately, this high a rate of main field drift is seldom seen, with a rate of 3 Hz/hour being more typical in our experience.
Many attempts have been made to correct for drift inside the tumor and surrounding tissue. One approach is to provide reference materials in the image that change phase with magnetic field drift. De Poorter, et.al. [28] were the first to place water gelatin references around a phantom and linearly extrapolate the phase changes due to B0 drift from the references to inside the phantom. El-Sharkawy and colleagues [29] used a saline filled hose around a phantom as a reference material and used a least-squares fit of measured field changes in the saline to interpolate the field change inside a gel phantom. Finally, Wust and Gellermann have used similar interpolation methods but instead used body fat or external water as the reference material [30–32].
While all of these methods have been shown to be effective in correcting for substantial B0 drift, there have been several issues that have not been thoroughly examined. First, while De Poorter and colleagues have looked at field correction with three references in the legs of human volunteers, there has been no investigation into whether using more references will improve correction or how well such references perform inside a RF hyperthermia applicator. Many hyperthermia treatments are now performed in applicators with RF antennas that couple to the skin through a water bolus. This water bolus is often filled with heated water to provide comfort and optimal heat transfer. The heat of the water along with the body of the patient can heat the references in a poorly predictable way. Both De Poorter and El-Sharkawy used water-based reference materials, which, if inside the water bolus could heat up and change phase. This phase change would influence the field change measured and reduce the effectiveness of correction. El-Sharkawy and colleagues did perform phantom experiments in a hyperthermia applicator. However, they did not perform in vivo experiments. Also, their temperature correction was insufficient due to poor frequency resolution of their field measurement. Lastly, the fat referencing method used by Gellerman and Wust has some potential error due to the presence of a small percentage of water in adipose tissue, which can limit the effectiveness of that approach when there is not enough ‘pure’ fat to get a suitable sample region.
In this paper, the performance of oil references for field drift correction is quantified inside of hyperthermia applicators containing phantoms and in vivo tissue. A major advantage of oil references is that their MR resonant frequency change with temperature is nearly zero [33] in comparison to that of water. Thus any change in their MR resonant frequency will be due only to magnetic field drift and not due to temperature dependence. Since the temperature sensitivity of water is known precisely, the experiments can be performed without heating in order to focus the investigation on the adequacy of the oil references for field drift correction. In addition, to guide future use of oil references for B0 drift correction, we investigate the use of four, eight, and twelve oil references to determine the effect of more oil references on the decrease of the correction error. Lastly, different field fitting methods are compared to determine if there is a difference in their correction of the field drift, as averaged over the entire image,
Theory
Field Fitting Methods
Three methods were used to fit the phase differences in the oil references to a function that could be used to estimate phase or frequency drift at any point in the image field-of-view, (a map of the phase changes due to field drift). The first method used was linear least-squares fitting. The three variable linear fit accounts for a constant background term and linear x and y terms, the equation for which is
| (1) |
where ΔB0 is the frequency offset from the main magnetic field (Hz) and x,y are points along the two axes of the image. The second method is a second-order least-squares fit to six variables which was adopted from the field fitting equation of El-Sharkawy [29]:
| (2) |
The third method used was that of minimum curvature surface fitting. This method fits a minimum curvature spline surface to the data using a basis function described by Franke [34] and a fitting method derived from the IDL function min_curve_surf (ITT Visual Information Solutions, Boulder, CO). For n data points (references in this case), n+3 equations are solved simultaneously using back substitution, solving for the following coefficients and equation
| (3) |
with
| (4) |
where d is the distance between (x0,y0) and (x1,y1).
Materials and Methods
Phantom Creation
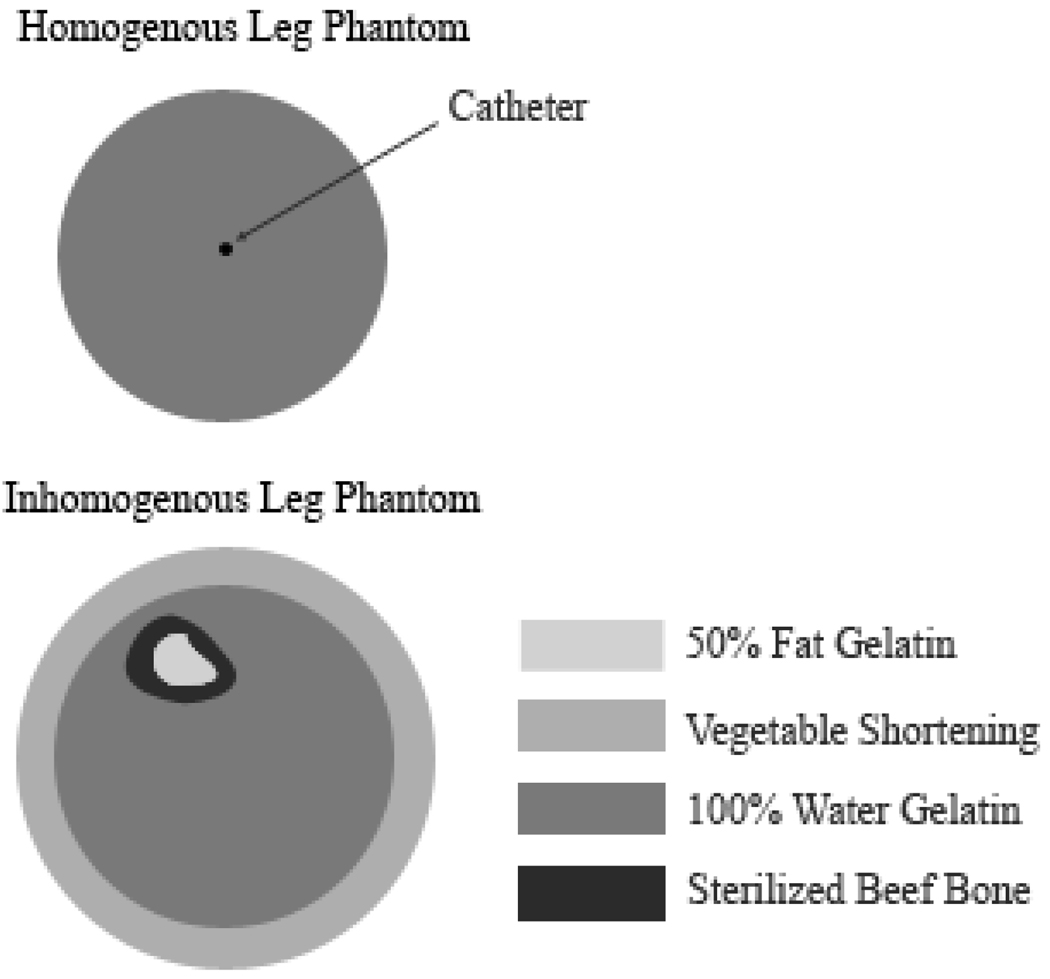
Two phantoms were made for this experiment, both based on the recipe by Madsen [35]. The homogenous phantom was composed of only water and gelatin, lacking the oil of the Madsen phantoms so that no error in the PRFS technique would occur. The phantom was contained in a 4.25” diameter and 14” long plastic cylinder with one #19 gauge catheter (to accommodate the fiberoptic temperature probe) through the center. An inhomogenous phantom was made to simulate a human leg more closely, to determine if there were any effects on drift correction due to the inhomogeneity of the leg. A 0.25” layer of vegetable shortening was evenly distributed around the edges of a 4.25” diameter and 11” long polycarbonate cylinder. A sterilized beef bone (Dentley’s Natural Item #03277 from Pacific Coast Distributing Inc., Phoenix, AZ, USA) was then filled with an oil-in-water gelatin material (Madsen recipe) that contained equal amounts of fat and water. The bone was placed inside of the cylinder near the top of the phantom (to mimic the leg), which was then filled with the same water gelatin material used for the homogenous phantom. A diagram showing the construction and materials of each phantom can be found in Figure 1. Lastly, both phantoms lacked the propylene glycol called for by Madsen, which is intended to increase the stability of the emulsion. However, the phantoms made for this paper were stable over a period of months, as long as the phantoms remained sealed.
Figure 1.
Construction and materials of the phantoms used in the experiments. The 50% fat gelatin and sterilized beef bone were placed in the inhomogenous leg phantom to mimic the bone marrow and bone of a human leg, respectively.
Frequency Drift Mapping
The field measurement method used for this paper is an extension of that used by El-Sharkawy and is designed to provide optimal field resolution without phase-wrap artifacts in water. For every experiment, a one centimeter thick slice was imaged on a 1.5T GE Signa HDX (General Electric, Milwaukee, WI, USA) with a 2D axial SPGR (spoiled-gradient echo) sequence with repetition time=38.5ms, Flip angle=30°, bandwidth=15.6 kHz, FOV = 30 cm, image matrix=128×128, and four signal averages. This slice was imaged at three different echo time (TE) values, 11, 12.5, and 20 ms (“triplet sequence”). The phase difference between the 11 and 20 ms images (divided by the echo time difference) produces a frequency offset image with a range of ±55.5 Hz. The 11ms to 20ms TE difference allows for adequate frequency resolution but also the range to accommodate for B0 field drift without phase wrap. The 12 ms image was not used for the data shown in this paper. The time for each scan was 20 sec, with the entire triplet sequence lasting approximately 1 minute.
Long Term Drift Experiment
To determine the general nature of the magnetic field drift over a long period of time, a 52 hour field drift experiment was performed. A large water-only gelatin phantom was allowed to equilibrate overnight in the magnet, at which point it was scanned with the frequency drift mapping sequence approximately every 2 minutes for 52 hours.
MAPA Phantom Experiment
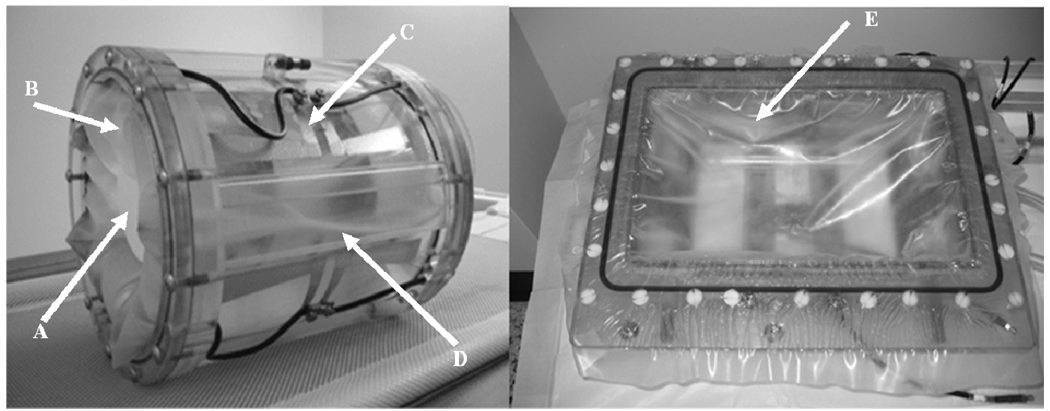
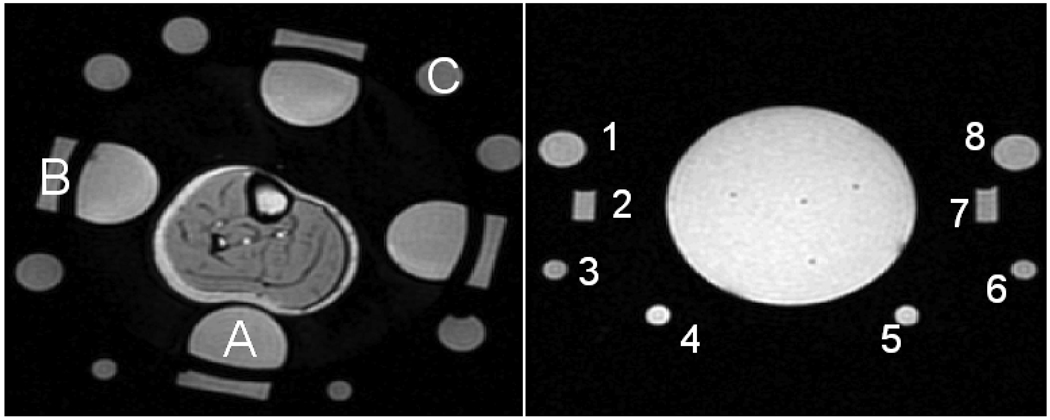
The phantoms were placed in the same applicator used for heating human extremity tumors: a mini-annular phased array (MAPA) that consisted of 4 twin dipole antennas [36, 37]. A photograph of the MAPA applicator can be seen in Figure 2. This applicator had a water bolus for dielectric match between the applicator antennae and the phantom (or leg). The MAPA had eight permanently attached references filled with silicone oil (Thomas Scientific #6428R25, Swedesboro, NJ, USA) with four located inside the bolus (2” diameter, 3.5” from center) and four directly outside the bolus (2”×0.5”, 5” from center). There were also eight temporary references (1.125” and 0.625” diameter, 5” from center) that were taped to the outside of the MAPA to assess the effectiveness of various reference configurations. The typical location of the oil references for each trial is shown in Figure 3.
Figure 2.
(Left) MAPA applicator (Right) Breast Applicator. A: cylindrical phantom in contact with bolus, B: membrane confining the bolus, C: heating antennae (one of 4) configuration and connections, D: one of 4 oil-filled “rect” reference sections, E: membrane in breast applicator separating breast from bolus (below membrane).
Figure 3.
(Left) Axial magnitude image of experimental setup and oil references for the MAPA experiments. (A) one of 4 “inner” references inside the D2O bolus, (B) One of 4 “rect” references outside water bolus, (C) one of 8 “outer” oil references outside water bolus. (Right) Axial magnitude image of experimental setup and 8 oil references for the breast applicator experiments.
Five trials were performed, but only four were used due to insignificant drift (<2 Hz) during the discarded one. At the beginning of each trial, the phantom that had equilibrated with the MR room overnight was placed into the MAPA. The bolus was then filled with 99.8% pure D2O (Sigma Aldrich #617385, St. Louis, MO, USA). While water is conventionally used for a bolus, it can create MR image artifacts due to convection and flow. Thus we used D2O, which does not create an MR image signal but otherwise functions as well as water in creating a dielectric match between the RF antennas and the object of interest. Care was taken to avoid contamination of the D2O with H2O by keeping the system sealed. The D2O was allowed to equilibrate with the control room temperature, which in general differed from the scanner room by approximately 1–2°C. By the time the water reached the bolus and the scanning begun, the difference in temperature between the bolus water and the phantom temperature was assumed to be less than 1°C. The phantoms were not heated for this test. Temperature was monitored in trial #4 using fiberoptic thermal probes (Lumasense Technologies, Santa Clara, CA, USA) inserted into a catheter running through the middle of the phantom.
An image of a central slice of the phantom was acquired using the frequency drift triplet scanning sequence approximately every 2 minutes for total trial times ranging from 70 to 127 minutes. Since the purpose of this work was to evaluate drift correction, the region was not heated so that observed and reference predicted drift could be compared. Scans were performed for this duration to span the length of a typical hyperthermia treatment, where temperature monitoring normally continues for 60–80 minutes [17]. The homogenous phantom was used in trials #1, 2, and 4, while the inhomogenous phantom was used in trial #3. For phantom trials #1–3, two of the eight outside references were unusable for the data analysis after the trials were performed, due to an error in filling that was noticed only after the trials were performed. Thus, only 6 usable outside references were present. Phantom trial #4 did not have any outside oil references.
MAPA Leg Experiment
The same MAPA applicator used for the phantoms was used for the human leg experiment. For 15–20 minutes before each trial, the D2O bolus was preheated to 31–34°C, depending on the temperature of the scanner room and the temperature of the subject. The purpose of preheating the D2O was to keep the surface temperature of the leg as constant as possible during a trial. All leg trials were performed with the same healthy human volunteer (Male, Age 24) using informed consent under an institutional review board (IRB) approved protocol.
Five trials were performed, but only four were used due to insignificant drift (<2 Hz) during the discarded one. For each trial, the right leg of the subject was placed into the center of the MAPA so that the knee was at the edge of the applicator. Once the leg was situated and restrained with foam, fiber optic temperature probes were taped to the surface of the leg near the center of the applicator. The bolus was then filled with the preheated D2O and the subject placed in the magnet. A 1cm thick slice was imaged near the center of the applicator with the frequency imaging triplet sequence. The slice was acquired approximately every 2 minutes for total trial times ranging from 42 to 80 minutes. For leg trial #1, again, two of the eight outside oil references were found to have an error in filling (as mentioned previously), so only 6 usable outside reference were present. Leg trial #4 did not have any outside oil references.
Breast Applicator Experiment
The other applicator used in this study was a rectangular applicator for breast hyperthermia, containing five twin dipole antennas [38]. A photograph of the applicator is shown in Figure 2. Eight mineral oil references were placed on the inside and outside of the applicator, with their locations shown in Figure 3. Two trials were performed similar to the MAPA experiment, where a spherical water-based gelatin phantom was placed in the applicator, which was then filled with D2O so that the bottom portion of the phantom was surrounded by the bolus. One center slice was imaged with the same SPGR triplet sequence as the MAPA experiment. The slice was acquired approximately every 2 minutes for approximately 90 minutes for both trials. Lumasense probe temperature data was acquired using three catheters placed near the center region of the phantom.
Data Processing
For all MAPA and breast applicator experiments, the field offset (ΔB0) at each pixel was calculated for each time point in the series using the phase difference between the 11 and 20 ms images and the equations described by El-Sharkawy. These field values were then averaged across the entire object of interest (avoiding the bone and major blood vessels in the leg data) to obtain an average field value in the object at that time point. For each trial, the average drift rate was then found by taking the final total drift value and dividing it by the total time of the trial.
To calculate and correct the phase changes throughout the image, the pixel by pixel phase differences between consecutive TE=20 ms images were calculated. The mean of 5×5 pixel regions of interest (ROIs) in the center of each oil reference were then calculated for each phase difference. Phase difference prediction images were then generated with these values using the three methods (linear and nonlinear least-squares as well as minimum curvature surface fits). All phase difference images and the phase difference prediction images were then converted to temperature units (in order to express the results in a scale that could be interpreted in terms of the expected temperature changes during hyperthermia of between 38°C and 43°C) using the standard PRFS formula (below) assuming that all phase changes are due to temperature change. The equation used to calculate temperature change from PRFS was as follows [39]:
| (5) |
where ΔT(°C) and Δφ(°) are the temperature and phase changes respectively, f is the imaging frequency (Hz), TE is the echo time (ms), and alpha is the temperature coefficient (approximately equal to −0.01 ppm/°C in muscle [40]). The absolute difference between the measured temperature difference image and the predicted temperature difference image was averaged across the entire phantom or leg for each time point. The absolute difference was used since both underestimation and overestimation of temperature are considered to be detrimental to proper thermal dosimetry of clinical hyperthermia. All calculations were done with Matlab (The Mathworks, Inc., Natick, MA, USA).
Three reference combinations were used to analyze the data. Referring to Figure 3, the four references closest to the leg (labeled as A) are called the “inner” references, the references behind (radially outside) the inner references (B in Figure 3) are the rectangular or “rect” references, and the eight circular references (C in Figure 3) as the “outer” references. The combination of the inner and rectangular references is referred to as “inner-rect” while the inner and outer reference combination is “inner-outer”.
To gauge the effect of oil reference distance from the center of the applicator on correction performance, four of the rectangular references and four of the outside references were each used for correction without the inner references for the MAPA phantom and leg experiments. Also, four 5×5 pixel ROIs (spaced evenly around the leg) in the fat layer of each leg trial were chosen and used for correction to compare the fat correction method to the oil reference method.
The temperature error at the end of each trial was averaged across the entire leg or phantom to provide the total temperature error for each trial. The total temperature error for each combination of oil references was then averaged over all valid trials. For the leg experiment, the same procedure was followed except with the exclusion of leg trial #1, which was found to have large temperature changes over the hour long trial that appeared to be due to the real changes in temp or patient movement.
Results
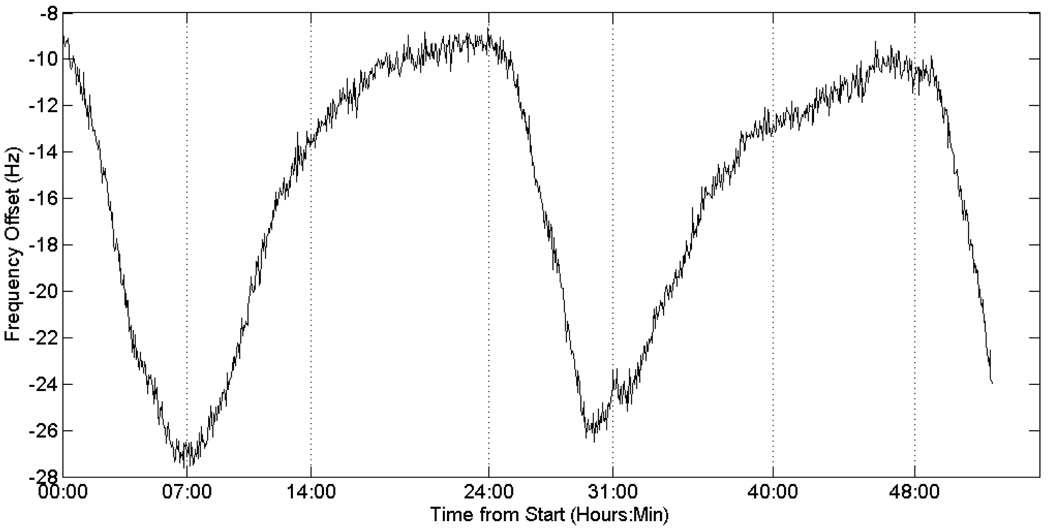
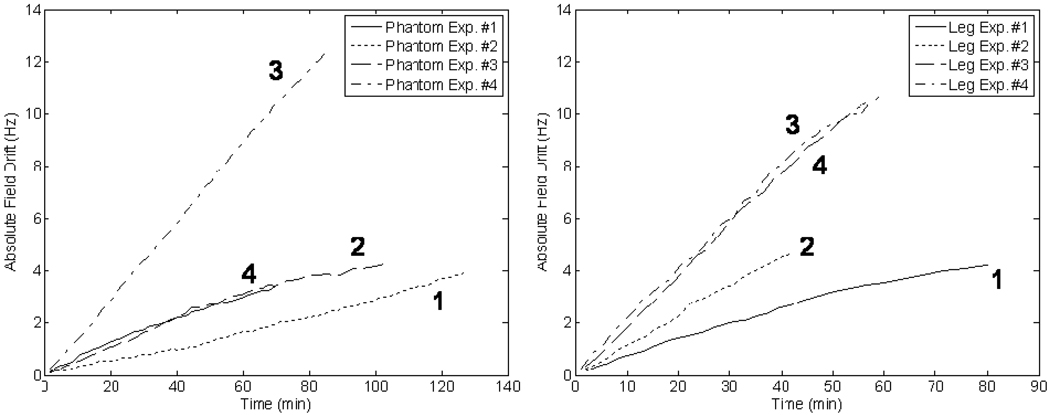
The results of the long term frequency drift can be seen in Figure 4, which shows the principally cyclical (diurnal) behavior of the magnet drift. The field drift plots for both the phantom and leg experiments (over the much shorter interval of 1 to 2 hours) can be found in Figure 5.
Figure 4.
Long-term frequency drift of the 1.5T magnet, demonstrating the principally diurnal change as well as variable components that lead to poor predictability of the behavior.
Figure 5.
(Left) Frequency drift over time for all trials of the MAPA phantom experiment. (Right) Frequency drift over time for all trials of the MAPA leg experiment. Illustrating the variability of the amount of drift that can be encountered in such measurements.
MAPA Phantom Experiment
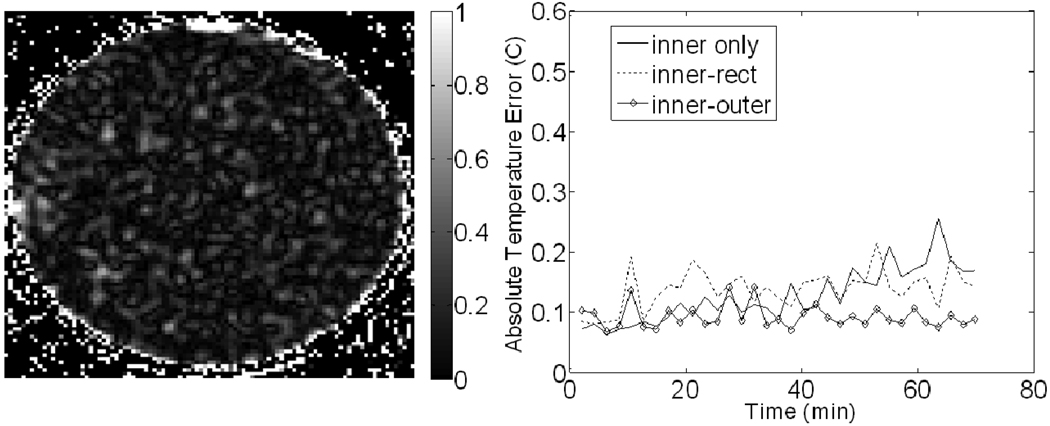
An image of the temperature error at the end of trial #1 of the phantom experiment is shown in Figure 6. Correction with the inner and outer reference combination was applied to produce the image. A plot of the absolute average temperature error as a function of time for trail #1 is also shown in Figure 6. The temperature error before correction, the error after correction using inner only, inner-rect, and inner-outer configurations, and the best percent correction seen among those configurations can be seen for all four trials in Table I. The outer references were not used in trial #4 due to the lack of valid outer references. All MAPA phantom results use the least-squares method of fitting since results using MCS were not significantly different. Lastly, the Lumasense probe observed approximately 0.3°C of temperature change in trial #4, which is approximately the same increase seen in the error of the correction.
Figure 6.
Results from the MAPA phantom experiment. (Left) Image of the final temperature error (in °C) after correction using the inner-outer reference combination. (Right) Plots of the absolute temperature error for each correction scheme over time. The definition of each reference combination can be found in the methods and Figure 3.
Table I.
Final uncorrected temperature error (°C), final temperature error after correction (°C), and the best percent correction for every trial of each experiment of this study. The final temperature error after correction is shown for several reference combinations.
| MAPA Phantom | Uncorrected Temperature Error (°C) |
Temperature Error After Correction () |
*Best % Correction |
||
|---|---|---|---|---|---|
| Inner only | Inner-Rect | Inner-Outer | |||
| Trial #1 | 5.37 | 0.17 | 0.14 | 0.09 | 98.3 |
| Trial #2 | 6.15 | 0.18 | 0.11 | 0.10 | 98.3 |
| Trial #3 | 6.68 | 0.11 | 0.16 | 0.18 | 98.3 |
| Trial #4 | 19.48 | 0.66 | 0.38 | N/A | 98.1 |
| MAPA Leg | |||||
| Trial #1 | 6.52 | 2.52 | 2.43 | 2.25 | 65.5 |
| Trial #2 | 7.26 | 0.43 | 0.64 | 0.45 | 94.0 |
| Trial #3 | 16.42 | 0.99 | 0.54 | 0.44 | 97.3 |
| Trial #4 | 17.11 | 1.39 | 0.39 | N/A | 97.7 |
| Breast Phantom | References 2,4,5,7 | References 2–7 | References 1–8 | ||
| Trial #1 | 9.46 | 0.53 | 0.57 | 0.46 | 95.1 |
| Trial #2 | 11.17 | 0.29 | 0.20 | 0.16 | 98.6 |
The best % correction results use the best correction of the reference combinations shown for each trial.
MAPA Leg Experiment
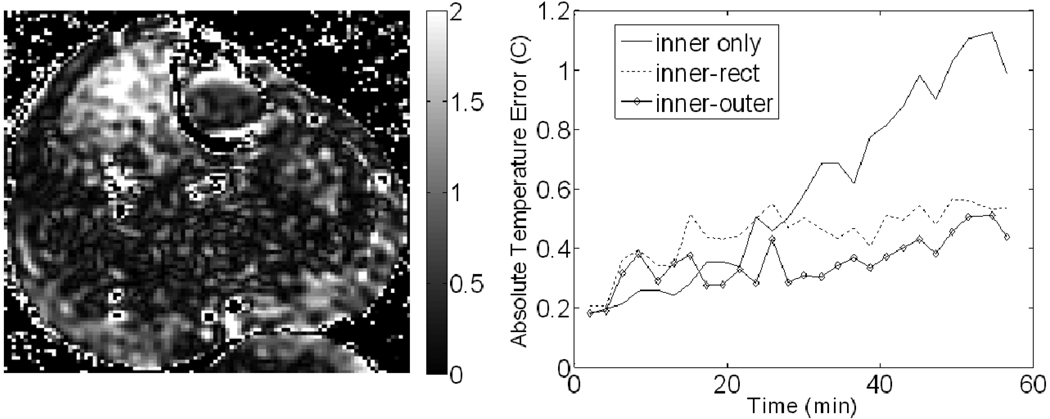
An image after applying correction with the inner and outer reference combination for trial #3 of the MAPA leg experiment is shown in Figure 7. A plot of the absolute average temperature error as a function of time for trail #3 is also shown in Figure 7. The temperature error before correction, the error after correction using inner only, inner-rect, and inner-outer configurations, and the best percent correction seen among those configurations can be seen for all four trials in Table I. All MAPA leg results use the least-squares method of fitting since results using MCS were not significantly different.
Figure 7.
Results from the leg experiment. (Left) Image of the final temperature error (in °C) after correction using the inner-outer reference combination. (Right) Plots of the absolute temperature error for each correction scheme over time. The definition of each reference combination can be found in the methods and Figure 3.
The averages of the final temperature error after correction for all trials of the phantom and leg MAPA experiments are shown in Table II for several reference configurations. Table II also includes an averaging of the MAPA leg trials that excludes trial #1, since it was deemed to have significant temperature change inside the leg that skewed results. This was determined by the Lumasense temperature probe on the leg surface, which reported constant decrease in temperature, resulting in an overall temperature change of 0.95 °C. The temperature for the other leg trials was much more constant over the course of each trial.
Table II.
Average temperature error across all trials of the MAPA leg and phantom experiments for several reference combinations.
| Average Temperature Error (°C) | |||
|---|---|---|---|
| Reference Configuration Used | All Leg Trials | *Leg Trials 2, 3, and 4 | All Phantom Trials |
| Inner only | 1.33 | 0.94 | 0.28 |
| Rect only | 1.75 | 1.53 | 0.51 |
| Outer only | 1.82 | 1.37 | 0.37 |
| Inner-Rect | 1.00 | 0.52 | 0.20 |
| Inner-Outer | 1.05 | 0.44 | 0.13 |
| Inner and 10 or more Outer | 1.09 | 0.51 | 0.19 |
| In-Vivo Fat Layer only | 1.41 | 1.10 | N/A |
Results excluding leg trial #1 are shown for comparison since large temperature errors were seen in that single trial that are most likely due to confounding temperature changes in the leg.
Breast Applicator Experiment
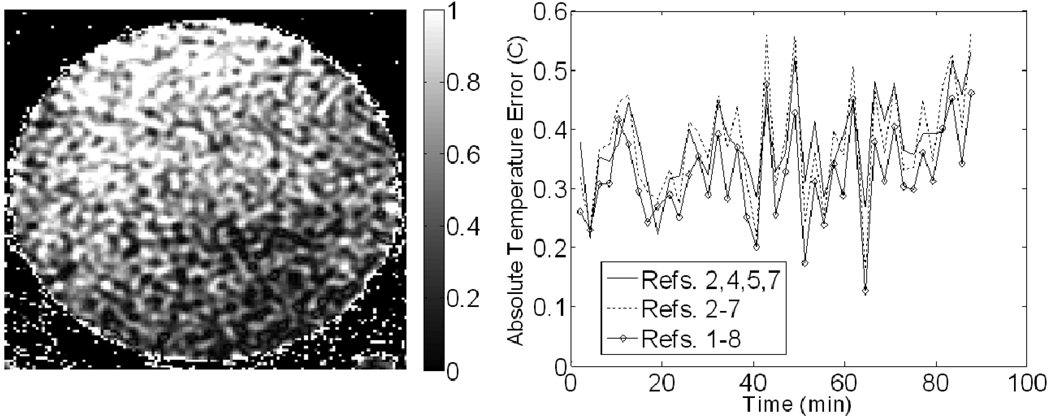
An image after applying correction with for trial #1 of the breast applicator phantom experiment is shown in Figure 8. A plot of the absolute average temperature error as a function of time for trail #1 is also shown in Figure 8. The temperature error before correction, the error after correction using different reference configurations and the best percent correction seen among those configurations can be seen for both trials in Table I. All breast applicator experiment results use the MCS method of fitting since the noise in the least-squares fitting results was much worse. Lumasense data showed no temperature change throughout both trials.
Figure 8.
Results from the breast applicator phantom experiment. (Left) Image of the final temperature error (in °C) after correction using the inner-outer reference combination. (Right) Plots of the average absolute temperature error for each correction scheme over time. The location corresponding to the number of each reference is shown in Figure 3.
Discussion
In this work we have examined the performance of oil references located inside and outside of a hyperthermia applicator to correct for field drift of MR magnets over 1–2 hour periods. The long term frequency drift shown in Figure 4 indicates that real time frequency drift correction is needed for accurate characterization of temperature change over these time periods (error less than 1°C). The nonlinearity of the drift suggests that pre-calibration and extrapolation of the drift during the treatment will not work for all drift conditions. The diurnal character of the drift suggests it is likely due to environmental temperature changes in the MR system room which may have additional non-periodic variations throughout the year. While the total uncorrected drift over time for all trials was mostly linear, there were trials performed where the drift would plateau at the beginning or end of a trial, resulting in insignificant drift. The sinusoidal nature of the plot in Figure 4 helps explain why these plateaus occurred.
The average temperature error due to uncorrected field drift in both phantoms and legs was determined along with the spatial distribution of the error. These results show that oil reference correction works very well with phantoms; with corrected images showing small average temperature error and good spatial correction. Our MAPA phantom experiment showed an average error in the range of 0.18–0.28°C and excellent spatial correction. Trial #4 had a large temperature error, but as a percentage of total drift the error was similar to others. For the first three phantom trials, the four inner references alone worked just as well as the eight-reference inner-rect or the inner-outer combinations. In trial #4, the inner-rect combination corrected noticeably better than the inner references alone, by almost a factor of two. Therefore, oil reference correction is very effective in phantoms, eliminating approximately 98% of the error due to drift, as seen in Table I.
Unlike De Poorter, we have shown useful correction in the leg, with an average error of 1.33 °C and good spatial correction. Trial #1, however, did show large correction errors that are similar in magnitude to the errors seen in the one leg experiment performed by De Poorter, on the order of 2.5° C. The large error could be due in part to several uncontrollable factors, such as physiologic changes (perfusion, etc.), external heating from the bolus, or phase changes from subject movement. Internal perfusion changes are most likely, considering the substantial difference in drift between the muscle and fat tissues, suggesting an actual temperature change inside the leg. This coupled with the fact that trial #1 was the only trial in which the surface temperature of the leg changed significantly (by approximately 1°C) suggests that real temperature changes were occurring inside the leg. Thus, if we exclude trial #1, the other three leg trials showed improved correction with four references, with an average error of 0.94°C. As seen from the best % correction results of Table I, approximately 95% of the error created by field drift was corrected in leg trials #2–4, which is very similar to the % correction seen in the MAPA phantom experiment.
While the results of the MAPA leg experiment using only four references were very encouraging, the correction errors of the eight reference inner-rect or inner-outer combinations showed further improvement to 0.52 °C and 0.44 °C, respectively. These values are almost half the error seen using four references. On the other hand, the effect was not seen in all trials, with leg trial #2 showing almost no difference between the four and eight reference combinations. It was also not seen in most of the phantom and breast applicator trials. However, even when the improved correction was not seen, the correction with eight references was no worse than the correction with four references. Much of this variance could be due to the fact that the drift was markedly different across all trials and that some drift situations favored the extended reference placement of one combination over others. Thus, it can be concluded that eight references will likely perform as well or better than four references, depending on the drift behavior.
While eight references can improve correction, it can be seen from Table II that there was little improvement to the correction when using 10 or 12 oil references instead of eight. However, this could be due to the spatial location of the references or there could be a greater difference when a much higher number is applied. Thus, an improved approach could be to have a very large number of spatially distributed ROIs by positioning an annulus of oil around the MAPA.
The effect of distance of the references from the object of interest was investigated by using only the outer or rect references. As seen in Table II, the results show that on, average, the outer and rectangular references perform worse than the inner references, suggesting that distance to the object of interest is important.
To compare between commonly used methods, four ROIs in the fat layer of each leg trial were used for correction to compare to the oil reference correction. From Table II, it can be seen that there was a slight increase in the error using the fat correction compared to using only the inner references (inner-only) for correction. However, this was most likely due to increased noise in the fat tissue and is not an important difference. Also, it should be noted that if the leg tissue were being heated, fat may not be a good reference since it often contains small percentages of water (<10%). The phase of the water component of the fat will change with temperature as the leg is heated, adding to the phase of the pure fat signal. While small, this extra phase will add error when measuring the phase change of the fat due to field change. However, Gellermann et al. have shown that the technique can help during heating in soft tissue sarcoma of the pelvis[32].
In the MAPA leg experiment, the use of heated water ranging from 31–34°C could have significantly varied the temperature of the “inner” oil references as well as possibly heating the “rect” and “outer” references. Since all the references started at room temperature, error could have resulted if water references were used, for reasons discussed in the introduction. However, since oil references were used, these errors could not occur since the oil is not temperature sensitive, which would explain the small temperature error measured in the experiment.
The MAPA phantom and leg experiments show results from using oil references that are symmetrically placed all around the object of interest. The breast applicator experiment had references that surrounded only about 60% of the phantom, with the top of the phantom having no references in the vicinity since that is where the subject’s torso would be. From the results seen in Figure 8, there was a noticeable effect of having less oil reference coverage. The top of the phantom in each trial had worse correction than the bottom, with the error in the bottom region similar to the correction seen in the MAPA phantom experiment. Thus, we can conclude that references should be placed (if possible) on all sides of the subject to provide good spatial correction.
One limitation of this work is that we have not examined the effect of internal leg perfusion or muscle movement on temperature correction. It can be seen from leg trials #1 and #3 that there are localized regions of increased error in the upper corners of the leg muscle. These regions seem to be very isolated phase changes, almost too isolated to be from perfusion. We speculate that these effects are from slight internal muscle movement to maintain tone, which would cause a phase change that would be misconstrued as temperature change. This could have impact on future hyperthermia treatments of the leg, where these regions could be misconstrued as applied heat.
Conclusion
We have shown that oil reference materials perform well to correct MR system “drifts” during PRFS-based temperature measurements. Further, in the presence of large MR system drifts there is, in most cases, an improvement in drift correction by using 8 symmetrically placed oil references in the inner-outer configuration as compared to inner-only or outer-only. There appear to be diminishing returns after this “best” configuration for the cylindrical (MAPA) applicator. Using this combination for a common choice of imaging parameters at 1.5T we are able to achieve a correction of better than 0.5°C in a leg during the MR system drift over a period of an hour or more, typical of a hyperthermia session. For a non-symmetric situation such as a breast applicator, we are still able to achieve similar results (for a phantom) although there is some spatial dependence to the corrected data. For all experiments, we achieved our best results using a higher order interpolating function containing linear and quadratic terms. Finally, while these experiments were performed in only two applicators, the results should help guide application of oil-based referencing to almost any area of the body in which standard PRFS temperature measurement techniques can be applied.
Acknowledgements
The authors wish to thank Kevin Kelley, Jerry Dahlke, Daniel Martins, Sneha Rangarao, and Kavitha Arunachalam for help with performing the experiments. We would also like to thank Omar Arabe and Vadim Stakhursky for helping build the applicators used in the experiments. Additionally, we acknowledge NCI grant #PO1-CA042745 and NIH grant #T32-EB001040 for supporting this research.
References
- 1.Dewhirst M, Jones E, Samulski RJ, et al. In: Hyperthermia, in Cancer Medicine 6. Kufe DW, et al., editors. BC Decker, Inc.: Hamilton; 2003. pp. 623–636. [Google Scholar]
- 2.Falk MH, Issels RD. Hyperthermia in oncology. Int J Hyperthermia. 2001;17(1):1–18. doi: 10.1080/02656730150201552. [DOI] [PubMed] [Google Scholar]
- 3.Wust P, Hildebrandt B, Sreenivasa G, et al. Hyperthermia in combined treatment of cancer. Lancet Oncol. 2002;3(8):487–497. doi: 10.1016/s1470-2045(02)00818-5. [DOI] [PubMed] [Google Scholar]
- 4.Vernon CC, Hand JW, Field SB, et al. Radiotherapy with or without hyperthermia in the treatment of superficial localized breast cancer: results from five randomized controlled trials. International Collaborative Hyperthermia Group [see comments] Int J Radiat Oncol Biol Phys. 1996;35(4):731–744. doi: 10.1016/0360-3016(96)00154-x. [DOI] [PubMed] [Google Scholar]
- 5.Overgaard J, Gonzalez Gonzalez D, Hulshof MC, et al. Hyperthermia as an adjuvant to radiation therapy of recurrent or metastatic malignant melanoma. A multicentre randomized trial by the European Society for Hyperthermic Oncology. Int J Hyperthermia. 1996;12(1):3–20. doi: 10.3109/02656739609023685. [DOI] [PubMed] [Google Scholar]
- 6.Valdagni R, Amichetti M. Report of long-term follow-up in a randomized trial comparing radiation therapy and radiation therapy plus hyperthermia to metastatic lymph nodes in stage IV head and neck patients. Int J Radiat Oncol Biol Phys. 1994;28(1):163–169. doi: 10.1016/0360-3016(94)90154-6. [DOI] [PubMed] [Google Scholar]
- 7.Kitamura K, Kuwano KH, Watanabe M, et al. Prospective randomized study of hyperthermia combined with chemoradiotherapy for esophageal carcinoma. J Clin Oncol. 1995;60:55–58. doi: 10.1002/jso.2930600111. [DOI] [PubMed] [Google Scholar]
- 8.van der Zee J, Gonzalez Gonzalez D, van Rhoon GC, et al. Comparison of radiotherapy alone with radiotherapy plus hyperthermia in locally advanced pelvic tumours: a prospective, randomised, multicentre trial. Dutch Deep Hyperthermia Group. Lancet. 2000;355(9210):1119–1125. doi: 10.1016/s0140-6736(00)02059-6. [DOI] [PubMed] [Google Scholar]
- 9.Franckena M, Stalpers LJA, Koper PCM, et al. Long-Term Improvement in Treatment Outcome After Radiotherapy and Hyperthermia in Locoregionally Advanced Cervix Cancer: An Update of the Dutch Deep Hyperthermia Trial. International Journal of Radiation Oncology*Biology*Physics. 2008;70(4):1176–1182. doi: 10.1016/j.ijrobp.2007.07.2348. [DOI] [PubMed] [Google Scholar]
- 10.Hand JW, Machin D, Vernon CC, Whaley JB. Analysis of thermal parameters obtained during phase III trials of hyperthermia as an adjunct to radiotherapy in the treatment of breast carcinoma. Int J Hyperthermia. 1997;13(4):343–364. doi: 10.3109/02656739709046538. [DOI] [PubMed] [Google Scholar]
- 11.Kapp DS, Cox RS. Thermal treatment parameters are most predictive of outcome in patients with single tumor nodules per treatment field in recurrent adenocarcinoma of the breast [see comments] Int J Radiat Oncol Biol Phys. 1995;33(4):887–899. doi: 10.1016/0360-3016(95)00212-4. [DOI] [PubMed] [Google Scholar]
- 12.Oleson JR, Samulski TV, Leopold KA, et al. Sensitivity of hyperthermia trial outcomes to temperature and time: implications for thermal goals of treatment. Int J Radiat Oncol Biol Phys. 1993;25(2):289–297. doi: 10.1016/0360-3016(93)90351-u. [DOI] [PubMed] [Google Scholar]
- 13.Seegenschmiedt MH, Martus P, Fietkau R, et al. Multivariate analysis of prognostic parameters using interstitial thermoradiotherapy (IHT-IRT): tumor and treatment variables predict outcome. Int J Radiat Oncol Biol Phys. 1994;29(5):1049–1063. doi: 10.1016/0360-3016(94)90401-4. [DOI] [PubMed] [Google Scholar]
- 14.Sherar M, Liu FF, Pintilie M, et al. Relationship between thermal dose and outcome in thermoradiotherapy treatments for superficial recurrences of breast cancer: data from a phase III trial. Int J Radiat Oncol Biol Phys. 1997;39(2):371–380. doi: 10.1016/s0360-3016(97)00333-7. [DOI] [PubMed] [Google Scholar]
- 15.Jones E, Thrall D, Dewhirst MW, Vujaskovic Z. Prospective thermal dosimetry: the key to hyperthermia's future. International Journal of Hyperthermia. 2006;22(3):247–253. doi: 10.1080/02656730600765072. [DOI] [PubMed] [Google Scholar]
- 16.Jones EL, Oleson JR, Prosnitz LR, et al. Randomized trial of hyperthermia and radiation for superficial tumors. Journal of Clinical Oncology. 2005;23(13):3079–3085. doi: 10.1200/JCO.2005.05.520. [DOI] [PubMed] [Google Scholar]
- 17.Thrall DE, LaRue SM, Yu D, et al. Thermal dose is related to duration of local control in canine sarcomas treated with thermoradiotherapy.[see comment] Clinical Cancer Research. 2005;11(14):5206–5214. doi: 10.1158/1078-0432.CCR-05-0091. [DOI] [PMC free article] [PubMed] [Google Scholar]
- 18.Carter DL, MacFall JR, Clegg ST, et al. Magnetic resonance thermometry during hyperthermia for human high-grade sarcoma. Int J Radiat Oncol Biol Phys. 1998;40(4):815–822. doi: 10.1016/s0360-3016(97)00855-9. [DOI] [PubMed] [Google Scholar]
- 19.Clegg ST, Das SK, Zhang Y, et al. Verification of a hyperthermia model method using MR thermometry. Int J Hyperthermia. 1995;11(3):409–424. doi: 10.3109/02656739509022476. [DOI] [PubMed] [Google Scholar]
- 20.Craciunescu OI, Das SK, McCauley RL, Macfall JR, Samulski TV. 3D numerical reconstruction of the hyperthermia induced temperature distribution in human sarcomas using DE-MRI measured tissue perfusion: validation against non-invasive MR temperature measurements. Int J Hyperthermia. 2001;17(3):221–239. doi: 10.1080/02656730110041149. [DOI] [PubMed] [Google Scholar]
- 21.Craciunescu OI, Raaymakers BW, Kotte AN, et al. Discretizing large traceable vessels and using DE-MRI perfusion maps yields numerical temperature contours that match the MR noninvasive measurements. Medical Physics. 2001;28(11):2289–2296. doi: 10.1118/1.1408619. [DOI] [PubMed] [Google Scholar]
- 22.Craciunescu OI, Samulski TV, MacFall JR, Clegg ST. Perturbations in hyperthermia temperature distributions associated with counter-current flow: numerical simulations and empirical verification. IEEE Trans Biomed Eng. 2000;47(4):435–443. doi: 10.1109/10.828143. [DOI] [PubMed] [Google Scholar]
- 23.MacFall JR, Prescott DM, Charles HC, Samulski TV. 1H MRI phase thermometry in vivo in canine brain, muscle, and tumor tissue. Med Phys. 1996;23(10):1775–1782. doi: 10.1118/1.597760. [DOI] [PubMed] [Google Scholar]
- 24.Samulski TV, Clegg ST, Das S, MacFall J, Prescott DM. Application of new technology in clinical hyperthermia. Int J Hyperthermia. 1994;10(3):389–394. doi: 10.3109/02656739409010283. [DOI] [PubMed] [Google Scholar]
- 25.Kuroda K. Non-invasive MR thermography using the water proton chemical shift. International Journal of Hyperthermia. 2005;21(6):547–560. doi: 10.1080/02656730500204495. [DOI] [PubMed] [Google Scholar]
- 26.Hutchinson E, Dahleh M, Hynynen K. The feasibility of MRI feedback control for intracavitary phased array hyperthermia treatments. Int J Hyperthermia. 1998;14(1):39–56. doi: 10.3109/02656739809018213. [DOI] [PubMed] [Google Scholar]
- 27.Cline HE, Hynynen K, Schneider E, et al. Simultaneous magnetic resonance phase and magnitude temperature maps in muscle. Magn Reson Med. 1996;35(3):309–315. doi: 10.1002/mrm.1910350307. [DOI] [PubMed] [Google Scholar]
- 28.De Poorter J, De Wagter C, De Deene Y, et al. Noninvasive MRI thermometry with the proton resonance frequency (PRF) method: in vivo results in human muscle. Magn Reson Med. 1995;33(1):74–81. doi: 10.1002/mrm.1910330111. [DOI] [PubMed] [Google Scholar]
- 29.El-Sharkawy AM, Schar M, Bottomley PA, Atalar E. Monitoring and correcting spatio-temporal variations of the MR scanner's static magnetic field. MAGMA. 2006;19(5):223–236. doi: 10.1007/s10334-006-0050-2. [DOI] [PMC free article] [PubMed] [Google Scholar]
- 30.Gellermann J, Wlodarczyk W, Ganter H, et al. A practical approach to thermography in a hyperthermia/magnetic resonance hybrid system: validation in a heterogeneous phantom. Int J Radiat Oncol Biol Phys. 2005;61(1):267–277. doi: 10.1016/j.ijrobp.2004.05.009. [DOI] [PubMed] [Google Scholar]
- 31.Wust P, Cho CH, Hildebrandt B, Gellermann J. Thermal monitoring: invasive, minimal-invasive and non-invasive approaches. Int J Hyperthermia. 2006;22(3):255–262. doi: 10.1080/02656730600661149. [DOI] [PubMed] [Google Scholar]
- 32.Gellermann J, Hildebrandt B, Issels R. Noninvasive magnetic resonance thermography of soft tissue sarcomas during regional hyperthermia. Cancer. 2006;107(6):1373–1382. doi: 10.1002/cncr.22114. [DOI] [PubMed] [Google Scholar]
- 33.Kagayali Kuroda K, Oshio K, Chung AH, Hynynen K, Jolesz FA. Temperature Mapping using the water proton chemical shift: A chemical shift selective phase mapping method. Magnetic Resonance in Medicine. 1997;38(5):845–851. doi: 10.1002/mrm.1910380523. [DOI] [PubMed] [Google Scholar]
- 34.Franke R. Smooth Interpolation of scattered data by local thin plate splines. Computers Math with Applic. 1982;8(4):273–281. [Google Scholar]
- 35.Madsen EL, Hobson MA, Frank GR, et al. Anthropomorphic breast phantoms for testing elastography systems. Ultrasound Med Biol. 2006;32(6):857–874. doi: 10.1016/j.ultrasmedbio.2006.02.1428. [DOI] [PMC free article] [PubMed] [Google Scholar]
- 36.Zhang Y, Joines WT, Jirtle RL, Samulski TV. Theoretical and measured electric field distributions within an annular phased array: consideration of source antennas. IEEE Trans Biomed Eng. 1993;40(8):780–787. doi: 10.1109/10.238462. [DOI] [PubMed] [Google Scholar]
- 37.Li Z, et al. Towards the Validation of a Commercial Hyperthermia Planning System. Microwave Journal. 2008;51(12):28. [PMC free article] [PubMed] [Google Scholar]
- 38.Wu L, McGough RJ, Arabe OA, Samulski TV. An RF phased array applicator designed for hyperthermia breast cancer treatments. Phys Med Biol. 2006;51(1):1–20. doi: 10.1088/0031-9155/51/1/001. [DOI] [PMC free article] [PubMed] [Google Scholar]
- 39.Viola Rieke KBP. MR thermometry. Journal of Magnetic Resonance Imaging. 2008;27(2):376–390. doi: 10.1002/jmri.21265. [DOI] [PMC free article] [PubMed] [Google Scholar]
- 40.Peters RD, Hinks RS, Henkelman RM. Ex vivo tissue-type independence in proton-resonance frequency shift MR thermometry. Magnetic Resonance in Medicine. 1998;40(3):454–459. doi: 10.1002/mrm.1910400316. [DOI] [PubMed] [Google Scholar]


