

Abstract
Background
rs10993994, a single nucleotide polymorphism (SNP) at the genetic locus encoding ß-microseminoprotein (β-MSP), is associated with both prostate cancer risk and levels of blood prostate-specific antigen (PSA), a biomarker used in prostate cancer screening. Therefore, we wished to determine the association between SNPs at MSMB, the gene encoding β-MSP, and levels of the prostate-produced biomarkers β-MSP, PSA, and human kallikrein 2 (hK2) in blood and semen.
Methods
Blood and semen from 304 healthy young Swedish men (aged 18-21) were assayed for β-MSP, PSA and hK2. SNPs around MSMB were genotyped from matched DNA and analyzed for quantitative association with biomarker levels. Empirical p-values were multiple test corrected and independence of each SNP’s effect was determined.
Results
rs10993994 is significantly associated with blood and semen levels of β-MSP (both p<1.0×10⁻⁷) and PSA (p=0.00014 and p=0.0019), and semen levels of hK2 (p=0.00027). Additional copies of the prostate cancer risk allele resulted in lower β-MSP but higher PSA levels, and singly explained 23% and 5% of the variation seen in semen β-MSP and PSA. Additional SNPs at MSMB are associated with β-MSP and PSA independently of rs10993994.
Conclusions
SNPs at MSMB correlate with physiological variation in β-MSP and PSA levels in the blood and semen of healthy young Swedish men. In particular, rs10993994 has a strong effect on β-MSP levels.
Impact
Our results suggest a mechanism by which rs10993994 may predispose to prostate cancer and raise the possibility that genetic variation may need to be considered in interpreting levels of these biomarkers.
Keywords: PSA, beta-MSP, prostate biomarker, rs10993994, microseminoprotein beta, PSP94, hK2
Introduction
While the etiology of prostate cancer remains largely unknown, recent genome-wide association studies (GWAS) have identified numerous single nucleotide polymorphisms (SNPs) associated with prostate cancer risk, including one, rs10993994, located near the gene MSMB (1, 2). MSMB codes for β-microseminoprotein (ß-MSP), also known as PSP94, a 94-amino acid protein that is one of the three major proteins secreted by the prostate gland (3). Though the physiological functions of ß-MSP are unknown, it has been detected in other mucosal secretions and in the sera of both men and women (4-6). Blood serum levels of ß-MSP are significantly correlated with seminal plasma levels of ß-MSP, with r2=0.50 (7). ß-MSP displays characteristics of a tumor suppressor, as decreased expression is observed as prostatic tissue progresses from benign epithelium to metastatic cancer (8-10) and ß-MSP has been observed to inhibit growth of prostate cancer cell lines in vitro and in a xenograft model (11, 12). ß-MSP may also be useful as a prostate cancer biomarker, as lower levels of blood ß-MSP are correlated with higher tumor grade (13).
Several lines of evidence support the hypothesis that the prostate cancer risk SNP rs10993994 is associated with levels of various prostate secretory products. rs10993994 is located 57 nucleotides upstream of the transcription start site for MSMB. In in vitro reporter assays the risk allele for prostate cancer, T, results in lower gene expression as opposed to the protective allele, C (14, 15). A recent study of 60 Chinese men with prostate cancer found that patients with the CC genotype at rs10993994 have higher levels of serum β-MSP than patients with the CT/TT genotypes (16). rs10993994 is associated with prostate specific antigen (PSA) levels in healthy older men (17). PSA is another of the three major secretory products of the prostate (3) and is heavily utilized as a biomarker in prostate cancer screening and diagnosis (18). PSA is a member of the kallikrein family of peptidases and is related to human kallikrein 2 (hK2), which is secreted by the prostate as well. rs10993994 is also associated with blood levels of hK2 (19).
The role of genetic variation at MSMB in determining natural levels of prostate secretions in healthy young men not at risk for developing prostate cancer, even undiagnosed subclinical prostate cancer, has not been thoroughly explored. Therefore, we undertook a detailed and systematic study of SNPs around the MSMB locus, including rs10993994, and their association with prostate biomarker levels. Here, we report that rs10993994 is significantly correlated with levels of blood and semen ß-MSP, free and total PSA, and semen levels of hK2 in young Swedish men. We have also discovered novel associations between additional SNPs at MSMB with blood and semen ß-MSP and semen PSA levels. Our efforts demonstrate that common genetic variation at the MSMB locus controls physiological levels of prostate secreted proteins and provide evidence that this susceptibility locus warrants further functional exploration.
Materials and Methods
Study Subjects
304 healthy Swedish males, aged 18-21 years (mean age of 18.1), were enrolled originally in a study of reproductive function (20), as approved by the Ethical Review Board at Lund University. Blood and ejaculate samples were collected from the study subjects and analyzed for levels of biomarkers, as described previously (7).
Blood and Semen Measurements
Collected blood samples were analyzed for blood serum levels of biomarkers (labeled “blood”), while collected semen samples were centrifuged and seminal plasma analyzed for semen levels of biomarkers (labeled “semen”).
Blood and semen levels of β-MSP were assayed using rabbit anti-human MSP serum and goat anti-rabbit antibodies as described previously (7). Blood and semen hK2 were measured as previously described in (21). Blood and semen levels of free and total PSA were obtained as previously described in (21, 22), with the commercially available Prostatus™ PSA Free/Total kit, Delfia™ Reagents (Wallac Oy, Turku, Finland) assay.
SNP Selection and Genotyping
The coding and promoter regions of the MSMB gene were resequenced in DNA derived from 12 men with prostate cancer. No exonic variants were observed; three variants sites in the promoter were found (rs12770171, rs10993994, and rs41274660). Therefore, in addition to these three SNPs an additional 22 SNPs were manually selected from dbSNP and the International HapMap project to cover the MSMB gene and upstream regulatory region. In total 25 SNPs, spanning from 34kb upstream of MSMB’s transcription start site to immediately proximal to the final exon (chr10: 51185540-51231805), were selected for genotyping. Genomic DNA was isolated from peripheral leukocytes and genotyped with Sequenom’s MassARRAY MALDI-TOF as previously described (19). Of these 25 SNPs, 3 failed the successful genotyping cutoff of 95%, 4 were monomorphic in the study population, and 2 had minor allele frequencies under 0.01. The total genotyping rate after removal of low quality SNPs was 96%. The remaining 16 SNPs were used in subsequent association analyses (Figure 1).
Figure 1. The MSMB locus, as visualized with the UCSC Genome Browser and HaploView.
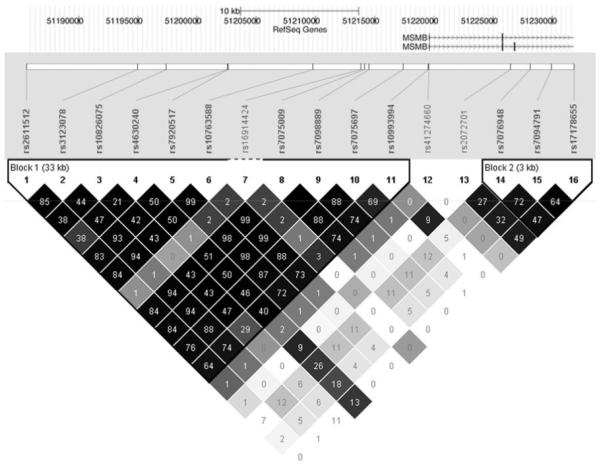
The genotyped SNPs are illustrated in their chromosomal position. The triangle plot shows pairwise linkage disequilibrium, with the numerals in each square indicating 100* r2. Darker shading indicates higher D’.
Statistical and Association Analyses
Statistical analyses were performed in PLINK v1.0.5 (23), STATA v10 (StataCorp, College Station, TX), and Prism v5.00 (GraphdPad Software, San Diego California USA). Exact commands used in PLINK and STATA are noted in italics.
Quantitative association analyses of blood and semen measurements with 16 SNPs at the MSMB locus were performed in PLINK. All SNPs passed Hardy-Weinberg equilibrium testing with p>= 0.01 (--hwe 0.01).
Univariate tests of association between a SNP and biomarker level was performed using linear regression. Empirical p-values were determined through label-swapping permutation testing with 10 million iterations, which corrects for the testing of multiple SNPs but not multiple phenotypes (--mperm 10000000 --assoc).
While the empirical estimation of p-values for the univariate tests does not assume normality, we wished to use tests that assume normality for further analyses. Normality of each phenotype was determined through both visually analyzing quantile-quantile plots against a normal distribution and the Shapiro-Wilk’s test for normality (qnorm and swilk in STATA). Where possible, nonparametric tests were performed on untransformed data, but where analysis required assumptions of normality, the following transformations were applied in order until the transformed data passed the aforementioned normality tests; log transformation (to blood and semen β-MSP), box-cox transformation (bcskew0 in STATA, to blood hK2, semen total PSA, free PSA and hK2 with λ=0.51, 0.15, 0.16, and 0.34 respectively), or a rank order transformation in which all individuals are ranked for the individual phenotype with ties split evenly and assigned a Z-score corresponding to the matching percentile of an ideal normal distribution (to blood free PSA and total PSA).
The independence of each SNP’s effect from another was ascertained through conditional haplotyping analysis (--chap in PLINK) on normalized data; all significant SNPs were individually paired with the most significant SNP and tested for independent effects. If more than one test was performed, multiple test correction was accomplished with Sidak’s correction. Haplotype blocks were identified and visualized through Haploview 4.1 (24)
Correlations were calculated via Spearman’s rho nonparametric method on the original, non-transformed data (spearman in STATA).
To determine fraction of variance explained by SNP genotypes, linear regression was performed between normalized values of each phenotype with each SNP genotype rewritten as 0, 1, or 2, depending on the number of copies of the minor allele in our population (regress in STATA).
To account for correlation between individual quantitative phenotypes in resulting in an association signal, linear regression with normalized values of the presumed dependent phenotype (e.g. blood or semen PSA and hK2) was performed with the non-transformed value of the presumed independent phenotype (e.g. blood or semen β-MSP).
Results
A cohort of 304 healthy young men was genotyped for 25 SNPs around the MSMB locus and assayed for β-MSP, free and total PSA and hK2 levels in subject matched samples of blood serum and seminal plasma. Genotyping results and SNP characteristics are described in [Supplementary Table 1], while biomarker characteristics are described in Table 1.
Table 1.
Biomarkers Analyzed in Study. Biomarker listed with origin, units of measurement, number of subjects examined for this specific measurement, mean and standard deviation, and median and interquartile range
| Biomarker | n | Mean (SD) | Median (IQR) |
|---|---|---|---|
| Blood | |||
| β-MSP (μg/L) | 204 | 13 (6) | 12.2 (8.86-15.7) |
| Total PSA (μg/L) | 302 | 0.64 (0.84) | 0.5 (0.35-0.67) |
| Free PSA (μg/L) | 302 | 0.29 (0.73) | 0.19 (0.135-0.27) |
| hK2 (μg/L) | 302 | 0.039 (0.02) | 0.036 (0.0255-0.05) |
| Semen | |||
| β-MSP (mg/L) | 204 | 690 (520) | 526 (322-938) |
| Total PSA (mg/L) | 201 | 690 (420) | 629 (393-911) |
| Free PSA (mg/L) | 201 | 680 (410) | 618 (388-895) |
| hK2 (mg/L) | 201 | 7.2 (4.6) | 6.09 (4-9.20) |
rs10993994 is strongly associated with blood and semen β-MSP levels
We first asked if rs10993994 is associated with β-MSP levels. We found strong evidence that this SNP is associated with both blood and semen β-MSP levels (p<1.0×10⁻⁷ for each). Additional copies of the risk allele for prostate cancer, T, correlated with lower levels of β-MSP in both blood and semen (Table 2), with average semen β-MSP levels in the cohort dropping from 955 mg/L to 602 mg/L to 298 mg/L in men with CC, CT, and TT genotypes at rs10993994, respectively (Figure 2). Blood β-MSP levels showed a significant trend in the same direction, with averages dropping from 16.1μg/L to 12.7μg/L to 6.7μg/L (Figure 2), for men with CC, CT, and TT genotypes respectively. This SNP singly explains 38% and 23% of the variance in blood and semen β-MSP levels respectively among our cohort.
Table 2.
Association of rs10993994 genotypes with Blood and Semen Biomarkers
| Origin | Biomarker (units) | Genotype | n | Mean (SD) | Median (IQR) | Empirical p-value |
Kruskal- Wallis p-value |
|---|---|---|---|---|---|---|---|
| Blood | β-MSP (μg/L) | CC | 77 | 16.1 (5.29) | 14.9 (13-19.0) | <1.0E-07 | <0.0001 |
| CT | 98 | 12.7 (5.59) | 11.7 (8.95-14.2) | ||||
| TT | 28 | 6.7 (3.06) | 5.82 (5.09-6.86) | ||||
| Total PSA (μg/L) | CC | 115 | 0.55 (0.3) | 0.5 (0.35-0.623) | 0.00014 | 0.039 | |
| CT | 139 | 0.54 (0.3) | 0.48 (0.32-0.655) | ||||
| TT | 46 | 1.2 (2) | 0.595 (0.403-0.803) | ||||
| Free PSA (μg/L) | CC | 115 | 0.21 (0.093) | 0.19 (0.14-0.27) | 4.9E-05 | 0.049 | |
| CT | 139 | 0.21 (0.15) | 0.18 (0.13-0.24) | ||||
| TT | 46 | 0.77 (1.8) | 0.215 (0.17-0.308) | ||||
| hK2 (μg/L) | CC | 115 | 0.037 (0.017) | 0.036 (0.025-0.05) | 0.36 | 0.84 | |
| CT | 139 | 0.039 (0.022) | 0.034 (0.025-0.0505) | ||||
| TT | 46 | 0.04 (0.021) | 0.0365 (0.0283-0.0498) | ||||
| Semen | β-MSP (mg/L) | CC | 77 | 955 (651) | 871 (452-1171) | <1.0E-07 | <0.0001 |
| CT | 98 | 602 (338) | 522 (353-746) | ||||
| TT | 28 | 298 (207) | 248 (185-322) | ||||
| Total PSA (mg/L) | CC | 78 | 653 (430) | 565 (347-853) | 0.0019 | 0.0003 | |
| CT | 93 | 624 (306) | 574 (392-838) | ||||
| TT | 30 | 1010 (556) | 886 (661-1230) | ||||
| Free PSA (mg/L) | CC | 78 | 641 (417) | 548 (341-853) | 0.0024 | 0.0004 | |
| CT | 93 | 611 (298) | 537 (386-822) | ||||
| TT | 30 | 982 (535) | 864 (659-1180) | ||||
| hK2 (mg/L) | CC | 78 | 6.38 (4.02) | 5.35 (3.42-8.19) | 0.00027 | 0.0004 | |
| CT | 93 | 6.87 (4.22) | 5.84 (3.98-9.06) | ||||
| TT | 30 | 10.4 (5.64) | 8.96 (7.04-13.6) |
For each biomarker origin and measurement and genotype at rs10993994, number of individuals counted, mean and standard deviation, median and interquartile range of the measurement are listed. p-values are reported from the results of empirical permutation testing and the Kruskal-Wallis nonparametric test for differences between genotype groups.
Figure 2. Blood and Semen Biomarker Levels Grouped by rs10993994 Genotype.

Scatter plots of individual subjects’ biomarker levels as grey dots, with mean and 95% confidence interval marked in black lines.
Additional SNPs at MSMB are independently associated with β-MSP levels
To determine whether other genetic variants at MSMB influence levels of β-MSP, we tested 15 nearby SNPs besides rs10993994 for association with β-MSP levels in blood and semen (Figure 1). Due to linkage disequilibrium in the genomic region, additional SNPs may appear to be associated with β-MSP levels simply because they are strongly correlated with rs10993994. To identify SNPs that are independently associated with β-MSP levels, we tested each SNP for association with each phenotype independent of its linkage disequilibrium with rs10993994 (25) and then applied Sidak’s correction to correct for multiple testing. We found rs7098889 to be significantly associated with semen levels of β-MSP (p=0.029, corrected). A related SNP, rs10763588, was nominally associated with blood levels of β-MSP (p=0.013, uncorrected), but this association was not significant after considering all 16 SNPs analyzed in the study (p=0.19, corrected). Both of these associations are independent of rs10993994 (Table 3). These two SNPs are essentially concordant at r2=0.99 and exist as part of a larger block of linkage disequilibrium in our study population (Figure 1). In our data, this block spans 33 kb upstream of the MSMB transcription start site. The addition of either rs10763588 or rs7098889 explained 2.8% of the variance in semen β-MSP levels.
Table 3.
Novel SNPs at the MSMB locus are Associated with MSP and PSA levels
| Biomarker | SNP ID |
p (unadjusted) |
p (conditioned on rs10993994) |
p (conditioned and Sidak multiple test corrected) |
|---|---|---|---|---|
| Blood β-MSP | rs10763588* | 3.7E-05 | 0.013 | 0.19 |
| Semen β-MSP | rs7098889* | 0.0034 | 0.0018 | 0.029 |
| Semen Total PSA | rs17178655 | 0.018 | 0.00017 | 0.0027 |
| Semen Free PSA | rs17178655 | 0.019 | 0.00017 | 0.0027 |
Significant associations between SNPs and specific phenotypes, after adjusting for rs10993994 using conditional haplotype tests, are listed. Unadjusted p-values are taken from the empirical univariate test and do not consider rs10993994. The p conditioned on rs10993994 was computed using paired locus conditional haplotype testing; the raw result for the test of independence is reported, as well the multiple test-corrected version.
rs10763588 and rs7098889 are highly correlated with each other (r2=0.99) and are essentially the same locus.
rs10993994 is associated with PSA and hK2 levels
It has been observed that rs10993994 is associated with blood PSA levels in healthy older men (17, 19). Thus we asked if SNPs near MSMB are associated with kallikrein levels in the blood and semen in young men (Table 2; Supplementary Table 2). Significant associations were found between rs10993994 and blood levels of free and total PSA (p=4.9×10⁻⁵and p=0.00014) as well as semen levels of free and total PSA (p=0.0024and p=0.0019). The prostate cancer risk allele is consistently correlated with increased free and total PSA levels (Figure 2). rs10993994 genotype is estimated to account for 1% of the variation in blood levels of free and total PSA and 5% for semen levels of free and total PSA.
rs10993994 is also associated with semen, but not blood levels of hK2 (p=0.0045 for semen, p=0.36 for blood) (Table 2). rs10993994 explained an estimated 5% of the physiologically normal variation within semen hK2 levels, and additional copies of the risk allele correlate with higher semen hK2 levels (Figure 2).
A previous report using the same cohort reported here found that semen levels of β-MSP are positively correlated with semen PSA (r2=0.65) and blood levels of free PSA (r2=0.29) (7). We found that semen levels of β-MSP correlate positively with seminal levels of hK2 (rho=0.37). Blood and semen β-MSP are both correlated with blood hK2 levels (rho=0.21 and rho=0.20, respectively), but blood β-MSP is not correlated with semen hK2 levels.
We then asked if the effects of MSMB SNPs on PSA and hK2 levels could be explained by correlation between the biomarkers. We tested for association between SNP genotype and PSA or hK2 levels using matched β-MSP levels as a covariate. Correlation with blood β-MSP levels may explain the association between blood PSA measurements and rs10993994 genotype (p=0.10 and p=0.065 for free and total, respectively). However, correlation between semen levels of free PSA, total PSA, and hK2 with rs10993994 appears to exist independently of semen β-MSP levels (p<0.001).
rs17178655 is correlated with PSA levels after adjusting for rs10993994
The SNP rs17178655 was found to be associated with semen levels of both free and total PSA independent of rs10993994 (p=0.0027 for both, adjusting for rs10993994 and correcting for 16 SNPs tested). rs17178655 explains an additional 4% of variation in semen free and total PSA levels. rs17178655 resides within an intronic region of MSMB between exon 3 and 4, and is not in linkage disequilibrium with rs10993994 or other SNPs further upstream of rs10993994 (Figure 1). Interestingly, rs17178655 is not associated with β-MSP levels (empirical p-value=1).
Discussion
The recent discovery of rs10993994 as a consistently replicated prostate cancer susceptibility SNP has raised questions regarding the role of MSMB in the etiology of prostate cancer. The SNP’s location in the proximal promoter of a gene whose protein product is secreted in large quantities by the prostate and may have tumor suppressive properties suggests that the SNP may contribute to prostate cancer by down-regulating MSMB expression. Here, we have shown that genetic variation at the MSMB locus, in particular, rs10993994, is significantly associated with levels of the prostate-secreted proteins β-MSP, PSA and hK2. Since the study cohort consisted of young and healthy men, who should not have subclinical undiagnosed prostate cancer or other prostate abnormalities associated with age, the effect size seen is likely reflective of normal physiological variation in this Swedish population.
rs10993994, by itself, explains a large fraction of the variance in both blood and semen β-MSP levels – 38% and 23% respectively. These findings support those of Waters et al. in a multiethnic population (paper co-submitted); rs10993994 also explained 38% of the variance in blood β-MSP levels in an ethnic-pooled analysis, with the same direction and magnitude of effect although this study made use of a different design of the immunoassay for β-MSP. Together, our complementary findings attest to the robustness of this association.
That rs10993994 showed the strongest evidence for association with β-MSP out of all the SNPs tested in our study, and that the magnitude of the per-allele effect is so large, gives credence to the hypothesis that rs10993994 is the functional genetic variant responsible for the difference in β-MSP levels and not merely a tag SNP in linkage disequilibrium with the true functional variant. This is supported by in vitro differential reporter gene expression experiments showing that the risk allele for prostate cancer, T, causes lower reporter gene expression as compared to the protective allele, C, in numerous cell lines (14, 15, 26) (Xu and Klein, unpublished). We hypothesize that the T allele leads to lower promoter activity by abrogating a functional CREB binding site (26) (Xu and Klein, unpublished). Interestingly, the correlation between rs10993994 genotype and β-MSP levels in blood is slightly stronger than that seen in semen. β-MSP is also secreted from other mucosal tissues, albeit to a lower extent. The contribution of these other tissues to levels of β-MSP in blood is unknown.
We have also identified a novel set of SNPs, tagged either by rs10763588 or rs7098889, that is associated with blood and semen levels of β-MSP independent of rs10993994 genotype. We believe these two SNPs should be treated as equivalent. They are in extremely strong LD (r2=0.99) and both SNPs show similar association with blood and semen β-MSP levels independent of rs10993994. We attribute the observed difference between the two to minor sampling and genotyping errors. These SNPs are located in a linkage disequilibrium block that encompasses the upstream regulatory region of MSMB. As these two SNPs are several kilobases away from the transcription start site, an enhancer element in this region may contain a functional SNP. Alternatively, these SNPs may be in LD with another functional promoter SNP closer to the transcriptional start site. rs10763588/rs7098889 was not found to be associated with prostate cancer risk independent of rs10993994 (15). However, these genetic variants explain a much lower fraction of the variance in β-MSP levels. Considering the already low odds ratio of rs10993994 in prostate cancer risk, even if β-MSP is a true etiologic agent of prostate cancer, these SNPs probably influence prostate cancer risk to such a small magnitude that current association studies would be underpowered to detect an association. The biological significance of genetic variation in this haplotype will have to be determined from replication and functional studies.
The observation that rs10993994 is associated with decreased levels of β-MSP in healthy young men is consistent with the hypothesis that rs10993994 may influence prostate cancer risk by reducing the amount of β-MSP naturally produced by the prostate. Since the risk allele at rs10993994 is very common, with an allele frequency of 38% in our cohort and up to 80% in the HapMap Yoruban population (27), yet prostate cancer is nowhere near that common, lower levels of β-MSP are likely not the sole initiating event in prostate cancer. Instead, we hypothesize that decreased β-MSP may be only one factor that contributes to tumorigenesis. Much work is needed on the functional characterization of both the regulatory pathways affecting rs10993994 and MSMB expression, and β-MSP’s potential mechanism of action in prostate cancer development.
rs10993994 also has a moderate but statistically significant effect on both blood and semen levels of PSA. We have replicated a previous report of association of rs10993994 with blood plasma levels of PSA in older men without prostate cancer (17) and extended it into younger men. We also report a novel association of rs10993994 with semen levels of PSA; the magnitude of effect is similar to that of blood and exists for both total and free PSA. Our data indicates that rs10993994 affects PSA levels independently of the correlation between β-MSP and PSA. Similarly, we have replicated the association of rs10993994 with hK2 levels (19), a kallikrein highly similar to PSA and another candidate for a diagnostic biomarker. Additionally, we have identified a novel association between rs17178655, a SNP located in the intron between exons 3 and 4 of MSMB, and semen levels of PSA. Though these findings require replication, they suggest that there may be complex interactions between the genetic mechanisms controlling proteins secreted by the prostate. Further studies will be required to elucidate the regulatory mechanisms affecting natural variation in levels of prostate secreted proteins
A population-wide standard PSA threshold in prostate cancer screening has been suggested to have no to low efficacy in reducing mortality due to prostate cancer (28, 29). Common genetic variation causes physiological variation in PSA levels; incorporation of SNPs such as rs10993994 and those at the kallikrein locus on chromosome 19 into a prostate cancer mortality risk prediction model may improve current screening tactics (19, 30).
In conclusion, our results indicate that common genetic variation at the MSMB locus, particularly the prostate cancer associated SNP rs10993994, affects levels of prostate secretions detectable in the blood and semen of healthy young men. We add further epidemiological evidence to the hypothesis that rs10993994 alters β-MSP levels in vivo. This alteration in β-MSP levels is possibly at least partially responsible for the subsequent difference in prostate cancer risk due to the polymorphism at rs10993994. Immediate future studies to determine the functional significance of differing β-MSP levels in prostate cancer etiology will help fully flesh out the hypothetically causal relationship between res10993994, β-MSP levels, and prostate cancer development.
Supplementary Material
Acknowledgements
We thank Aleksander Giwercman for access to this unique cohort. We also thank Ms. Gun-Britt Eriksson and Kerstin Håkansson for expert assistance with immunoassays.
Grants/fellowships supporting the writing of this paper: This investigation was supported by grant TL1RR024998 of the Clinical and Translation Science Center at Weill Cornell Medical College (X.X.), grant P30 CA008748 to MSKCC (R.K.), research support from Swedish Cancer Society grant 3455 (H.L.), Swedish Research Council (Medicine) grant 20095 (H.L.), Fundación Federico SA (H.L.), David H. Koch through the Prostate Cancer Foundation, the Sidney Kimmel Center for Prostate and Urologic Cancers, and Specialized Program of Research Excellence grant P50-CA92629 from the National Cancer Institute.
Footnotes
Disclosure summary: Dr. Hans Lilja holds patents for free PSA and hK2 assays.
References
- 1.Eeles R, Kote-Jarai Z, Giles G, et al. Multiple newly identified loci associated with prostate cancer susceptibility. Nat Genet. 2008;40:316–21. doi: 10.1038/ng.90. [DOI] [PubMed] [Google Scholar]
- 2.Thomas G, Jacobs K, Yeager M, et al. Multiple loci identified in a genome-wide association study of prostate cancer. Nat Genet. 2008;40:310–5. doi: 10.1038/ng.91. [DOI] [PubMed] [Google Scholar]
- 3.Lilja H, Abrahamsson PA. Three predominant proteins secreted by the human prostate gland. Prostate. 1988;12:29–38. doi: 10.1002/pros.2990120105. [DOI] [PubMed] [Google Scholar]
- 4.Weiber H, Andersson C, Murne A, et al. Beta microseminoprotein is not a prostate-specific protein. Its identification in mucous glands and secretions. Am J Pathol. 1990;137:593–603. [PMC free article] [PubMed] [Google Scholar]
- 5.Abrahamsson PA, Andersson C, Bjork T, et al. Radioimmunoassay of beta-microseminoprotein, a prostatic-secreted protein present in sera of both men and women. Clin Chem. 1989;35:1497–503. [PubMed] [Google Scholar]
- 6.Ulvsbäck M, Lindström C, Weiber H, Abrahamsson PA, Lilja H, Lundwall A. Molecular cloning of a small prostate protein, known as beta-microsemenoprotein, PSP94 or beta-inhibin, and demonstration of transcripts in non-genital tissues. Biochem Biophys Res Commun. 1989;164:1310–5. doi: 10.1016/0006-291x(89)91812-3. [DOI] [PubMed] [Google Scholar]
- 7.Valtonen-André C, Sävblom C, Fernlund P, Lilja H, Giwercman A, Lundwall A. Beta-microseminoprotein in serum correlates with the levels in seminal plasma of young, healthy males. J Androl. 2008;29:330–7. doi: 10.2164/jandrol.107.003616. [DOI] [PubMed] [Google Scholar]
- 8.Tsurusaki T, Koji T, Sakai H, Kanetake H, Nakane P, Saito Y. Cellular expression of beta-microseminoprotein (beta-MSP) mRNA and its protein in untreated prostate cancer. Prostate. 1998;35:109–16. doi: 10.1002/(sici)1097-0045(19980501)35:2<109::aid-pros4>3.0.co;2-e. [DOI] [PubMed] [Google Scholar]
- 9.Vanaja D, Cheville J, Iturria S, Young C. Transcriptional Silencing of Zinc Finger Protein 185 Identified by Expression Profiling Is Associated with Prostate Cancer Progression. Cancer Res. 2003;63:3877–82. [PubMed] [Google Scholar]
- 10.Hyakutake H, Sakai H, Yogi Y, et al. Beta-microseminoprotein immunoreactivity as a new prognostic indicator of prostatic carcinoma. Prostate. 1993;22:347–55. doi: 10.1002/pros.2990220409. [DOI] [PubMed] [Google Scholar]
- 11.Garde SV, Basrur VS, Li L, et al. Prostate secretory protein (PSP94) suppresses the growth of androgen-independent prostate cancer cell line (PC3) and xenografts by inducing apoptosis. Prostate. 1999;38:118–25. doi: 10.1002/(sici)1097-0045(19990201)38:2<118::aid-pros5>3.0.co;2-g. [DOI] [PubMed] [Google Scholar]
- 12.Shukeir N, Arakelian A, Kadhim S, Garde S, Rabbani SA. Prostate secretory protein PSP-94 decreases tumor growth and hypercalcemia of malignancy in a syngenic in vivo model of prostate cancer. Cancer Res. 2003;63:2072–8. [PubMed] [Google Scholar]
- 13.Nam R, Reeves J, Toi A, et al. A Novel Serum Marker, Total Prostate Secretory Protein of 94 Amino Acids, Improves Prostate Cancer Detection and Helps Identify High Grade Cancers at Diagnosis. J Urol. 2006;175:1291–7. doi: 10.1016/S0022-5347(05)00695-6. [DOI] [PubMed] [Google Scholar]
- 14.Buckland PR, Hoogendoorn B, Coleman SL, Guy CA, Smith SK, O’Donovan MC. Strong bias in the location of functional promoter polymorphisms. Hum Mutat. 2005;26:214–23. doi: 10.1002/humu.20207. [DOI] [PubMed] [Google Scholar]
- 15.Chang B-L, Cramer SD, Wiklund F, et al. Fine mapping association study and functional analysis implicate a SNP in MSMB at 10q11 as a causal variant for prostate cancer risk. Hum Mol Genet. 2009;18:1368–75. doi: 10.1093/hmg/ddp035. [DOI] [PMC free article] [PubMed] [Google Scholar]
- 16.Xu B, Wang J, Tong N, et al. A functional polymorphism in MSMB gene promoter is associated with prostate cancer risk and serum MSMB expression. Prostate. 2010;70:1146–52. doi: 10.1002/pros.21149. [DOI] [PubMed] [Google Scholar]
- 17.Wiklund F, Zheng SL, Sun J, et al. Association of reported prostate cancer risk alleles with PSA levels among men without a diagnosis of prostate cancer. Prostate. 2008;69:419–427. doi: 10.1002/pros.20908. [DOI] [PMC free article] [PubMed] [Google Scholar]
- 18.Lilja H, Ulmert D, Vickers A. Prostate-specific antigen and prostate cancer: prediction, detection and monitoring. Nat Rev Cancer. 2008;8:268–78. doi: 10.1038/nrc2351. [DOI] [PubMed] [Google Scholar]
- 19.Klein RJ, Halldén C, Cronin AM, et al. Blood biomarker levels to aid discovery of cancer-related single nucleotide polymorphisms: kallikreins and prostate cancer. Cancer Prev Res. 2010;3:611–9. doi: 10.1158/1940-6207.CAPR-09-0206. [DOI] [PMC free article] [PubMed] [Google Scholar]
- 20.Richthoff J, Rylander L, Hagmar L, Malm J, Giwercman A. Higher sperm counts in Southern Sweden compared with Denmark. Human Reprod. 2002;17:2468–73. doi: 10.1093/humrep/17.9.2468. [DOI] [PubMed] [Google Scholar]
- 21.Sävblom C, Malm J, Giwercman A, Nilsson JA, Berglund G, Lilja H. Blood levels of free-PSA but not complex-PSA significantly correlates to prostate release of PSA in semen in young men, while blood levels of complex-PSA, but not free-PSA increase with age. Prostate. 2005;65:66–72. doi: 10.1002/pros.20254. [DOI] [PubMed] [Google Scholar]
- 22.Elzanaty S, Richthoff J, Malm J, Giwercman A. The impact of epididymal and accessory sex gland function on sperm motility. Hum Reprod. 2002;17:2904–11. doi: 10.1093/humrep/17.11.2904. [DOI] [PubMed] [Google Scholar]
- 23.Purcell S, Neale B, Todd-Brown K, et al. PLINK: a tool set for whole-genome association and population-based linkage analyses. Am J Hum Genet. 2007;81:559–75. doi: 10.1086/519795. [DOI] [PMC free article] [PubMed] [Google Scholar]
- 24.Barrett JC, Fry B, Maller J, Daly MJ. Haploview: analysis and visualization of LD and haplotype maps. Bioinformatics. 2005;21:263–5. doi: 10.1093/bioinformatics/bth457. [DOI] [PubMed] [Google Scholar]
- 25.Purcell S, Daly MJ, Sham PC. WHAP: haplotype-based association analysis. Bioinformatics. 2007;23:255–6. doi: 10.1093/bioinformatics/btl580. [DOI] [PubMed] [Google Scholar]
- 26.Lou H, Yeager M, Li H, et al. Fine mapping and functional analysis of a common variant in MSMB on chromosome 10q11.2 associated with prostate cancer susceptibility. Proc Natl Acad Sci U S A. 2009;106:7933–8. doi: 10.1073/pnas.0902104106. [DOI] [PMC free article] [PubMed] [Google Scholar]
- 27.Frazer KA, Ballinger DG, Cox DR, et al. A second generation human haplotype map of over 3.1 million SNPs. Nature. 2007;449:851–61. doi: 10.1038/nature06258. [DOI] [PMC free article] [PubMed] [Google Scholar]
- 28.Schröder FH, Hugosson J, Roobol MJ, et al. Screening and prostate-cancer mortality in a randomized European study. N Engl J Med. 2009;360:1320–8. doi: 10.1056/NEJMoa0810084. [DOI] [PubMed] [Google Scholar]
- 29.Andriole G, Crawford D, Grubb R, et al. Mortality results from a randomized prostate-cancer screening trial. N Engl J Med. 2009;360:1310–9. doi: 10.1056/NEJMoa0810696. [DOI] [PMC free article] [PubMed] [Google Scholar]
- 30.Zheng L, Sun J, Wiklund F, et al. Genetic Variants and Family History Predict Prostate Cancer Similar to Prostate-Specific Antigen. Clin Cancer Res. 2009;15:1105–11. doi: 10.1158/1078-0432.CCR-08-1743. [DOI] [PMC free article] [PubMed] [Google Scholar]
Associated Data
This section collects any data citations, data availability statements, or supplementary materials included in this article.