

Abstract
Simultaneous electrophysiological and functional magnetic resonance imaging (fMRI) measurements of animal models of epilepsy are methodologically challenging, but essential to better understand abnormal brain activity and hemodynamics during seizures. In the present study, fMRI of medetomidine sedated rats was performed using novel Rapid Acquisition by Sequential Excitation and Refocusing (RASER) fast imaging pulse sequence and simultaneous local field potential (LFP) measurements during kainic acid (KA) induced seizures. The image distortion caused by the hippocampal measuring electrode was clearly seen in echo planar imaging (EPI) images, whereas no artifact was seen in RASER images. Robust blood oxygenation level dependent (BOLD) responses were observed in the hippocampus during KA induced seizures. The recurrent epileptic seizures were detected in the LFP signal after KA injection. The presented combination of deep electrode LFP measurements and fMRI under medetomidine anesthesia, that does not significantly suppress KA induced seizures, provides a unique tool for studying abnormal brain activity in rats.
Keywords: fMRI, RASER, Medetomidine, Local field potential, Epilepsy, Kainic acid
Introduction
Functional magnetic resonance imaging (fMRI) using blood oxygenation level dependent (BOLD) contrast has become a valuable tool to non-invasively study normal and abnormal brain activity both in experimental and clinical settings. For example, simultaneous electroencephalogram (EEG)/fMRI is being increasingly applied in pre-surgical evaluation of patients with drug-refractory epilepsy to obtain information about brain areas that are involved in epileptoformic networks (1). One of the major challenges in epilepsy research is to understand the mechanisms of transformation of the post-injury brain from non-epileptic to epileptic. fMRI can provide a tool to probe novel aspects of network alterations occurring over the time course of the epileptogenic process in vivo in experimental models. These include characterization of neurovascular coupling in the epileptic brain, possible progressive network changes during the epileptogenic phase, and interrelationship between functional and histopathological changes.
To investigate relationships between different brain regions (i.e. hippocampus and amygdala) in epilepsy, it can be argued that local field potential (LFP) and fMRI recordings are necessary. Although simultaneous scalp EEG and fMRI recording may be methodologically easier to perform than LFP/fMRI measurements in rats, the amplitude of the evoked responses is much smaller in EEG recordings making single response analysis difficult. Furthermore, EEG electrodes will detect any obvious seizures but may not detect more interictal spikes. In addition, it is expected that the combination of LFP and fMRI recordings in animal models of epilepsy will provide more information about the coupling between neural and BOLD responses.
Performing simultaneous LFP/fMRI generates a major methodological challenge for the experimental setup to acquire relevant fMRI data from animals. First, animals have to be sedated or anesthetized without suppressing seizure activity. Second, recovery anesthesia should be used to allow the possibility for follow-up studies during the epileptic process. Third, electrophysiological data should be acquired simultaneously and from the same brain area as fMRI. Often this requires the use of depth electrodes as reliable data from many structures involved in epileptogenesis and ictogenesis, such as the hippocampus and the amygdala, cannot be recorded using scalp or brain cortical electrodes. Use of depth electrodes is challenging as local magnetic field variation in the vicinity of the electrode, caused by differences in magnetic susceptibility between the tissue and the electrode, can cause severe artifacts in the most commonly used fMRI pulse sequences such as the echo planar imaging (EPI) sequence. Recently, a new fast magnetic resonance imaging technique Rapid Acquisition by Sequential Excitation and Refocusing (RASER) has been described (2). RASER is based on formation of pure spin echoes and time encoding instead of phase encoding. Therefore, RASER possesses dramatically better performance than EPI in areas of large local magnetic field gradients.
Only a few fMRI studies in experimental models of epilepsy have been described (3-10) probably due to the methodological challenges mentioned above. Pioneering work has been done in models of absence epilepsy by using the Wistar AlbinoGlaxo rat of Rijswijk (WAG/Rij) with spontaneous spike-and-wave discharges (SWD) or chemically induced discharges with γ-butyrolactone (GBL) (3, 5-7). In these studies, simultaneous electrophysiological and fMRI of cerebral blood flow (CBF) measurements was performed to investigate SWD. Studies in WAG/Rij rats showed positive BOLD in the somatosensory cortex, motor cortex, thalamus and basal ganglia (6). When spike-and-wave discharges were induced by GBL, fMRI showed positive BOLD both in the sensory cortex as well as in the thalamus. However, negative BOLD changes were found in the motor cortex as well as in the temporal cortex (3), confirming the previously electrophysiologically verified involvement of somatosensory cortex and thalamus in generation and maintenance of absence seizures (11, 12). After induction of generalized tonic-clonic seizures with pentylenetetrazole (4, 13, 14) or bicuculline (6), fMRI has demonstrated an increase in BOLD signal in the neocortex, amygdala, hippocampal, hypothalamic and thalamic regions suggesting that fMRI could differentiate the network activity even between the different types of generalized seizures.
Previous studies in focal seizure models have induced ictal activity with penicillin application to the occipital cortex (9) or electrical stimulation of the hippocampus (10). Results demonstrated increased signals in hippocampus, thalamus and septum, but decreased signals in orbitofrontal, cingulated and retrosplenial cortex during partial seizures and increases in all of these regions during propagated seizures (10). However, none of the previous studies demonstrate simultaneous and co-localized field potential and fMRI measurements in rats under medetomidine anesthesia.
This work represents the first in a series of studies that aim to understand the development of epileptogenic networks and seizure generation in the post-injury brain. Here we focused on optimizing the experimental setup for simultaneous LFP and fMRI measurements by using anesthesia, from which animals can recover for long-term studies. First, we investigated how different anesthetic agents used in experimental fMRI (medetomidine, isoflurane and urethane) affect the electrophysiologically measured seizure activity in rats. Second, we examined the feasibility of performing simultaneous LFP/fMRI measurements to follow epileptic seizure activity after kainic acid (KA) using a deep electrode inserted into the hippocampus and the novel RASER MRI pulse sequence.
Materials and Methods
Animals
A total of 22 adult male Wistar rats (313 ± 26 g, University of Kuopio, National Laboratory Animal Center, Finland) were used for this study. The rats were housed in groups of 3 rats per cage in a controlled environment (lights on 07:00-19:00, humidity 50-60 %, temperature 22 ± 1 °C). Animals had free access to food and water. All animal procedures were approved by the Committee for the Welfare of Laboratory Animals of the University of Kuopio and the Provincial Government of Kuopio, and conducted in accordance with the guidelines set by the European Community Council Directives 86/609/EEC. Rats were divided into 4 experimental groups as described below.
Study designs
Assessment of three different anesthetics on kainate-induced local field potentials
As anesthetics can have a profound effect on LFP, imaging experiments were preceded by a preliminary experiment, in which we recorded kainate (KA)-induced LFPs using hippocampal electrodes in both freely moving and anesthetized animals (Groups 1 and 2). All rats were first anesthetized with isoflurane (4 % for induction and 1.5 % for maintenance during surgery) in 70 % N2O - 30 % O2 mixture for electrode implantation.
In Group 1 (n=3, freely moving), LFP measurements were conducted in awake animals. A chronic bipolar stainless steel electrode (diameter 0.127 mm) was implanted into the right hippocampus (3.0 mm posterior from bregma, 2.5 mm lateral from bregma and 2.5 mm ventral from the surface of the brain (15) and monopolar stainless steel screw reference and ground electrodes were implanted to the skull symmetrically over the cerebellum. The electrodes were connected to the 6-channel plug and glued to the skull with dental acrylic (Dentsply, York, PA). One week after surgery, the baseline signal was recorded for at least 10 min. Thereafter, seizure activity was evoked by KA (#K2389, Sigma Aldrich GmbH, Germany, 10 mg/kg, i.p.). LFP signal was monitored continuously for 2.5 hours via a hippocampal electrode using the Nervus EEG Recording System connected to a Nervus magnus 32/8 amplifier and filtered with high-pass 0.3 Hz and low pass filter 100 Hz cutoff.
In Group 2 (n=8), the effect of three different anesthetics on LFP activity was assessed during KA-induced seizures, including isoflurane, urethane and medetomidine. The scalp was removed and a small hole was drilled in the right hemisphere above the hippocampus using the same coordinates as above. A small incision to the dura was made, and an MRI compatible insulated tungsten wire electrode (50 μm diameter, California Fine Wire, Grover Beach, CA) was inserted into the right hippocampus (3.0 mm posterior from bregma, 2.5 mm lateral from bregma) at the depth of 2.5 mm from the surface of the brain using a stereotaxic electrode holder. Gelfoam gelatin sponge (Pfizer, New York, NY) was used to fill the hole in the skull to prevent the dental acrylic from irritating the brain. The electrode was bent towards to the neck and glued to the skull with dental acrylic. Chloridized silver wire reference and ground electrodes were placed subcutaneously in the neck. Intraperitoneal line (I.V. catheter, 16 G, Terumo) was implanted for KA administration.
After surgery, rats were fixed in an in-house made non-magnetic stereotaxic frame with a bite bar and earplugs. After transferring the rat to the stereotaxic frame, three of the 8 animals were anesthetized with isoflurane during LFP measurements. Two of the 8 rats were sedated with subcutaneous infusion of medetomidine (0.05 mg/kg bolus and 0.1 mg/kg/h infusion, Domitor®, Orion Pharma, Espoo, Finland, (16). Five min after bolus injection, isoflurane was discontinued. A continuous subcutaneous infusion of medetomidine was started 10 min after the bolus injection. Another group of 3 rats were injected with urethane (#U2500, Sigma Aldrich GmbH, Germany, 1.25 g/kg, i.p.) immediately after the isoflurane anesthesia was discontinued. Animals were allowed to spontaneously breathe a mixture of 70 % N2 - 30 % O2 and respiration rate was also recorded during the experiment (MR-Compatible, Model 1025 Monitoring & Gating system, SA Instruments, Inc., USA). Body temperature was kept at approximately 37 °C with a heating pad (HETO, Denmark, Heating Shaking Waterbath).
For isoflurane anesthetized animals, the 15 min baseline recording was started 60 min from the induction of anesthesia (30 min surgery + 30 waiting period). For rest of the animals, baseline was recorded 45-60 min after the completion of surgery when anesthesia was switched from isoflurane to medetomidine or urethane. KA-injection was given for each rat approximately 1 h 15 min after the end of surgery. After KA-injection, the animals were monitored for at least 2 h. LFP signal was measured using a BrainAmp MR plus magnet compatible system (Brain Products GmbH, Munich, Germany). The signal from the electrode was low pass filtered at 1000 Hz (sampling rate 5000 Hz).
Assessment of BOLD signal during sensory stimulation
Group 3 was designed for the evaluation of BOLD responses during sensory stimulation using EPI and RASER sequences. The sensory stimulation was performed to demonstrate favorable conditions for BOLD fMRI. Animals (n=4) were anesthetized with isoflurane during surgery. PE-10 tubing (Intramedic™ Clay Adams Brand, Polyethylene Tubing) was used as a catheter and inserted into the right femoral artery. Thereafter isoflurane anesthesia was switched to medetomidine sedation. A pair of small needles (27 G) was inserted in both forepaws. Forepaw stimulation was performed using bipolar rectangular pulses (9 Hz, 0.3 ms, 2.0 mA, A-M Systems, Sequim, WA) in a paradigm of three blocks; each block consisted of 30 images of baseline, 15 images of activation. After the last stimulation period, the imaging session ended with an additional 30 images of baseline. Four dummy scans were acquired before collecting functional data. The total number of images was 165 and total imaging time was 5 min and 40 sec. Forepaw stimulation was conducted separately for each forepaw.
Simultaneous fMRI and LFP measurements of seizures
In Group 4 (n=7), the KA induced seizures were investigated using simultaneous fMRI and FP measurements. Electrode implantation and animal fixation were done as described above for Group 2. Based on preliminary experiments, during fMRI procedures, animals were sedated with medetomidine. A femoral artery was cannulated (5 of 7 animals) for monitoring blood gases and pH during the fMRI experiment.
Functional MRI data acquisition was started approximately 45 min after switching from isoflurane anesthesia to medetomidine sedation. Blood samples were taken via artery catheter (volume 0.15 ml) thereafter blood sample was applied into cartridge (i-Stat G3+) and analyzed using i-STAT portable clinical analyzer (Abbott Laboratories Inc.) at the onset and end of the fMRI measurement. Imaging sessions started with electrical forepaw stimulation as a control measurement before simultaneous fMRI and LFP measurements of seizures to demonstrate favorable conditions for BOLD RASER measurements (made as in Group 3) followed by simultaneous LFP and fMRI measurements. First, a baseline consisting of 1000 images (33 min 20 sec) was collected. Before the baseline period, medetomidine sedation reached steady state and the respiration rate stabilized at a rate of 55-70 breaths/min. During baseline recordings, the possible effects of electrical forepaw stimulation can be assumed to be insignificant before KA injection. Then KA was injected (10 mg/kg, i.p.) and image acquisition was continued for 3000 images (1 h 40 min) in each rat. In each rat, the total number of images was 4000 and total imaging time was 2 h 13 min and 20 sec.
Magnetic resonance imaging
All experiments were performed with a 4.7 T horizontal scanner (Magnex Scientific Ltd., Abington, UK) interfaced with a Varian UnityInova console (Varian, Inc., Palo Alto, CA, USA). An actively decoupled volume radiofrequency coil and quadrature surface coil pair (RAPID Biomedical GmbH, Rimpar, Germany) was used for signal transmission and reception. Anatomical images were collected with a multislice spin-echo sequence (TR 2.5 s, TE 60 ms, image matrix of 256 × 256, and field of view of 5 cm × 5 cm).
To compare sensitivity of EPI and RASER pulse sequences to BOLD and demonstrate that physiological and technical conditions for fMRI measurements were consistent, electrical forepaw stimulation was conducted. During forepaw stimulation, functional MR data were acquired using a single-shot spin-echo EPI sequence (TR 2 s, TE 60 ms, slice thickness 1.5 mm, image matrix of 64 × 64, and field of view of 2.5 cm × 2.5 cm) and RASER sequence (TR 2 s, TE 60 ms, slice thickness 1.5 mm, image matrix of 64 × 32, and field of view of 2.5 cm × 2.5 cm). The imaging slice was positioned 1 mm posterior from bregma.
For simultaneous and co-localized field potential and fMRI measurements, the position of the electrode was confirmed with horizontal pilot scans and based on those the functional imaging slice was positioned 3 mm posterior from bregma. The center of the imaging slice was selected to be at the same anterior-posterior level as the recording electrode. Functional MR data were acquired using a single shot RASER sequence using a CHIRP frequency-modulated RF pulse producing 8 kHz excitation bandwidth (TR 2 s, TE 60 ms, slice thickness 1.5 mm, image matrix of 64 × 32, and field of view of 2.5 cm × 2.5 cm). A continuous time-encoding gradient was used during data acquisition (2). The RASER sequence was selected for simultaneous and co-localized field potential and fMRI measurements because of insensitivity to susceptibility problems due to the electrode compared to EPI. The effect of the recording electrode on the MR images is illustrated in Fig 1, where the anatomical, EPI and RASER images are shown with and without the electrode.
Figure 1.
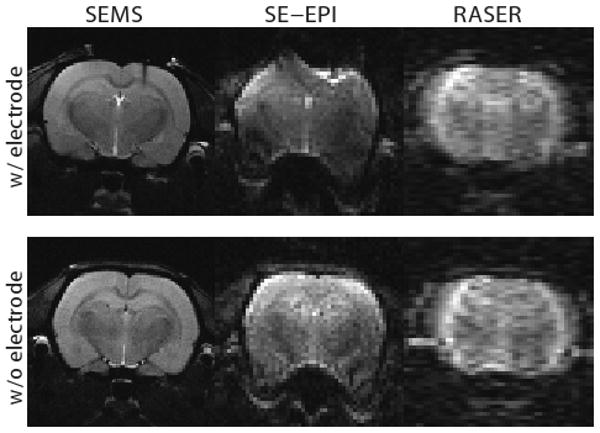
Anatomical image (SEMS), the spin-echo EPI (SE-EPI) image and the RASER image from the functional slice with and without a recording electrode.
Data analysis for electrophysiology and fMRI
Each LFP recording was visually inspected for epileptic activity. An electrographic spontaneous seizure was defined as a high-frequency (> 5 Hz), high-amplitude (> 2 × baseline) discharge that lasted at least 5 sec. Epileptic events occurring with an interval less than 5 s without the LFP returning to baseline were defined as belonging to the same seizure. The temporal locations of the seizures detected from FP were then used to form the block design model for fMRI analysis. During simultaneous fMRI and LFP measurements, the duration of the gradient artifact in the LFP signal resulting from a single RASER image is 65 ms. With the used repetition time of 2 seconds this corresponds to a 65 ms artifact period every 2 seconds, leaving at least 1.9 seconds of uncontaminated LFP data between the artifacts. This provided enough uncontaminated LFP data for obtaining the temporal occurrences of the seizures for the fMRI design. However, for Fig. 5 the gradient artifacts were suppressed for illustrational purposes by linearly interpolating points over every 65 ms RASER artifact period. The fMRI data were analyzed using SPM5 (Wellcome Department of Imaging Neuroscience, University College London, UK) along with in-house made code written in Matlab (MathWorks, Natick, MA). Preprocessing of the fMRI data included motion correction and spatial smoothing with a 2 × 2 pixel full width at half maximum Gaussian kernel. The first 1000 baseline images before KA injection were rejected from the analysis. A Gaussian hemodynamic response function (HRF) was used instead of the default canonical HRF used in SPM5. The parameters of the Gaussian HRF were selected to reflect the temporal characteristics of the measured rodent HRF reported in Silva and colleagues (17), resulting in an HRF peaking at 2 s and returning back to baseline at 5 s.
Figure 5.

The RASER time series from a 2 × 2 pixel ROI in the right hippocampus (upper signal) and the corresponding simultaneously recorded hippocampal LFP signal with gradient artifacts removed for illustrational purposes (lower signal). For clarity, a low frequency trend of the RASER signal (bold line) is shown on the RASER time series.
The statistical analysis was performed using the general linear model on a voxel-by-voxel basis. The onsets and durations of the seizure periods were determined using the simultaneously measured LFP signal, which were then used to form a block design model where every seizure block was modeled as a separate basis vector. Furthermore, the motion correction parameters were added as nuisance variables in the design matrix and a temporal high-pass filter with 1512 second cut-off was applied for filtering low frequency signal drifts. The activated brain areas during the epileptic seizures were assessed using a one-sample T-test thresholded at p ≤ 0.05 (Family Wise Error (FEW) corrected) and joint contrast with normalized weights was used in the inference of the individual seizure blocks. Finally, the thresholded statistical maps were overlaid on the anatomical images. All data are presented with mean ± standard deviation (STD).
Results
Physiology and electrical sensory stimulation
At the onset of measurements (Group 4), mean arterial pCO2 was 53.7 ± 6.3 mmHg, pO2 was 106.6 ± 15.8 mmHg and pH was 7.34 ± 0.05 (Mean ± STD). At the end of measurements, mean arterial pCO2 was 46.9 ± 6.4 mmHg, pO2 was 151.5 ± 32.9 mmHg and pH was 7.36 ± 0.03. Electrical forepaw stimulation was done separately for both hemispheres using EPI and RASER sequences. Figure 2 shows overlay maps of activated region and the time courses from a 2 × 2 pixel ROI in the right primary somatosensory cortex obtained both with SE-EPI and RASER sequences. In BOLD SE-EPI and RASER measurements, electrical stimulation of the right forepaw resulted in a significant (a one sample T-test, p ≤ 0.05) BOLD response (5.2 ± 3.2 %, 3.5 ± 1.4 %, respectively, Mean ± STD) in the left primary somatosensory cortex whereas left forepaw stimulation produced a significant BOLD response (3.5 ± 2.2 %, 2.7 ± 2.3 %) in the right primary somatosensory cortex in all animals (Group 3), demonstrating favorable conditions for BOLD fMRI. As expected BOLD response was slightly higher with SE-EPI than RASER due to T2* weighting during EPI read-out compared to pure T2 weighting in RASER.
Figure 2.
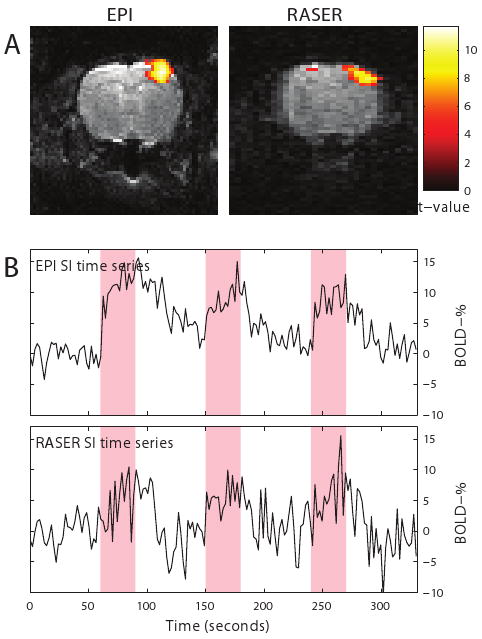
Activation maps and fMRI signal time courses from a 2 × 2 pixel ROI in the right primary somatosensory cortex during electrical forepaw stimulation in SE-EPI and RASER images.
LFP activity during KA-induced seizures
LFP recordings from the hippocampus under sedated and anesthetized conditions and awake state (Group 1 and 2) are shown in Figure 3. Particular attention was paid to baseline activity and the observed recurrent epileptic seizures during baseline after KA administration.
Figure 3.

Local field potentials recorded from the hippocampus in an awake rat, medetomidine-sedated rat, urethane anesthetized and isoflurane anesthetized rat before kainate administration (baseline), after kainate administration (seizure) and at post-ictal phase. In awake and medetomidine-sedated rats, recurrent epileptic seizures were observed, whereas in urethane and isoflurane anesthetized animals, separate seizures were not detected in the 2 h follow-up period.
Each of these conditions induced a unique LFP pattern. Isoflurane produced burst-suppression patterns during baseline recordings whereas burst-suppression patterns were absent in urethane anesthetized and medetomidine sedated rats. Under medetomidine sedation baseline activity corresponded closely to that of awake animals. Under urethane anesthesia, the amplitude of the baseline signal was higher than in awake and sedated rats.
The first epileptic seizures in the LFP signal were detected between 26 to 32 min (29 ± 3 min, Mean ± STD) after KA injection in awake animals. Under medetomidine sedation the first seizures were observed between 14 to 58 min (36 ± 14 min) after KA injection (Table 1). The duration of seizures varied between 14 sec to 10.5 min (103 ± 132 sec) in freely moving animals whereas in medetomidine sedated rats, the seizures lasted from 15 sec to 5 min (80 ± 53 sec). Some medetomidine sedated rats exhibited only a low number of seizures (Rat # 1, 2 and 12) whereas other animals demonstrated multiple seizures.
Table 1.
Kainic acid induced seizures in an awake, medetomidine-sedated, urethane and isoflurane anesthetized rats. Data from each animal is showed.
| Anesthesia | Number of seizures | Mean seizure duration (s) [range] | Delay to the 1st seizure (min) |
|---|---|---|---|
| Awake | |||
| Rat #8 | 8 | 170 [29-632] | 30 |
| Rat #9 | 11 | 67 [14-190] | 32 |
| Rat #10 | 15 | 94 [24-308] | 26 |
| Mean ± STD | 11 ± 4 | 103 ± 132 | 29 ± 3 |
| Medetomidine | |||
| Rat #1 | 3 | 52 [31-89] | 24 |
| Rat #2 | 5 | 114 [72-141] | 36 |
| Rat #3 | 28 | 54 [26-110] | 27 |
| Rat #4 | 19 | 132 [24-252] | 14 |
| Rat #5 | 12 | 122 [26-294] | 31 |
| Rat #6 | 8 | 76 [51-104] | 47 |
| Rat #7 | 15 | 63 [44-105] | 37 |
| Rat #11 | 13 | 39 [15-97] | 48 |
| Rat #12 | 6 | 85 [26-146] | 58 |
| Mean ± STD | 12 ± 8 | 80 ± 53 | 36 ± 14 |
| Isoflurane | |||
| Rat #13 | 0 | - | - |
| Rat #14 | 0 | - | - |
| Rat #15 | 0 | - | - |
| Urethane | |||
| Rat #16 | 0 | - | - |
| Rat #17 | 0 | - | - |
| Rat #18 | 0 | - | - |
Abbreviations: STD, standard deviation
Under urethane or isoflurane anesthesia no recurrent seizures were detected during the 2 h follow-up period post-kainate.
Simultaneous fMRI and LFP measurements during KA-induced seizures
After kainic acid injection, the LFP data showed recurrent epileptic seizures lasting from 24 sec to 5 min in the hippocampus (Group 4, Rat # 1-7). A model based on the LFP signal was used to explain the variability in the BOLD fMRI signal. Statistically significant increases in the BOLD signals during KA induced seizures were detected bilaterally in the hippocampus (Figure 4). Positive BOLD responses were also present unilaterally (Rat # 1) and bilaterally (Rat # 3, 4 and 7) in the somatosensory cortex; however, substantial inter-animal variation of localizations in cortical activations was detected. Increased BOLD signals were observed unilaterally in the amygdala (Rat # 1, 3 and 7). Negative BOLD signal changes were observed in the thalamus in one rat (Rat # 6).
Figure 4.
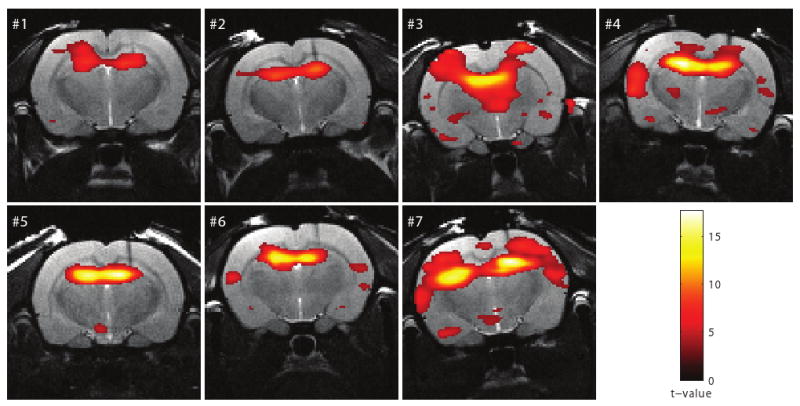
Activation maps (Rat # 1-7) in response to kainic acid induced seizures superimposed on the anatomical images. The threshold for statistical significance was set at p ≤ 0.05 (FWE corrected).
The feasibility of RASER for BOLD fMRI measurements is further demonstrated in Figure 5, where the time course from a 2 × 2 pixel ROI in the right hippocampus is shown together with the corresponding simultaneously recorded LFP signal to provide better means to visually compare the seizure periods (Rat # 2). A low frequency trend is shown on the RASER time course for clarity. Signal increases in the RASER time courses are observed concurrently with the epileptic seizures and then declined towards baseline postictally.
Discussion
The present study demonstrates a feasible experimental setup for simultaneous LFP and fMRI studies under recovery anesthesia. The results show that the susceptibility artifact caused by the electrode in EPI images is non-existent in RASER images. The comparison of different anesthetics also showed that the LFP signal in medetomidine sedated animals was very close to that in awake animals. Furthermore, clear positive BOLD responses were seen bilaterally in the hippocampus by using the LFP signal as a model to evaluate the BOLD fMRI activations in RASER images.
RASER pulse sequence in experimental fMRI settings
We used an MRI-compatible tungsten recording electrode in the dorsal hippocampus. One of the greatest challenges in simultaneous LFP measurements and fMRI is local magnetic field variation in the vicinity of the electrode caused by differences in magnetic susceptibility between the tissue and the electrode. This is especially problematic with gradient-echo EPI, which is the most often used pulse sequence in fMRI studies. The echoes collected even with spin-echo EPI have mixed contribution of T2 and T2* weighting, which leads to a significant degradation of the actual resolution of the sequence. Furthermore, geometric distortions and signal dropouts due to magnetic susceptibility artifacts are present in EPI images and create a serious drawback when considering simultaneous LFP/fMRI recordings from the identical location in brain. In the RASER sequence, however, multiple echoes per excitation are acquired in a way that all echoes have the same T2-weighting with no T2*-weighting, and, thus, image blurring from T2* decay does not occur. This also means that the BOLD effect is slightly reduced due to pure T2 contrast. Other limitations of RASER include it being a single slice method and having a lower resolution than EPI (64 × 32 vs. 64 × 64 pixels, respectively under the present experimental conditions).
Both FLASH and PRESTO pulse sequences have been used for fMRI. They are expected to have intermediate sensitivity to susceptibility artifacts between EPI and RASER as they are based on gradient echo but do not have extensive T2* -weighting during echo train. Also fast-spin echo (FSE) sequence, which is insensitive to susceptibility artifacts, has been used for fMRI. However, none of the aforementioned techniques is, in practice, a single-shot technique and thus would not allow long MRI acquisition free periods for collecting LFP data.
Previous studies have shown that even a cortical electrode caused a susceptibility artifact in SE-EPI image (18). Englot et al. (2008) used a bipolar tungsten stimulating/recording electrode and SE-EPI imaging sequence to evaluate seizures in rats (10). They minimized the susceptibility artifact by lowering the electrode at a 50° angle from the vertical using a posterior approach and fixing the skull adjacent to lambda with two to four plastic screws and dental acrylic. Also other material like carbon-fiber has been used to make electrodes and have been used for brain stimulation in experimental MRI studies (19, 20). Jupp and colleagues showed that carbon fiber electrode did not induce artifacts in T2-weighted images (19). Although carbon fiber electrodes are MRI compatible, the large size of the electrode can cause more severe trauma to the tissue than the tungsten electrode used in the present study. Dunn and colleagues observed that the carbon fibers had minimal susceptibility artifact in a GE FLASH images or FSE images (20).
Anesthesia in simultaneous LFP and fMRI studies
One major challenge for fMRI studies in animal epilepsy models is the choice of anesthesia. Many anesthetic agents suppress evoked responses (19) and can modify cerebral hemodynamics. Previous simultaneous electrophysiological and fMRI recordings in experimental animal models of epilepsy have been performed under isoflurane (8, 9), halothane (4), fentanyl-haloperidal (6, 7), and ketamine/xylazine (10) anesthesia. Tenney et al. anesthetized rats with ketamine/medetomidine or medetomidine, and then reversed the anesthesia with atipamezole (3, 5). They also compared changes in BOLD signal with and without isoflurane anesthesia (3). In this combination, isoflurane dramatically reduced BOLD signal changes, precluding the use of this anesthetic in fMRI studies of GBL-induced seizures.
Alpha-chloralose is the most commonly used anesthetic agent in animal fMRI studies to investigate BOLD responses during electrical forepaw stimulation (18, 21, 22). However, under alpha-chloralose anesthesia, high-amplitude transient peaks and occasional burst suppression episodes are observed in the electroencephalographic signals (21, 23). Under isoflurane anesthesia, we like others have found a burst-suppression pattern in the LFP signal (24, 25). Importantly, in the present study the burst-suppression patterns were absent under medetomidine and urethane anesthesia. Previously, Rojas and colleagues (24) reported the burst-suppression pattern in rats under urethane anesthesia but with a much higher urethane dose (1.5-2.0 g/kg) as used here. At the dose used here, urethane should induce only a slight depression in cortical areas and induces anesthesia without affecting neurotransmission or spontaneous firing in subcortical areas (26, 27). Furthermore, it is assumed that animals anesthetized with urethane represent similar physiologic and pharmacologic behaviors to those observed in freely moving animals (27). Our LFP data showed that KA induced seizures observed using isoflurane and urethane as anesthesia agents did not resemble seizures recorded under medetomidine anesthesia or in awake animals.
In the present study, we investigated epileptic brain activity using medetomidine sedation which can also be used in follow-up studies (28). The major advantage of using medetomidine sedation for studying BOLD signal during status epilepticus is its negligible effect on brain activity during seizures. Furthermore medetomidine provides sedation, anxiolysis, analgesia (29) and also some muscle relaxation, which minimizes motion artifacts in functional MR images. In addition, there is previous data where medetomidine sedation has been successfully used to study the auditory system in zebra finches (30) and resting-state connectivity in rats (31, 32). To our knowledge, medetomidine sedation has not been used to study brain activity in simultaneous LFP and fMRI measurements.
Simultaneous LFP and fMRI measurements during KA-induced seizures
We modeled the BOLD responses using the simultaneously measured hippocampal LFP signals in medetomidine anesthetized rats. Using LFP data as a priori information for the statistical fMRI analyses showed robust positive BOLD responses bilaterally in the hippocampus during seizure activity. Therefore it was expected that the major BOLD activations are seen predominantly in the hippocampus. In addition, our results demonstrated synchronous BOLD signal increases in cortical areas and the amygdala. This is in line with previous studies showing that after systemic KA injection, limbic seizures originating from the hippocampus will spread to the lateral septum, amygdaloid complex, subicular complex, entorhinal cortex and extralimbic areas (33).
Our results demonstrate predominantly positive BOLD signal changes in the hippocampus during seizure activity. The time course of kainic acid induced BOLD responses was associated with observed seizures in LFP signal. Positive BOLD in the brain reflect increases in cerebral blood flow and volume and oxygenation of the local tissue, which are linked to increased neuronal activity. By using simultaneous LFP recordings, we have been able to follow the time course of fMRI signals for individual seizures at relatively high spatial and temporal resolution. In the present study, measurements of BOLD activation during KA induced seizures were confined to one slice of brain, since RASER presently is capable of producing a “single-shot” image of only a single slice. This is clearly a limitation when considering studies of epileptogenic networks. In the future, it is likely that RASER will be used together with multi-slice EPI to obtain both whole brain coverage and LFP data from the exact location of the electrode, when required. Furthermore, a three-dimensional version of RASER might become available, which will make whole-brain activation measurements in seizures feasible. In human studies, 3D RASER has been used to compare RASER and SE-EPI (2). However, the current implementation of 3D RASER can only acquire one slice per TR period. Therefore, a single 64 × 32 × 32 volume would require 64 seconds with the current setup. This represents insufficient temporal resolution for fMRI studies. Aside from the single-slice limitation, there are several advantages of using RASER sequence over SE-EPI including true T2-weighting, no Nyquist ghosts, and no blurring from T2* decay between the echoes. One limitation of single-slice RASER is the long TE required to obtain only low resolution images.
In the present study, we had relatively high spatial and temporal (TR 2 sec) resolution in fMRI and especially good temporal resolution in LFP signals (a few milliseconds). Based on this, the present approach provides an excellent starting point to investigate the evolution of BOLD and the behavior of BOLD during epileptic seizures. In the present study, there were long intervals between the repetitive seizures so that there was time for the hemodynamic response to return to baseline. This phenomenon was observed at the post-ictal phase in the LFP signal, which also returned to baseline. To better understand BOLD signal changes during seizure initiation, progression or termination, hemodynamic changes such as CBF or cerebral blood volume (CBV) also have to be investigated and compared with changes in recorded neuronal activity. This could provide answers as to how hemodynamic changes are related to underlying neuronal activity in the normal and pathologic brain.
Conclusions
We have demonstrated the feasibility of RASER for simultaneous LFP/fMRI measurements under conditions were spin-echo EPI produces severely distorted images due to magnetic inhomogeneity caused by the deep electrode. It should be noted that as LFP data measured directly from the hippocampus were used to create the model for the statistical analysis, it is expected that fMRI results show activations predominantly in hippocampus and areas showing synchronous brain activity. Our data proves the usability of the present approach and provides a starting point for more advanced data analyses. Limitations of RASER include it being a single-slice method and that the BOLD effect is slightly reduced due to pure T2 contrast. However, the presented combination of deep electrode LFP measurements and fMRI in recovery anesthesia that is not suppressing KA induced seizures provides a unique tool for studying abnormal brain activity in rat epilepsy models. This approach may have implications for both understanding brain function during epileptic seizures and for designing fMRI analysis methods in anesthetized animals. As RASER has already been used to obtain human fMRI data (34) other potential applications include patients with implanted electrodes, provided that possible heating of the electrodes can be safely controlled.
Acknowledgments
We would like to thank Jarmo Hartikainen for assistance in the animal preparation and Nick Hayward, MSc for revising the language of the manuscript. This work has been financially supported by Academy of Finland (grant #123579) and the U.S. National Institutes of Health (grants P30 NS057091 and P41 RR008079).
References
- 1.Laufs H, Duncan JS. Electroencephalography/functional MRI in human epilepsy: What it currently can and cannot do. Curr Opin Neurol. 2007;20(4):417–23. doi: 10.1097/WCO.0b013e3282202b92. [DOI] [PubMed] [Google Scholar]
- 2.Chamberlain R, Park JY, Corum C, Yacoub E, Ugurbil K, Jack CR, Jr, Garwood M. RASER: A new ultrafast magnetic resonance imaging method. Magn Reson Med. 2007;58(4):794–9. doi: 10.1002/mrm.21396. [DOI] [PubMed] [Google Scholar]
- 3.Tenney JR, Duong TQ, King JA, Ludwig R, Ferris CF. Corticothalamic modulation during absence seizures in rats: A functional MRI assessment. Epilepsia. 2003;44(9):1133–40. doi: 10.1046/j.1528-1157.2003.61002.x. [DOI] [PMC free article] [PubMed] [Google Scholar]
- 4.Van Camp N, D'Hooge R, Verhoye M, Peeters RR, De Deyn PP, Van der Linden A. Simultaneous electroencephalographic recording and functional magnetic resonance imaging during pentylenetetrazol-induced seizures in rat. Neuroimage. 2003;19(3):627–36. doi: 10.1016/s1053-8119(03)00138-1. [DOI] [PubMed] [Google Scholar]
- 5.Tenney JR, Duong TQ, King JA, Ferris CF. FMRI of brain activation in a genetic rat model of absence seizures. Epilepsia. 2004;45(6):576–82. doi: 10.1111/j.0013-9580.2004.39303.x. [DOI] [PMC free article] [PubMed] [Google Scholar]
- 6.Nersesyan H, Hyder F, Rothman DL, Blumenfeld H. Dynamic fMRI and EEG recordings during spike-wave seizures and generalized tonic-clonic seizures in WAG/Rij rats. J Cereb Blood Flow Metab. 2004;24(6):589–99. doi: 10.1097/01.WCB.0000117688.98763.23. [DOI] [PubMed] [Google Scholar]
- 7.Nersesyan H, Herman P, Erdogan E, Hyder F, Blumenfeld H. Relative changes in cerebral blood flow and neuronal activity in local microdomains during generalized seizures. J Cereb Blood Flow Metab. 2004;24(9):1057–68. doi: 10.1097/01.WCB.0000131669.02027.3E. [DOI] [PubMed] [Google Scholar]
- 8.Mirsattari SM, Ives JR, Bihari F, Leung LS, Menon RS, Bartha R. Real-time display of artifact-free electroencephalography during functional magnetic resonance imaging and magnetic resonance spectroscopy in an animal model of epilepsy. Magn Reson Med. 2005;53(2):456–64. doi: 10.1002/mrm.20357. [DOI] [PubMed] [Google Scholar]
- 9.Mirsattari SM, Wang Z, Ives JR, Bihari F, Leung LS, Bartha R, Menon RS. Linear aspects of transformation from interictal epileptic discharges to BOLD fMRI signals in an animal model of occipital epilepsy. Neuroimage. 2006;30(4):1133–48. doi: 10.1016/j.neuroimage.2005.11.006. [DOI] [PubMed] [Google Scholar]
- 10.Englot DJ, Mishra AM, Mansuripur PK, Herman P, Hyder F, Blumenfeld H. Remote effects of focal hippocampal seizures on the rat neocortex. J Neurosci. 2008;28(36):9066–81. doi: 10.1523/JNEUROSCI.2014-08.2008. [DOI] [PMC free article] [PubMed] [Google Scholar]
- 11.Inoue M, Duysens J, Vossen JM, Coenen AM. Thalamic multiple-unit activity underlying spike-wave discharges in anesthetized rats. Brain Res. 1993;612(1-2):35–40. doi: 10.1016/0006-8993(93)91641-5. [DOI] [PubMed] [Google Scholar]
- 12.Meeren HK, Pijn JP, Van Luijtelaar EL, Coenen AM, Lopes da Silva FH. Cortical focus drives widespread corticothalamic networks during spontaneous absence seizures in rats. J Neurosci. 2002;22(4):1480–95. doi: 10.1523/JNEUROSCI.22-04-01480.2002. [DOI] [PMC free article] [PubMed] [Google Scholar]
- 13.Keogh BP, Cordes D, Stanberry L, Figler BD, Robbins CA, Tempel BL, Green CG, Emmi A, Maravilla KM, Schwartzkroin PA. BOLD-fMRI of PTZ-induced seizures in rats. Epilepsy Res. 2005;66(1-3):75–90. doi: 10.1016/j.eplepsyres.2005.07.008. [DOI] [PubMed] [Google Scholar]
- 14.Brevard ME, Kulkarni P, King JA, Ferris CF. Imaging the neural substrates involved in the genesis of pentylenetetrazol-induced seizures. Epilepsia. 2006;47(4):745–54. doi: 10.1111/j.1528-1167.2006.00502.x. [DOI] [PubMed] [Google Scholar]
- 15.Paxinos G, Watson C. The Rat Brain in Stereotaxic Coordinates. USA: Academic Press; 1998. [DOI] [PubMed] [Google Scholar]
- 16.Weber R, Ramos-Cabrer P, Wiedermann D, van Camp N, Hoehn M. A fully noninvasive and robust experimental protocol for longitudinal fMRI studies in the rat. Neuroimage. 2006;29(4):1303–10. doi: 10.1016/j.neuroimage.2005.08.028. [DOI] [PubMed] [Google Scholar]
- 17.Silva AC, Koretsky AP, Duyn JH. Functional MRI impulse response for BOLD and CBV contrast in rat somatosensory cortex. Magn Reson Med. 2007;57(6):1110–8. doi: 10.1002/mrm.21246. [DOI] [PMC free article] [PubMed] [Google Scholar]
- 18.Huttunen JK, Grohn O, Penttonen M. Coupling between simultaneously recorded BOLD response and neuronal activity in the rat somatosensory cortex. Neuroimage. 2008;39(2):775–85. doi: 10.1016/j.neuroimage.2007.06.042. [DOI] [PubMed] [Google Scholar]
- 19.Jupp B, Williams JP, Tesiram YA, Vosmansky M, O'Brien TJ. MRI compatible electrodes for the induction of amygdala kindling in rats. J Neurosci Methods. 2006;155(1):72–6. doi: 10.1016/j.jneumeth.2005.12.024. [DOI] [PubMed] [Google Scholar]
- 20.Dunn JF, Tuor UI, Kmech J, Young NA, Henderson AK, Jackson JC, Valentine PA, Teskey GC. Functional brain mapping at 9.4T using a new MRI-compatible electrode chronically implanted in rats. Magn Reson Med. 2009;61(1):222–8. doi: 10.1002/mrm.21803. [DOI] [PMC free article] [PubMed] [Google Scholar]
- 21.Peeters RR, Tindemans I, De Schutter E, Van der Linden A. Comparing BOLD fMRI signal changes in the awake and anesthetized rat during electrical forepaw stimulation. Magn Reson Imaging. 2001;19(6):821–6. doi: 10.1016/s0730-725x(01)00391-5. [DOI] [PubMed] [Google Scholar]
- 22.Austin VC, Blamire AM, Allers KA, Sharp T, Styles P, Matthews PM, Sibson NR. Confounding effects of anesthesia on functional activation in rodent brain: A study of halothane and alpha-chloralose anesthesia. Neuroimage. 2005;24(1):92–100. doi: 10.1016/j.neuroimage.2004.08.011. [DOI] [PubMed] [Google Scholar]
- 23.Ueki M, Mies G, Hossmann KA. Effect of alpha-chloralose, halothane, pentobarbital and nitrous oxide anesthesia on metabolic coupling in somatosensory cortex of rat. Acta Anaesthesiol Scand. 1992;36(4):318–22. doi: 10.1111/j.1399-6576.1992.tb03474.x. [DOI] [PubMed] [Google Scholar]
- 24.Rojas MJ, Navas JA, Rector DM. Evoked response potential markers for anesthetic and behavioral states. Am J Physiol Regul Integr Comp Physiol. 2006;291(1):R189–96. doi: 10.1152/ajpregu.00409.2005. [DOI] [PubMed] [Google Scholar]
- 25.Masamoto K, Kim T, Fukuda M, Wang P, Kim SG. Relationship between neural, vascular, and BOLD signals in isoflurane-anesthetized rat somatosensory cortex. Cereb Cortex. 2006 doi: 10.1093/cercor/bhl005. [DOI] [PubMed] [Google Scholar]
- 26.Maggi CA, Meli A. Suitability of urethane anesthesia for physiopharmacological investigations in various systems. part 1: General considerations. Experientia. 1986;42(2):109–14. doi: 10.1007/BF01952426. [DOI] [PubMed] [Google Scholar]
- 27.Hara K, Harris RA. The anesthetic mechanism of urethane: The effects on neurotransmitter-gated ion channels. Anesth Analg. 2002;94(2):313, 8. doi: 10.1097/00000539-200202000-00015. table of contents. [DOI] [PubMed] [Google Scholar]
- 28.Weber R, Ramos-Cabrer P, Justicia C, Wiedermann D, Strecker C, Sprenger C, Hoehn M. Early prediction of functional recovery after experimental stroke: Functional magnetic resonance imaging, electrophysiology, and behavioral testing in rats. J Neurosci. 2008;28(5):1022–9. doi: 10.1523/JNEUROSCI.4147-07.2008. [DOI] [PMC free article] [PubMed] [Google Scholar]
- 29.Lukasik VM, Gillies RJ. Animal anaesthesia for in vivo magnetic resonance. NMR Biomed. 2003;16(8):459–67. doi: 10.1002/nbm.836. [DOI] [PubMed] [Google Scholar]
- 30.Boumans T, Theunissen FE, Poirier C, Van Der Linden A. Neural representation of spectral and temporal features of song in the auditory forebrain of zebra finches as revealed by functional MRI. Eur J Neurosci. 2007;26(9):2613–26. doi: 10.1111/j.1460-9568.2007.05865.x. [DOI] [PMC free article] [PubMed] [Google Scholar]
- 31.Pawela CP, Biswal BB, Cho YR, Kao DS, Li R, Jones SR, Schulte ML, Matloub HS, Hudetz AG, Hyde JS. Resting-state functional connectivity of the rat brain. Magn Reson Med. 2008;59(5):1021–9. doi: 10.1002/mrm.21524. [DOI] [PMC free article] [PubMed] [Google Scholar]
- 32.Zhao F, Zhao T, Zhou L, Wu Q, Hu X. BOLD study of stimulation-induced neural activity and resting-state connectivity in medetomidine-sedated rat. Neuroimage. 2008;39(1):248–60. doi: 10.1016/j.neuroimage.2007.07.063. [DOI] [PMC free article] [PubMed] [Google Scholar]
- 33.Ben-Ari Y, Tremblay E, Riche D, Ghilini G, Naquet R. Electrographic, clinical and pathological alterations following systemic administration of kainic acid, bicuculline or pentetrazole: Metabolic mapping using the deoxyglucose method with special reference to the pathology of epilepsy. Neuroscience. 1981;6(7):1361–91. doi: 10.1016/0306-4522(81)90193-7. [DOI] [PubMed] [Google Scholar]
- 34.Goerke U, Chamberlain R, Garwood M, Ugurbil K. Statistical significance of the BOLD response probed by RASER. Proceedings of the 16th Annual Meeting of ISMRM; Toronto, Ontario, Canada. 2008. (Abstract 2371) [Google Scholar]