Abstract
Exploiting the speed benefits of echo-planar imaging (EPI), the echo-planar spectroscopic imaging (EPSI) sequence facilitates recording of one spectral and two to three spatial dimensions faster than the conventional MR Spectroscopic Imaging (MRSI). A novel four dimensional (4D) echo-planar correlated spectroscopic imaging (EP-COSI) was implemented on a whole body 3T MRI scanner combining two spectral with two spatial encodings. Similar to EPSI, the EP-COSI sequence used a bipolar spatial read-out train facilitating simultaneous spatial and spectral encoding, and the conventional phase and spectral encodings for the other spatial and indirect spectral dimensions, respectively. Multiple 2D correlated spectroscopy (COSY) spectra were recorded over the spatially resolved volume of interest (VOI) localized by a train of three slice-selective radio-frequency (RF) pulses (90°-180°-90°). After the initial optimization using phantom solutions, the EP-COSI data were recorded in the lower leg of eight healthy volunteers including one endurance trained volunteer. Pilot results showed acceptable spatial and spectral quality achievable using the EP-COSI sequence. There was a detectable separation of cross peaks arising from the skeletal muscle intramyocellular lipids (IMCL) and extramyocellular lipids (EMCL) saturated and unsaturated pools. Residual dipolar interaction between the N-methylene and N-methyl protons of creatine/phosphocreatine (Cr/PCr) was also observed in the tibialis anterior region.
Keywords: Echo Planar Imaging, 2D Correlated Spectroscopy, Intramyocellular lipids, Extramyocellular lipids, creatine, choline
INTRODUCTION
Proton (1H) magnetic resonance spectroscopy (MRS) non-invasively detects metabolite resonances associated with biochemical changes from several diseases and disorders (1–2). There has been significant attention focused on investigating the relationship between lipid composition to insulin sensitivity, diabetes and obesity within the skeletal muscle (3). In such diseases, over-accumulation of subcutaneous and visceral adipose tissues and extra-myocellular and intra-myocellular lipids (EMCL/IMCL) are important factors in pathogenesis (4–7). 1H MRS facilitates non-invasive discrimination and measurement of EMCL and IMCL pools in vivo (4–13). EMCL are nestled in long fatty septa along the muscle fiber bundles or fasciae, whereas IMCL are located within the cytoplasm of muscle cells as spherical droplets. IMCL concentrations have been found to be a marker of insulin resistance in obese and non-obese adults, as well as non-diabetic offspring of type 2 diabetic patients (12–14). In bone marrow, there is a single chemical environment for lipids. Hence, no chemical shift separation has been found analogous to that between EMCL and IMCL in muscle. It is also possible to estimate unsaturation by detecting the olefinic protons in the lipid chains (15–16).
1D MRS suffers from significant spectral overlap between many resonances even at 3T field strength. Limitations such as inadequate spectral dispersion unavoidable in 1D MRS can be overcome by increasing the number of spectral dimensions using 2D MRS sequences such as localized correlated spectroscopy (L-COSY) (17, 18). The general idea of 2D MRS experiments is to generate a second frequency axis by introducing incremental delays into the evolution period (t1) as shown in Fig. 1. The 2D L-COSY sequence was described in detail elsewhere (17). In the L-COSY spectrum, both non-coupled and coupled resonances appear on the diagonal similar to the 1D spectrum. The resonances for J-coupled spin systems occur at off-diagonal frequencies (F1, F2) and (F2, F1), where F1 ≠ F2. These off-diagonal (or cross) peaks give direct information regarding the coupling pattern within a spin system, thus minimizing the peak assignment ambiguities.
Figure 1.
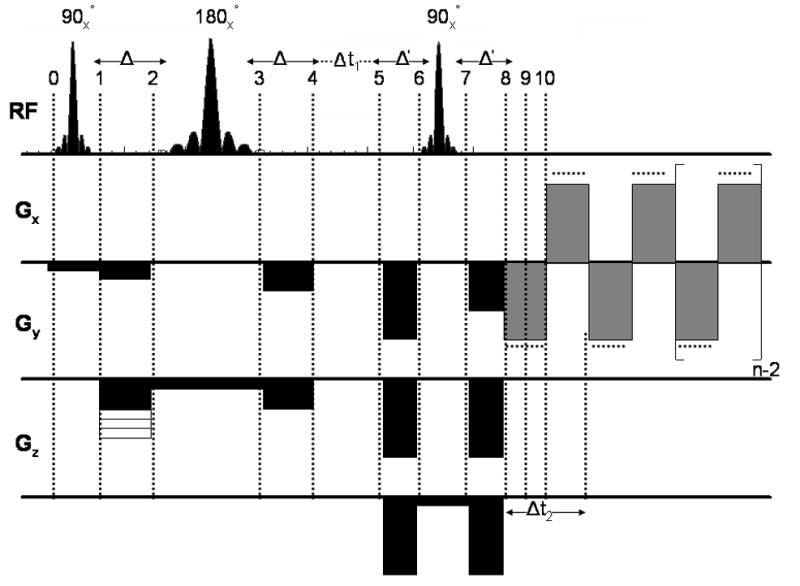
An illustration of the pulse sequence diagram for the EP-COSI sequence. The duration between the 180° and final 90° pulses was incremented to achieve the indirect dimension (t1) for the 2D COSY acquisition.
The previous 1D and 2D MRS research presented thus far has been limited to single-voxel (SV) MRS, which has many drawbacks and limitations including voxel placement and limited coverage. A few groups have utilized magnetic resonance spectroscopic imaging (MRSI) techniques to overcome these limitations (10–11, 19) for 1D MRS. The acquisition of MRSI has been greatly shortened by using echo-planar spectroscopic imaging (EPSI), a method originally proposed by Mansfield (20), in which a time varying readout gradient encodes spatial and spectral (temporal) dimensions during a single readout. Much effort has been devoted to implementing EPSI (21–25), the results of which have shown sufficient signal to noise ratio (SNR) to attempt more complicated spectral acquisitions required for four-dimensional (4D) MRSI on a whole body MRI/MRS scanner. There were previous attempts by other researchers to implement 4D spectroscopic imaging techniques on human as well as animal imaging MRI scanners and the total duration varied between 35 and 195 minutes (26–30).
The focus of this study was to implement and evaluate a novel 4D MRSI technique combining two spectral with two spatial encoding dimensions on a 3T MRI/MRS scanner. This 4D MRSI pulse sequence combines the speed advantage of EPSI and the increased spectral information using the COSY acquisition. The sequence is named Echo-Planar COrrelated Spectroscopic Imaging (EP-COSI). EP-COSI was evaluated to check the feasibility for detection of IMCL, EMCL and metabolites in healthy human calf muscles in vivo.
Materials and Methods
Shown in Fig. 1 is the EP-COSI sequence, which has been implemented on a Siemens Tim-Trio 3T MRI/MRS scanner (Siemens Medical Systems, Erlangen, Germany) running on the VB15A platform. A circularly polarized (CP) extremity “transmit” and “receive” coil was used. The sequence uses a 90°-180°-90° scheme for localizing the volume of interest (VOI) with crusher gradients surrounding the refocusing 180° and coherence transfer 90° RF pulses. The crusher gradients ensure magnetization outside of the VOI undergo de-phasing and will not significantly contribute to the acquired signal. The evolution time in between the 180° and final 90° RF pulses was incremented between scans (Δt1) to facilitate acquisition of the second (indirect) temporal dimension (t1). The bipolar read-out gradient train facilitates frequency encoding for one of the spatial dimensions as well the spectral encoding along the t2 dimension. The phase-encoding gradient was applied after the first slice-selective 90° RF pulse as shown in Fig. 1.
Experimental parameters for EP-COSI of phantom solutions were as follows: TR/TE = 2s/30ms, 512 (n) gradient pairs along the “read-out” or x direction, 512 t2 points from the positive (even) and negative (odd) read-out gradients, with each containing 32 oversampled frequency encoded points along the x-axis, 16 phase encodings along the y-axis, and 64 Δt1 increments of 0.8ms yielding 1250Hz along the indirect spectral dimension. The spectral width along the t2-dimension was determined by the time between successive even and or odd echoes (Δt2) and was approximately 1230Hz per pixel resulting from ramp-times of approximately 100μs and a total read-out bandwidth of 109,900Hz after oversampling. Two sets of data were collected one with water suppression (WS) and one without (NWS), the latter was used to perform data correction as described later in the manuscript.
The first test performed in this study was to compare the efficiency of 1D analog of the EP-COSI with that of 1D MRSI acquired using the EPSI pulse sequence. The sequences were both performed on a quad phantom, which consisted of 4 highly concentrated (50mM) metabolite phantoms [choline (Cho), creatine (Cr), N-acetyl Aspartate (NAA) and lactate (Lac)] submerged in a water bath. Standard T1-weighted coronal spin echo images were first acquired to guide positioning of the MRSI field of view and excitation region, which were set equal for both sequences. The parameters used for both scans were TR/TE = 2s/22ms, 512 gradient pairs, NΔt1 = 1, 16 averages and total scan time of approximately 9 min. Two sets of data were collected one with water suppression (WS) and one without (NWS). The resulting data sets were analyzed spatially to ensure that the EP-COSI sequence properly encodes k-space and the direct t2 dimension. The quad phantom was oriented with Cr and Lac phantoms located in the upper left and right cylinders, and Cho and NAA phantoms in the lower right and left corners. The associated SNR averaged over the central 4 voxels of each metabolite phantom data was measured by integrating the regions of the spectra surrounding each peak (± 0.08ppm), the noise was measured around 0.5ppm where no signal was expected.
In order to verify that the EP-COSI sequence properly encodes all four dimensions (kx, ky, t2, t1), a 4D MRSI data set was acquired from the quad phantom using the EP-COSI sequence. The resulting data set was analyzed to ensure proper 4D MRSI spectral quality with the expected diagonal and cross peaks. The parameters of the WS scan were TR/TE = 2s/22ms, n=512 gradient pairs, NΔt1 = 64, one average, spectral bandwidths of 1230Hz and 1250Hz along the t2 and t1 dimensions, and total scan time of 30 min., and the NWS scan was performed with the same parameters except NΔ t1 was set to 1 with an associated scan time of 32 seconds.
In vivo studies
The study group consisted of seven healthy male and one endurance trained female volunteers in the age range of 22–31 years whose weights ranged from 134–180 lbs. The volunteers lay in a supine position with the longitudinal position of the right calf parallel with the magnetic field B0. Standard T1-weighted axial spin echo images were acquired to guide positioning of the EP-COSI field of view and excitation region. The single slice EP-COSI was located approximately 2/3 of the length of the calf up from the ankle toward the knee. The total time spent in the scanner for each subject was approximately 45 minutes. Global water suppression based on ‘water suppression enhanced through T1 effects’ (WET) was performed prior to the EP-COSI sequence (31).
The parameters for calf muscle measurements were TR/TE = 1.5–2s/22ms, bipolar gradient pairs (n) = 512, field of view (FOV)=16–20cm, the total number of increments (Δt1) = 1 (NWS) and 50–64(WS), spectral band-widths of 1250Hz and 1230Hz along the t1 and t2 dimensions, and scan time = 1.6–2.1 min. (NWS) with averages = 4, and 20–34 min. (WS) with averages = 1. Similar to EPSI, the outer volume suppression (OVS) module was combined with the EP-COSI sequence (22).
Data processing
Reconstruction of the EP-COSI data sets was performed offline using custom MATLAB macros, the details are provided in Fig. 2. In an ideal EPSI readout, the center of k-space is traversed repeatedly with a constant time interval. Because of the opposite directions of the trajectories along kx caused by the alternating readout gradients, the odd (or even) echoes must be temporally reversed during data processing. The reversal of odd echoes translates this temporal shift in the echo train into a relative misplacement along kx between the odd and even echoes. This misplacement generates spectral ghost artifacts when the echoes are combined (25). The misalignment due to the sample itself may be due to background gradients resulting from improper shimming, local susceptibility induced inhomogeneity and eddy currents (32). These effects will produce additional phase and magnitude discontinuities between the echoes and will generate spectral ghosts. One widely used and effective method to tackle the ghost peaks is to separate the odd and even echoes in data processing. This method sacrifices half of the spectral bandwidth; however, sufficient bandwidth is retained to maintain approximately the 10ppm necessary at 3T. When the bandwidth is a limitation, Karczmar and co-workers have developed a method for combining the odd and even echoes that will maintain the spectral bandwidth and reduce spectral ghosts (25).
Figure 2.
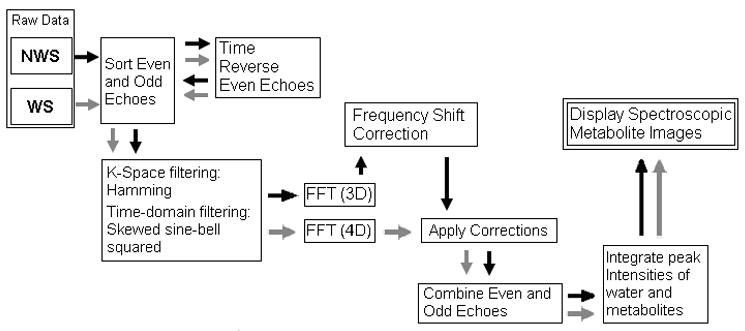
Different post-processing steps to process the EP-COSI data using the NWS and WS raw data.
Both the reference and water suppressed scans were first separated into even and odd subsets and reorganized into kx – ky - t2-(t1 for WS only) matrices. The reorganized spectra were zero-filled to 1024 and (100–128) points along the t2 and t1 dimensions. Skewed sine-bell squared apodization filters were used to improve the spectral sensitivity as well as resolution (17,18). Both data sets were then subjected to 3D/4D FFT reconstruction to produce two x-y- F2-(F1 for WS only) data matrices. The NWS EP-COSI data was used to determine the spatially dependent resonant frequency shifts due to local B0 inhomogeneities and eddy currents from the switching of the gradients. The corrections were measured as the drift from the central frequency of the main water resonance and compensated for by shifting the associated spectra of the WS EP-COSI data set. Combination of the even and odd echoes was performed by adding the complex subsets followed by FFT along the t1 dimension. The theoretical basis for the EP-COSI acquisition is detailed in the appendix.
RESULTS
Figure 3A shows four spectroscopic images of the quad phantom with each resonance peak data acquired using the EPSI sequence. The yellow box indicates the FOV and the inner white box indicates the excited VOI. From left to right, these intensity plots were overlaid on the MRI; Cr, Lac, Cho and NAA using the resonances at 3.0ppm, 1.25ppm, 3.2ppm and 2.0ppm, respectively. Figure 3B shows the equivalent data set for acquired using the 1D version of the EP-COSI sequence. Table 1 shows the SNR loss associated with the 1D variant of the EP-COSI sequence compared to that of EPSI. The SNR measured from the 1D variant of EP-COSI data reduced by 28%–43%, which was slightly less than theoretically expected and this could be due to B1 inhomogeneity resulting in spatial variation of flip angles resulting in non-uniform signal losses. This confirms that the alteration of the final pulse from a 180° refocusing into a 90° coherence transfer pulse results in a loss of signal.
Figure 3.
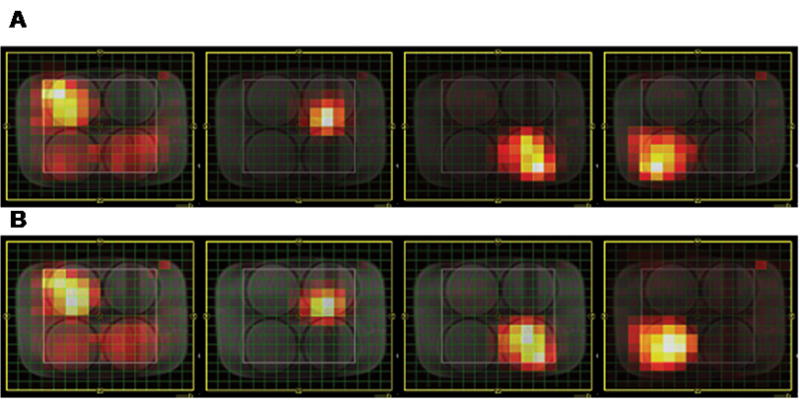
MR spectroscopic images of four phantoms containing 50mM Cr, 50mM Lac, 50mM Cho and 50mM NAA submerged in a water bath. These spectroscopic images were reconstructed from A) the EPSI data and B) the 1D spectral variant of EP-COSI (Δt1=0). Details on acquisition parameters and post-processing are provided in the Materials and Methods section.
Table 1.
Signal to noise ratios (SNR) calculated for four metabolites using EPSI and 1D spectral version of EP-COSI+.
| Cr | Lac | Cho | NAA | |
|---|---|---|---|---|
| EPSI | 58.74 | 133.75 | 485.42 | 96.74 |
| EP-COSI | 42.30 | 104.41 | 359.45 | 67.51 |
| SNR Loss | 38.9% | 28.1% | 35.1% | 43.3% |
The noise was measured as the average of signals from 0–0.7ppm and the signals from Cr, Lac, Cho and NAA were centered at 3.0ppm, 1.3ppm, 3.2ppm and 2.0ppm, respectively.
The 4D MRSI data sets acquired using the EP-COSI sequence had the same spatial characteristics as that of the 3D EPSI counterparts shown in Figure 3. 2D COSY spectra extracted from the center of each metabolite phantom are displayed in Figure 4A–D. Figure 4A shows the extracted 2D COSY spectrum from the Cr phantom having diagonal peaks at 3.0ppm and 3.9ppm from the N-methyl and N-methylene protons. Figure 4B shows the extracted 2D COSY spectrum from the Lac phantom with a highly visible doublet at 1.3ppm and a quartet at 4.1ppm. Figure 4C shows the extracted 2D COSY spectrum from the Cho phantom with three highly visible diagonal peaks at 3.2ppm, 3.5ppm and 4.0ppm. Figure 4D shows the extracted 2D spectrum from the NAA phantom with 3 expected diagonal peaks at 2.0ppm, 2.5ppm and 4.3ppm from the N-methyl, methylene and methine protons, respectively.
Figure 4.
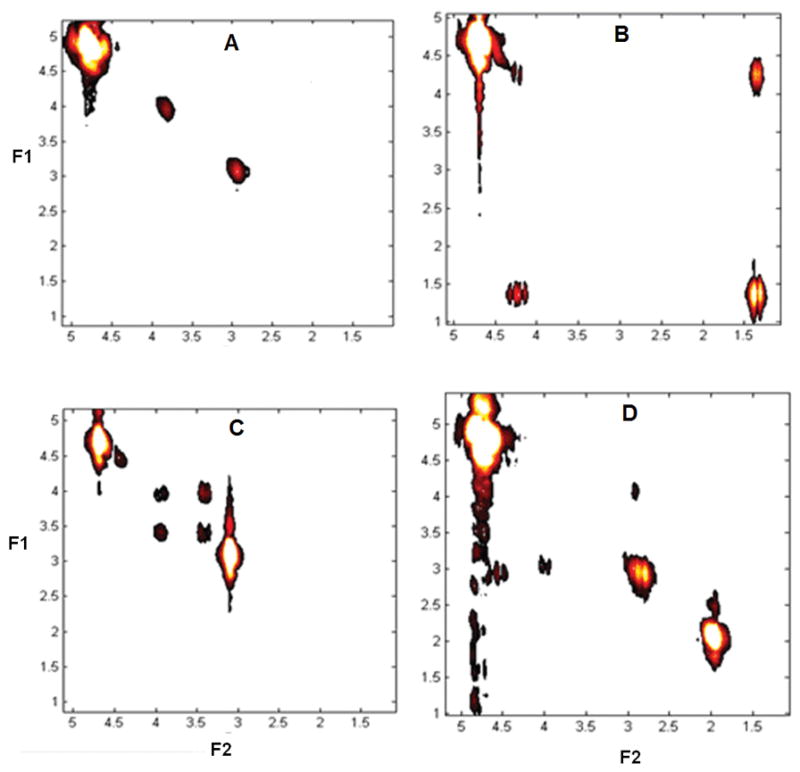
Extracted 2D COSY spectra (1ml) from the EP-COSI data from the four phantoms that were used for recording the data shown in Fig. 3.: A) Cr, B) Lac, C) Cho and D) NAA.
Human calf studies in vivo
The 2D COSY spectra from the tibial bone marrow as well as the soleus and tibialis anterior muscles were extracted for comparison within each subject. Figure 5 shows the T1-weighted MRI indicating different locations of the extracted 2D COSY spectra from the EP-COSI data recorded in a 27 year old healthy male volunteer. Two extracted 2D COSY spectra from the tibial marrow and soleus muscle region of the same volunteer are shown in Fig. 6A and 6B, respectively. The extracted volumes were 2ml and the details of the originating protons for each peak are discussed in Table 2 and Table 3 for the tibial marrow and soleus muscle, respectively.
Figure 5.
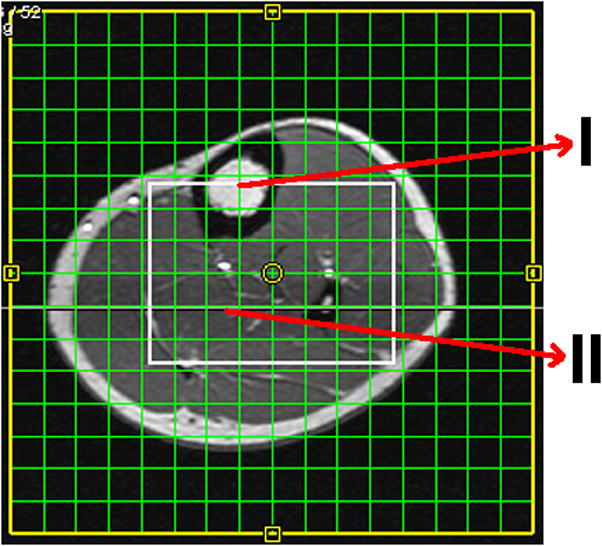
T1-weighted axial MR image recorded in a 27 year old healthy male showing the VOI (white box) localized by the three slice-selective RF pulses along three orthogonal planes and the arrows representing voxel locations for the tibial marrow (I), and soleus muscle (II).
Figure 6.
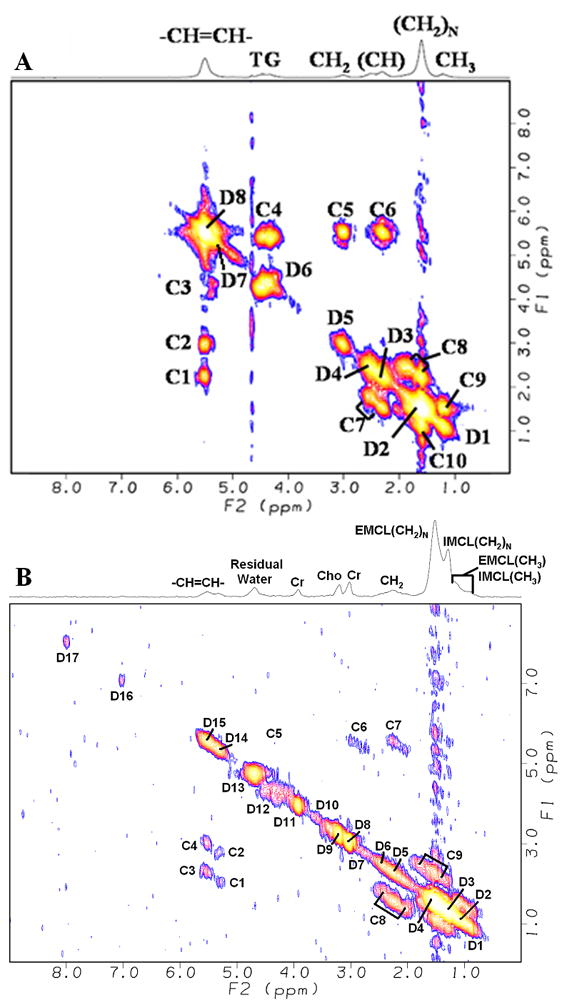
2D COSY spectra extracted (2ml) from the following regions of the EP-COSI data, the same used for Fig. 5 acquired in the 27 year old healthy male and the acquisition parameters were TR/TE = 1.75s/22ms, n = 512, number of Δt1 increments = 1 (NWS) and 50(WS), and scan time of 1.9 min. for NWS with 4 averages, and 23.3 min for WS with one average: A) tibial marrow and B) soleus, denoted by I and II, respectively in Fig. 5.
Table 2.
Assignments of 2D diagonal and cross peaks detected in the tibial marrow.
| Peak | Proton | F2 (ppm) | F1 (ppm) |
|---|---|---|---|
| D1 | CH3-(CH2)N | 0.85 | 0.85 |
| D2 | -(CH2)N- | 1.25 | 1.25 |
| D3 | CH2CH=CH | 2.0 | 2.0 |
| D4 | CH2OCOCH2CH2 | 2.2 | 2.2 |
| D5 | -CH=CHCH2CH=CH- | 2.7 | 2.7 |
| D6 | ROCH-CH2OCOR | 4.2 | 4.2 |
| D7 | ROCH-CH2OCOR | 5.3 | 5.3 |
| D8 | -CH=CH- | 5.3 | 5.3 |
| C1 | CH2CH=CH | 5.3 | 2.0 |
| C2 | -CH=CHCH2CH=CH- | 5.3 | 2.7 |
| C3 | ROCH-CH2OCOR | 5.1 | 4.2 |
| C4 | ROCH-CH2OCOR | 4.2 | 5.1 |
| C5 | -CH=CHCH2CH=CH- | 2.7 | 5.3 |
| C6 | CH2CH=CH | 2.0 | 5.3 |
| C7 | CH2OCOCH2CH2 | 2.1 | 1.4 |
| C8 | CH2OCOCH2CH2 | 1.4 | 2.0 |
| C9 | -CH2-CH3 | 1.2 | 0.9 |
| C10 | -CH2-CH3 | 0.9 | 1.2 |
Table 3.
Assignments of 2D diagonal and cross peaks detected in the soleus muscle**.
| Peak | Proton | F2 (ppm) | F1 (ppm) |
|---|---|---|---|
| D1 | CH3 (IMCL) | 0.85 | 0.85 |
| D2 | CH3 (EMCL) | 1.0 | 1.0 |
| D3 | (CH2)N (IMCL) | 1.25 | 1.25 |
| D4 | (CH2)N (EMCL) | 1.4 | 1.4 |
| D5 | CH2CH=CH | 2.0 | 2.0 |
| D6 | CH2OCOCH2CH2 | 2.2 | 2.2 |
| D7 | -CH=CHCH2CH=CH- -CH=CHCH2CH=CH & |
2.7 | 2.7 |
| D8 | N-CH3 (Cr) | 3.0 | 3.0 |
| D9 | TMA (Cho)* | 3.2 | 3.2 |
| D10 | Taurine (Tau) | 3.35 | 3.35 |
| D11 | N-CH2 (Cr) | 3.9 | 3.9 |
| D12 | ROCH-CH2OCOR^ | 4.3 | 4.3 |
| D13 | H2O (Water) -CH=CH-(IMCL) & |
4.7 | 4.7 |
| D14 | ROCH-CH2OCOR | 5.4 | 5.4 |
| D15 | -CH=CH- (EMCL) | 5.55 | 5.55 |
| D16 | Carnosine | 7.0 | 7.0 |
| D17 | Carnosine | 8.0 | 8.0 |
| C1 | IMCL(-CH=CH-CH2) | 5.4 | 2.15 |
| C2 | IMCL (-CH =CH-CH2) | 5.4 | 2.85 |
| C3 | EMCL(-CH =CH-CH2) | 5.55 | 2.15 |
| C4 | EMCL(-CH =CH-CH2) | 5.55 | 2.85 |
| C5 | ROCH-CH2OCOR | 4.2 | 5.4 |
| C6 | EMCL/IMCL | 5.6 | 2.9 |
| C7 | EMCL/IMCL | 2.8 | 5.5 |
| C8 | CH2-CH2 | 2.5 | 1.5 |
| C9 | CH2-CH2 | 1.5 | 2.5 |
| CRD | N-CH2 & N-CH3 (Cr) | 3 | 3.9 |
Trimethylamine (TMA);
Triglycerylbackbone
Assignments of peaks in the 2D COSY of tibialis anterior were the same except with additional dipole-dipole splitting of diagonal peaks of Cr, Tau, etc.
In order to demonstrate the feasibility of recording enhanced IMCL peaks using the EP-COSI sequence, a 22 year old endurance trained female volunteer was investigated (33). Fig. 7A shows the distribution of 2D COSY diagonal peaks of the N-methylene protons of Cr in multiple locations of the calf muscle overlaid on the T1-weighted axial MRI. Shown in Fig. 7B is a 2D COSY spectrum extracted from the tibialis anterior muscle with a volume of 3.125ml.
Figure 7.
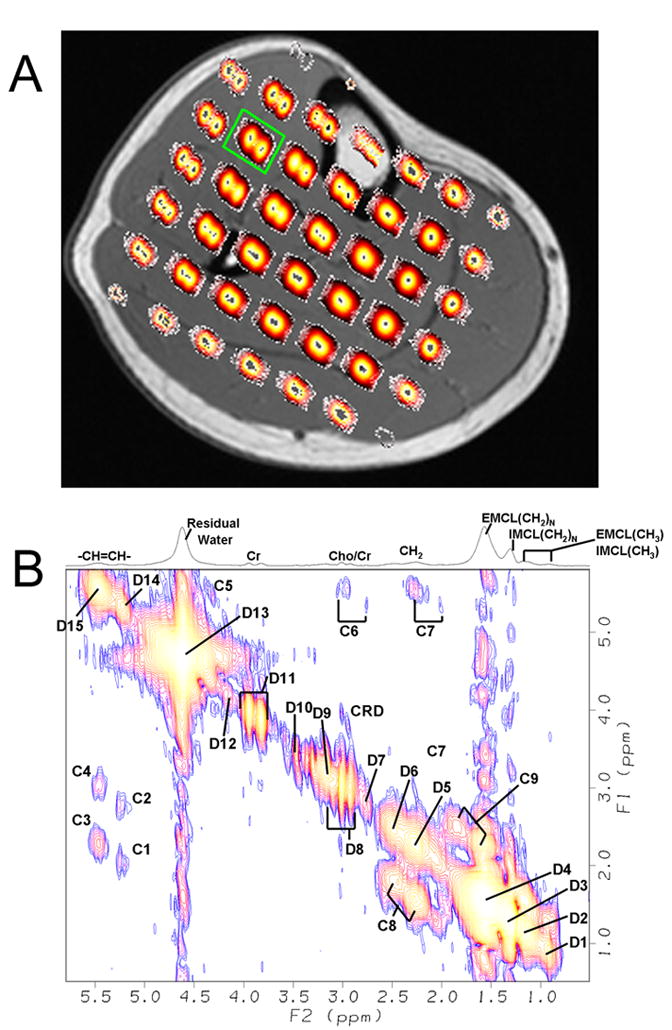
A) Multi-voxel display of the diagonal peaks of Cr centered at 3.9ppm overlaid on top of the axial T1-weighted slice MR image of a 22 year old endurance trained volunteer. B) 2D COSY spectrum extracted (3.125ml) from the EP-COSI data acquired in the tibialis anterior region of the calf muscle of the same volunteer (marked by a green box) and the acquisition parameters were: TR= 1.5s, number of Δt1 increments = 1 (NWS) and 50(WS), and scan time of 1.9 min. for NWS with 2 averages, and 20 min. for WS with one average.
DISCUSSION
The images presented in Fig. 3 show that both EPSI and 1D variant of EP-COSI sequences properly acquire the 1D MRSI data sets (kx, ky, t). There is a slight shift that increases with the spectral distance of each resonance from the resonant water peak due to the chemical shift mis-registration artifact. Signal bleed was significant in the Cr image reconstructed from the peak at 3ppm from the bottom cylinders which was due to the proximity of resonances from Cho and NAA. The 2D spectra within the quad phantom showed that both the diagonal and J-coupled cross peaks were accurately acquired. In Figure 4A, the protons of Cr representing these resonances are separated by more than 3 covalent bonds resulting in non-measurable J-coupling or residual dipolar interactions and hence, there were no cross peaks. In Figure 4B, the protons of Lac are J-coupled leading to the splitting along the diagonal and a distinct set of cross peaks. The two cross peaks in Figure 4C are due to J-coupling between two methylene protons of Cho (17,18). The diagonal multiplet in Figure 4D due to methine proton of NAA at 4.3 ppm was weaker than that at 2.5ppm due to proximity of these resonances close to the center of water suppression.
There were spectral differences between each tissue as shown in Fig. 6 and Fig. 7. The 2D COSY spectra extracted from the soleus (Fig. 6B) region showed detectable resonances in the muscle due to N-methyl and N-methylene protons of creatine (3.0ppm and 3.9ppm), trimethyl amine protons of choline (3.20ppm), taurine (3.35ppm) and imidazole protons of carnosine (7.0ppm and 8.0ppm) which are not present in the bone marrow. In addition, the diagonal peaks of Cr (3.9 and 3.0ppm) and other molecules in Fig. 7B recorded in the tibialis anterior muscle show clear splitting due to the residual dipole-dipole interaction as discussed previously (7,11,34). The 2D cross peaks due to the residual dipolar coupling were also detected as denoted by CRD in Fig. 7B. This agrees with previous reports that the fiber orientation in the tibialis anterior muscle is almost parallel to the external main magnetic field (B0), whereas the fibers in the soleus and other muscle regions were angulated close to the magic angle resulting in the cancellation of this residual dipolar coupling as shown in Fig. 7A (11,33). The remaining peaks in Fig. 7B were from both saturated and unsaturated lipid groups, whose concentrations were much higher in the marrow.
Fig. 6A recorded from the tibial marrow did not show the IMCL and EMCL compartments. The IMCL and EMCL levels in muscle have previously been reported using 1D MRS (3,5–14). Each of these groups has slightly different magnetic environment due to their structural properties and manifest in small chemical shift differences, namely 0.15ppm and 0.2ppm in the soleus and tibialis anterior muscle regions (7–9,11,34). The IMCL cross peaks were weaker in the tibialis anterior muscle of the 27 year old healthy volunteer in conformity with previous reports (7,8,11). As shown in Table 3, the 2D cross peaks identified at (F2=5.4ppm, F1=2.85ppm), (F2=5.4ppm, F1=2.15ppm), (F2=5.55ppm, F1=2.85ppm) and (F2=5.55ppm, F1=2.15ppm) were from the IMCL and EMCL pools of the unsaturated lipids. In contrast, the cross peaks identified in the high field region were from the IMCL and EMCL pools of both unsaturated and saturated lipids. As evident in Fig. 6 and Fig. 7, 2D COSY records IMCL and EMCL resonances from the unsaturated lipid pools in the lower field region as well as the combined saturated and unsaturated pools in the high field regions. Fig. 7B recorded from the tibialis anterior muscle of the endurance trained volunteer showed increased IMCL cross peaks as compared to that recorded in the 27 year old healthy volunteer. This finding is in agreement with previous reports showing increased volume of lipid droplets on electron micrographs as well as the IMCL peaks recorded by 1D MRS (33–35).
A recent study in the tibial bone marrow estimated the unsaturated lipid proton index using the cross peaks and diagonal peaks of the 2D spectrum (36). Another study demonstrated the feasibility of estimating the relative IMCL and EMCL pool magnitudes and calculating the degree of lipid unsaturation within soleus muscle using single-voxel localized one- and two-dimensional 1D and 2D MRS (16).
Water suppression was achieved by a WET sequence (31), where frequency selective RF pulses were followed by gradient pulses to dephase water signal. This usually takes place before the actual localization sequence as it is time consuming. As reported earlier, this leads to asymmetric cross peaks for all the metabolites and lipids close to water resonance including C3 and C4 in Fig. 6B and 7B. The bipolar gradients applied as a part of the EP-COSI sequence generates gradient echoes not only for the metabolites interest but also for the strong and increasingly recovering water signal. However, the number of gradient echoes acquired and the duration of total acquisition used in the present work shows that water did not pose a major interference with data acquisition and analysis.
CONCLUSION
Our preliminary results demonstrate that the 4D EP-COSI sequence can be successfully implemented on a whole body 3T MRI scanner within a total duration of approximately 30 minutes. We have shown both theoretically and experimentally that the EP-COSI pulse sequence is capable of acquiring a MRSI data set with two spectral dimensions within each voxel. The performance of the 4D acquisition scheme (kx, ky, t2, t1) was tested through both in vitro and in vivo studies. A 2D MRS spectrum has more information than a conventional 1D MRS spectrum due to increased spectral dispersion and the additional cross peaks indicating which resonances originate from the same molecule. The spatial and spectral accuracy and quality were first tested in vitro using the quad phantom and then in healthy calf muscle and bone marrow in vivo. The in vitro data proved that all four dimensions (x, y, F2, F1) were accurately acquired. The spatial extent of each was also accurately displayed though chemical shift mis-registration artifacts were present and need different strategies for reduction or elimination. The in vivo measurements verified the results acquired using the quad phantom that both the spatial and spectral properties of the EP-COSI data were properly encoded. The EP-COSI data clearly demonstrated discrimination of the different tissues within the human calf. Increased IMCL cross peaks were demonstrated in one endurance trained volunteer. The multi-dimensional data can be further enhanced through the use of a phased array coil acquisition, increased averaging or voxel size. The EP-COSI technique needs to be investigated for test-retest reproducibility using more controlled healthy volunteer cohort, age- and sex-matched as well as diabetic patients.
Acknowledgments
The authors thank Dr. Rajakumar Nagarajan, Dr James Sayre and Dr. Mark Brown for their assistance and discussions through the sequence development and analysis. This work was funded by an NIH R01 grant (1R01MH06569501A1) and IDEA grants from the US Army Breast and Prostate Cancer Research Programs (BCRP# W81XWH-04-01-0565 and PCRP# W81XWH-04-01-0885).
Appendix
Theory
In his seminal paper in 1984, Dr. Mansfield described the theoretical aspects of chemical shift imaging (CSI) using two different methods exploiting the robustness of echo-planar imaging (EPI), namely echo-planar shift mapping (EPSM) and the hybrid projection reconstruction echo-planar (PREP) (20). Matsui et al., Posse et al. and other researchers have described different variants of echo-planar spectroscopic imaging (EPSI) independently in which one spectral dimension was combined with two or three spatial dimensions (21–25). Recently, Mulkern et al. presented a comprehensive mathematical description of the 1D spectral and 2D spatial encoding in EPSI (24). In this work, we describe the spin state of a J-coupled two spin system (IS, I=1/2, S=1/2) undergoing two spectral and two spatial encodings using the EP-COSI sequence. We have used the product operator formalism described by Sorenson et al. (37,38).
Spatially Resolved 2D COSY signals acquired by EP-COSI
A slice-based localization using two slice selective (90°–180°) rf pulses along the same direction was used in the earlier versions of EPSI (PEPSI, LEPSI, etc.) (21–25). However, a volume localization using three slice-selective RF pulses (90°-180°-90°) along three orthogonal directions, previously named CABINET sequence (17) is performed. The initial spin state before the first slice-selective 90° RF pulse as shown in Fig. 1 is represented by,
| [1] |
where Iz is the initial longitudinal magnetization along the z-direction. After the first slice-selective 90° RF pulse and dephasing crusher gradient the resulting transverse magnetization of the spin system is given by,
| [2] |
The y-phase-encoding gradient pulse is applied after the 90° excitation RF pulse in conjunction with the crusher gradients and the refocusing gradient pulse. The resulting spin state at point 2 in Fig. 1 is described by,
| [3] |
where θy = ω(y) ty =γΔGytyY with ΔGy representing the phase-encoding gradient amplitude for a duration of ty, Y represents the field of view (FOV) covered along the y-direction and the gyro-magnetic ratio denoted by γ (39). After expanding eqn.[3], the spin state is represented by the following eqn.
| [4] |
Conventionally, a multi-step phase-cycling scheme such as EXORCYCLE (40) is used to eliminate the spurious signals stemming from improper refocusing of a 180° RF pulse. Since this leads to increased scanner time, symmetric B0 gradient crushers around the 180° refocusing RF pulse facilitate a single step based measurement in optimizing the refocusing process.
After the first set of B0 gradient crushers (point 2 in Fig. 1),
| [5] |
| [6] |
After a slice-refocusing 180° rf pulse along the y-direction (point 3 in Fig. 1),
| [7] |
After the second set of B0 gradient crushers (point 4 in Fig. 1),
| [8] |
After an evolution during the interval of 2Δ, duration for the first Hahn spin-echo period (TE1), the spins evolve under the influence of J coupling, but the chemical shift and its evolution during the gradient crushers will be refocused resulting in an echo characterized by (point 4 in Fig. 1),
| [9] |
The evolution of spin I due to both chemical shift (ω1(I)) and J-coupling with its coupled partner (S) during the t1 evolution is considered here (point 5 in Fig. 1).
| [10] |
To simplify the eqn. [10], let us define the following:
| [10a] |
| [10b] |
| [10c] |
| [10d] |
| [11] |
A second pair of B0 gradient crusher pulses was transmitted around the last slice-selective 90° RF pulse. After an evolution during the first set of crusher gradient pulses (point 6 in Fig. 1), the spin state is represented by the following eqn.,
| [12] |
The spin state after the last 90° RF pulse rotation (point 7 in Fig. 1) is given by the following eqn.
| [13] |
Terms containing Iz and 2IxSy were excluded in eqn.[13] since there will be no observable signal out of these terms.
The spin state after an evolution during the last set of B0 gradient crushers (θG) (point 8 in Fig. 1) is provided in the following eqn.,
| [14] |
It is evident from eqn.[14] that terms containing 2IzSx and 2IzSy demonstrate the coherence transfer from spin I to S. A similar equation was also calculated for S spin resulting in a coherence transfer to I spin.
The 4D signal acquired after the last crusher gradients is given as follows,
| [15] |
where tx relates to the duration of each read-out gradient, Σy runs over the total number of phase-encoding gradient steps (Ny), Σt1 runs over the total number of spectral-encoding steps (N1) for the 2nd spectral dimension and Σn represents number of gradient pairs. Fourier transformation along the spatial x and y, and two spectral dimensions yields a 4D data set in which each spatial grid (x, y) contains 2D spectral information.
As explained by Mansfield (20), Gx(t) is periodic modulo 2tx, where tx relates to the duration of each read-out gradient with Q periods in EPSI, then f(x,t2) may be written as two expressions f +(x, t2) and f −(x, t2) for positive and negative starting phase of Gx(0). These expressions are periodic spin-echo trains (20) which have been modified to include the detected t2 dimension as follows:
| [16] |
| [17] |
where g± are functions describing signal evolution in either a positive or negative gradient Gx and E(t2) is an editing function defined as
| [18] |
where the square cosine is a periodic function with period 2tx and is defined over the first period as
| [19] |
| [20] |
| [21] |
The resulting functions F+ and F− are mirror images of one another about the frequency origin. After reorganization of the data as described later the functions may be added together to display the y spatial dimension and the associated spectral domain.
Footnotes
Presented at the 50th ENC Meeting, Asilomar, California, March 29-April 3, 2009 and the 17th ISMRM Meeting, Honolulu, Hawaii, April 18-24, 2009
References
- 1.van der Graaf M. In vivo magnetic resonance spectroscopy: basic methodology and clinical applications. Eur Biophys J. 2009 Aug 13; doi: 10.1007/s00249-009-0517-y. [Epub ahead of print] [DOI] [PMC free article] [PubMed] [Google Scholar]
- 2.Befroy DE, Falk Petersen K, Rothman DL, Shulman GI. Assessment of in vivo mitochondrial metabolism by magnetic resonance spectroscopy. Methods Enzymol. 2009;457:373–393. doi: 10.1016/S0076-6879(09)05021-6. [DOI] [PMC free article] [PubMed] [Google Scholar]
- 3.Goodpaster BH, Wolf D. Skeletal muscle lipid accumulation in obesity, insulin resistance, and type 2 diabetes. Pediatric Diabetes. 2004;5:219–226. doi: 10.1111/j.1399-543X.2004.00071.x. [DOI] [PubMed] [Google Scholar]
- 4.Lara TM, Wong MS, Rounds J, Robinson MK, Wilmore DW, Jacobs DO. Skeletal muscle phosphocreatine depletion depresses myocellular energy status during sepsis. Arch Surg. 1998;133(12):1316–1321. doi: 10.1001/archsurg.133.12.1316. [DOI] [PubMed] [Google Scholar]
- 5.Krssak M, Petersen KF, Dresner A, DiPietro L, Vogel SM, Rothman DL, Roden M, Shulman GI. Intramyocellular lipid concentrations are correlated with insulin sensitivity in humans: a 1H NMR spectroscopy study. Diabetologia. 1999;42:113–116. doi: 10.1007/s001250051123. [DOI] [PubMed] [Google Scholar]
- 6.Machann J, Häring H, Schick F, Stumvoll M. Intramyocellular lipids and insulin resistance. Diabetes Obes Metab. 2004 Jul;6(4):239–248. doi: 10.1111/j.1462-8902.2004.00339.x. [DOI] [PubMed] [Google Scholar]
- 7.Boesch C, Machann J, Vermathen P, Schick F. Role of proton MR for the study of muscle lipid metabolism. NMR Biomed. 2006 Nov;19(7):968–988. doi: 10.1002/nbm.1096. [DOI] [PubMed] [Google Scholar]
- 8.Kreis R, Jung B, Slotboom J, Felblinger J, Boesch C. Effect of exercise on the creatine resonances in H-1 MR spectra of human skeletal muscle. J Magn Reson. 1999;137:350–357. doi: 10.1006/jmre.1998.1683. [DOI] [PubMed] [Google Scholar]
- 9.Szczepaniak L, Babcock EE, Schick F, Dobbins RL, Garg A, Burns DK, McGarry JD, Stein DT. Measurement of intracellular triglycerides stores by H-1 spectroscopy: validation in vivo. Am J Physiol. 1999;276:E977–E989. doi: 10.1152/ajpendo.1999.276.5.E977. [DOI] [PubMed] [Google Scholar]
- 10.Larson-Meyer DE, Newcomer BR, Hunter GR. Influence of endurance running and recovery diet on intramyocellular lipid content in women: a 1H-NMR study. Am J Physiol Endocrinol Metab. 2002;282:E95–E106. doi: 10.1152/ajpendo.2002.282.1.E95. [DOI] [PubMed] [Google Scholar]
- 11.Vermathen P, Kreis R, Boesch C. Distribution of intramyocellular lipids in human calf muscles as determined by MR spectroscopic imaging. Magn Reson Med. 2004;51:253–262. doi: 10.1002/mrm.10721. [DOI] [PubMed] [Google Scholar]
- 12.Brechtel K, Jacob S, Machann J, Hauer B, Nielsen M, Meissner HP, Matthaei S, Haering HU, Claussen CD, Schick F. Acquired generalized lipoatrophy (AGL): highly selective MR lipid imaging and localized 1H-MRS. J Magn Reson Imaging. 2000;12:306–310. doi: 10.1002/1522-2586(200008)12:2<306::aid-jmri13>3.0.co;2-w. [DOI] [PubMed] [Google Scholar]
- 13.Sinha R, Dufour S, Petersen KF, LeBon V, Enoksson S, Ma Y-Z, Savoye M, Rothman DL, Shulman GI, Caprio S. Assessment of skeletal muscle triglyceride content by 1H nuclear magnetic resonance spectroscopy in lean and obese adolescents: relationships to insulin sensitivity, total body fat, and central adiposity. Diabetes. 2002;51:1022–1027. doi: 10.2337/diabetes.51.4.1022. [DOI] [PubMed] [Google Scholar]
- 14.Machann J, Bachmann OP, Brechtel K, Dahl DB, Wietek B, Klump B, Häring HU, Claussen CD, Jacob S, Schick F. Lipid content in the musculature of the lower leg assessed by fat selective MRI: intra- and interindividual differences and correlation with anthropometric and metabolic data. J Magn Reson Imaging. 2003;17:350–357. doi: 10.1002/jmri.10255. [DOI] [PubMed] [Google Scholar]
- 15.Singer S, Sivaraja M, Souza K, Millis K, Corson JM. 1H-NMR detectable fatty acyl chain unsaturation in excised leiomyosarcoma correlate with grade and mitotic activity. J Clin Invest. 1996;98(2):244–250. doi: 10.1172/JCI118785. [DOI] [PMC free article] [PubMed] [Google Scholar]
- 16.Velan SS, Durst C, Lemieux SK, Raylman RR, Sridhar R, Spencer RG, Hobbs GR, Thomas MA. Investigation of muscle lipid metabolism by localized one- and two dimensional MRS techniques using a clinical 3T MRI/MRS scanner. J Magn Reson Imag. 2007;25:192–199. doi: 10.1002/jmri.20786. [DOI] [PubMed] [Google Scholar]
- 17.Thomas MA, Yue K, Binesh N, Davanzo P, Kumar A, Siegel B, Frye M, Curran J, Lufkin R, Martin P, Guze B. Localized two-dimensional shift correlated MR spectroscopy of human brain. Magn Reson Med. 2001;46:58–67. doi: 10.1002/mrm.1160. [DOI] [PubMed] [Google Scholar]
- 18.Binesh N, Yue K, Fairbanks L, Thomas MA. Reproducibility of localized 2D correlated MR spectroscopy. Magn Reson Med. 2002 Dec;48(6):942–948. doi: 10.1002/mrm.10307. [DOI] [PubMed] [Google Scholar]
- 19.Newcomer BR, Lawrence JC, Buchthal S, den Hollander JA. High-Resolution Chemical Shift Imaging for the Assessment of Intramuscular Lipids. Magn Reson Med. 2007;57:848–858. doi: 10.1002/mrm.21209. [DOI] [PubMed] [Google Scholar]
- 20.Mansfield P. Spatial mapping of the chemical shift in NMR. Magn Reson Med. 1984;1:370–386. doi: 10.1002/mrm.1910010308. [DOI] [PubMed] [Google Scholar]
- 21.Matsui S, Sekihara K, Kohno H. High speed spatially resolved NMR spectroscopy using phase-modulated spin echo trains. Expansion of the spectral bandwidth by combined use of delayed spin-echo trains. J Magn Reson. 1985;64:167–171. [Google Scholar]
- 22.Posse S, Tedeschi G, Risinger R, Ogg R, Bihan DL. High speed 1H spectroscopic imaging in human brain by echo planar spatial-spectral encoding. Magn Reson Med. 1995;33:34–40. doi: 10.1002/mrm.1910330106. [DOI] [PubMed] [Google Scholar]
- 23.Ebel A, Soher BJ, Maudsley AA. Assessment of 3D proton MR echo-planar spectroscopic imaging using automated spectral analysis. Magn Reson Med. 2001;46:1072–1078. doi: 10.1002/mrm.1301. [DOI] [PubMed] [Google Scholar]
- 24.Mulkern RV, Panych LP. Echo planar spectroscopic imaging. Concepts in Magnetic Resonance. 2001;13:213–237. [Google Scholar]
- 25.Du W, Du YP, Fan X, Zamora MA, Karczmar GS. Reduction of spectral ghost artifacts in high-resolution echo-planar spectroscopic imaging of water and fat resonances. Magn Reson Med. 2003 Jun;49(6):1113–1120. doi: 10.1002/mrm.10485. [DOI] [PubMed] [Google Scholar]
- 26.von Kienlin M, Ziegler A, Fur YA, Rubin C, Decorps M, Remy C. 2D-spatial/2D-spectral spectroscopic imaging of intracerebral gliomas in rat brain. Magn Reson Med. 2000;43:211–219. doi: 10.1002/(sici)1522-2594(200002)43:2<211::aid-mrm7>3.0.co;2-a. [DOI] [PubMed] [Google Scholar]
- 27.Hiba B, Serduc R, Provent P, farion R, Remy C, Ziegler A. 2D J-resolved spiral spectroscopic imaging at 7T: application to mobile lipid mapping in a rat glioma. Magn Reson Med. 2004;52:658–662. doi: 10.1002/mrm.20166. [DOI] [PubMed] [Google Scholar]
- 28.Mayer D, Dreher W, Leibfritz D. Fast U-FLARE-based correlation peak imaging with complete effective homonuclear decoupling. Magn Reson Med. 2003;49:810–816. doi: 10.1002/mrm.10447. [DOI] [PubMed] [Google Scholar]
- 29.Jensen JE, Frederick BdB, Renshaw P. Grey and white matter GABA level differences in the human brain using two-dimensional J-resolved spectroscopic imaging. NMR Biomed. 2005;18:570–576. doi: 10.1002/nbm.994. [DOI] [PubMed] [Google Scholar]
- 30.Kim DH, Henry R, Spielman D. Fast multi-voxel two-dimensional spectroscopic imaging at at 3T. Magn Reson Imaging. 2007;25:1155–1161. doi: 10.1016/j.mri.2007.01.118. [DOI] [PMC free article] [PubMed] [Google Scholar]
- 31.Ogg RJ, Kingsley PB, Taylor JS. WET, a T1-and B1-insensitive water suppression method for in vivo localized 1H MR Spectroscopy. J Magn Reson. 1994;104B:1–10. doi: 10.1006/jmrb.1994.1048. [DOI] [PubMed] [Google Scholar]
- 32.Jezzard P, Barnett AS, Pierpaoli C. Characterization of and correction for eddy current artifacts in echo planar diffusion imaging. Magn Reson Med. 1998 May;39(5):801–812. doi: 10.1002/mrm.1910390518. [DOI] [PubMed] [Google Scholar]
- 33.Hoppeler H, Howald H, Conley K, Lindstedt SL, Claasen H, Vock P, Weibel ER. Endurance training in human aerobic capacity and structure of skeletal muscle. J Appl Physiol. 1985;59:320–327. doi: 10.1152/jappl.1985.59.2.320. [DOI] [PubMed] [Google Scholar]
- 34.Kreis R, Boesch C. Spatially localized, one- and two-dimensional NMR spectroscopy and in vivo application to human muscle. J Magn Reson Series B. 1996;113:103–118. doi: 10.1006/jmrb.1996.0163. [DOI] [PubMed] [Google Scholar]
- 35.Goodpaster BH, He J, Watkins S, Kelley DE. Skeletal muscle lipid content and insulin resistance: Evidence for a paradox in endurance-trained athletes. J Clin Enocrinol Metab. 2001;86:5755–5761. doi: 10.1210/jcem.86.12.8075. [DOI] [PubMed] [Google Scholar]
- 36.Prescot AP, Dzik-Jurasz AS, Leach MO, Sirohi B, Powles R, Collins DJ. Localized COSY and DQF-COSY 1H-MRS sequences for investigating human tibial bone marrow in vivo and initial application to patients with acute leukemia. J Magn Reson Imaging. 2005;22:541–548. doi: 10.1002/jmri.20413. [DOI] [PubMed] [Google Scholar]
- 37.Sorensen OW, Eich GW, Levitt MH, Bodenhausen G, Ernst RR. Product operator formalism for the description of NMR pulse experiments. Prog NMR Spectroscopy. 1983;16:163–192. [Google Scholar]
- 38.Ernst RR, Bodenhausen G, Wokaun A. Principles of NMR Spectroscopy in one and two dimensions. Oxford Publications; Oxford: 1987. [Google Scholar]
- 39.Kohler SJ, Kolodny NH. Sodium magnetic resonance imaging and chemical shift imaging. Prog NMR Spectroscopy. 1992;24:411–433. [Google Scholar]
- 40.Bodenhausen G, Freeman R, Turner DL. Suppression of artifacts in two-dimensional J spectroscopy. J Magn Reson. 1977;27:511–514. [Google Scholar]


