Abstract
Metabolomics is an emerging field that is based on the quantitative measurement of as many small organic molecules occurring in a biological sample as possible. Due to recent technical advances, metabolomics can now be used widely as an analytical high-throughput technology in drug testing and epidemiological metabolome and genome wide association studies. Analogous to chip-based gene expression analyses, the enormous amount of data produced by modern kit-based metabolomics experiments poses new challenges regarding their biological interpretation in the context of various sample phenotypes. We developed metaP-server to facilitate data interpretation. metaP-server provides automated and standardized data analysis for quantitative metabolomics data, covering the following steps from data acquisition to biological interpretation: (i) data quality checks, (ii) estimation of reproducibility and batch effects, (iii) hypothesis tests for multiple categorical phenotypes, (iv) correlation tests for metric phenotypes, (v) optionally including all possible pairs of metabolite concentration ratios, (vi) principal component analysis (PCA), and (vii) mapping of metabolites onto colored KEGG pathway maps. Graphical output is clickable and cross-linked to sample and metabolite identifiers. Interactive coloring of PCA and bar plots by phenotype facilitates on-line data exploration. For users of commercial metabolomics kits, cross-references to the HMDB, LipidMaps, KEGG, PubChem, and CAS databases are provided. metaP-server is freely accessible at http://metabolomics.helmholtz-muenchen.de/metap2/.
1. Introduction
Metabolomics is an emerging “omics” technology that focuses on the identification and quantification of all or, in practice, the largest possible set of low-molecular-weight metabolites in a biological sample. In the series of the “omics” technologies genomics-transcriptomics-proteomics-metabolomics, metabolomics describes the physiological endpoint arising from the interplay of all regulatory and enzymatic processes in the biological system under consideration at a given time [1–4]. In other words, metabolomics analyses show the net effect of environmental and genomic factors influencing the status of a biological system.
In the recent years, advances in nuclear magnetic resonance (NMR) spectroscopy and mass spectrometry (MS) have allowed for quantitating hundreds of metabolites in blood and urine samples in a high-throughput manner. Due to the development of modern MS/MS-based analytical pipelines and metabolomics kits, application of metabolomics analyses is no longer restricted to specialized laboratories but can be used widely in biological and pharmaceutical research. As an example, metabolomics kits from Biocrates (AbsoluteIDQ) have been used to monitor effects of specific drugs on the metabolism of diabetic and nondiabetic mice [5] and in epidemiological studies to gain new insights into the effects of nutrition or genotypes on the human metabolism [6–8]. Other possible applications could be to data acquired on a set of different commercial platforms, such as MS data provided by Metabolon [9], Phenomenome [10], or NMR data processed using the Chenomx software suite [11].
Analogous to chip-based gene expression analyses, the enormous amount of data produced in high-throughput metabolomics experiments poses new challenges for automated data analysis. Various commercial and free stand-alone analysis tools dedicated to metabolomics data support experimentalists in aligning and binning peaks in MS and NMR spectra, provide functionality for annotating peaks with metabolites, or offer statistical analysis [12–14]. Recently, two web-based metabolomics data analysis tools have been published: (i) MetaboAnalyst (http://www.metaboanalyst.ca) [15], a tool that provides data analysis focusing on biomarker discovery and classification with respect to a single two-class phenotype (e.g., the sample phenotype treatment with the two classes treated and untreated), and (ii) MeltDB (http://www.cebitec.uni-bielefeld.de/groups/brf/software/meltdb_info/index.html) [16], which provides a data analysis pipeline for raw GC- and LC-MS data sets including metabolite identification. For preprocessed metabolite quantities, MeltDB offers statistical data analyses (e.g., t-test and PCA) with respect to the classes of a single phenotype. In contrast to MetaboAnalyst and metaP-server, MeltDB requires login and password to get access. While MetaboAnalyst and MetltDB are valuable tools for estimating the associations of a single phenotype with metabolite quantities, many experiments involve more than one phenotype with often more than two classes per phenotype. As an example, a metabolomics experiment for drug testing in mice can comprise phenotypes such as sex, strain (e.g., wild type/knock out strain), drug dose (e.g., 0/20/40 mg), and days of treatment (days 1–5). In this case, each sample measured is linked to the classes of multiple different phenotypes (e.g., Sample01: female; wild type; 20 mg; day 2). For such experiments, new tools are needed in order to get an overview over the observed trends in the metabolomics data across all phenotypes involved.
Here, we present metaP-server, a web-based, easy-to-use analysis tool for the statistical analysis of metabolomics data. In contrast to the existing web-servers, metaP-server mainly focuses on the interactive exploration and interpretation of metabolomics data (whether metabolite concentrations or peak lists) in the context of multiple multiclass (e.g., “treated with drug A, B, C”) and metric (e.g., weight, age) sample phenotypes. Thus, the metaP-server supports experimentalist in gaining first insights into how the different sample phenotypes affect the metabolite quantities observed. These insights facilitate choosing the data subsets and phenotypes that should be analyzed by using further statistical methods for classification and biomarker discovery (as, e.g., provided by MetaboAnalyst). metaP-server provides hypothesis tests and correlation tests for nonmetric and metric phenotypes, optionally including all possible pairs of metabolite concentration ratios as quantitative traits. As shown in previous metabolomics studies, using ratios can reduce noise caused by individual differences in absolute metabolite concentrations and, thus, strengthen the association [5, 7, 8]. Furthermore, the server offers principal component analysis (PCA). PCA plots and barplots showing the concentration of a particular metabolite in the samples can be colored interactively by phenotypes. Moreover, the graphical output is clickable and cross-linked to the respective sample or metabolite pages. Concentrations of metabolites in samples relative to the mean are mapped onto colored KEGG pathway maps. Interactive coloring, cross-linking, and pathway mapping particularly aim to facilitate on-line data exploration in the context of multiple phenotypes. For the special needs of kit-based high-throughput experiments, we implemented functions for the estimation of reproducibility and batch effects, as well as outlier detection. For users of the Biocrates AbsoluteIDQ kit, original cross references to the HMDB [17], LipidMaps [18], KEGG [19], PubChem [20], and CAS databases have been derived and are freely provided. The metaP-server is freely accessible at http://metabolomics.helmholtz-muenchen.de/metap2/.
2. Data Input
To start a new analysis in metaP-server (link: “Start a new run” on the main page), users are asked to provide the metabolomics quantitation data table in semicolon separated format, which can be exported from most spreadsheets. Users can choose between three different input formats: (i) “quant. data”, (ii) “quant. data with KEGG ids”, and (iii) “AbsoluteIDQ kit”. The server expects samples to be in rows and quantitated metabolites or peak intensities in columns. While for AbsoluteIDQ, metaP-server directly accepts the export file (extension. csv) as produced by the MetIQ software (shipped with the kit), data from other experiments can be provided as a table where the first row contains identifiers for the metabolites and the first column contains unique sample identifiers such as barcodes. Optionally, a second column entitled “Sample Description” can contain user sample identifiers that are not necessarily unique. The server also accepts files with data starting at another column than column two or three, when the users specifies an additional parameter input frame for auxiliary data. Optionally, the user can provide KEGG identifiers with the data. For this purpose, the user must choose “quant. data with KEGG ids” and must add one or more rows with the keyword “KEGG” in the first column after the header row of the table.
In principle, the processing of the data can be started immediately after providing the metabolomics quantitation data. However, for using the full functionality of the server, phenotypes or experimental conditions related to the samples measured can be specified in a separate file. The first column of this table must contain the unique sample identifiers of the respective samples. Following columns may include any categorical (e.g., sex, strain) or metric (e.g., weight, age, drug dose) sample phenotype or experimental condition (e.g., batch number). Categorical phenotypes are not restricted in the number of categories. If phenotypes are described by numeric values but are categorical rather than continuous regarding the actual values (e.g., drug dose: 10 mg, 20 mg, 40 mg corresponding to low, medium, and high dose), these phenotypes are analyzed using both the hypothesis test for categorical phenotypes and the correlation test for metric phenotypes. Special key words for column headers such as “Replicates” and “Batches” can be used for defining control samples (replicated reference samples) and batches in the data set. By using these keywords in the uploaded phenotype file, basically any subset of samples can be specified as controls for the calculation of coefficients of variation (cv) and the estimation of batch effects. For this purpose, all control samples must be denoted by the same word (e.g., “control”) in the “Replicates” column. For data in AbsoluteIDQ format, replicated samples and batch information is extracted automatically if available.
Before starting the processing, the user can specify a job description and optionally provide an email address for notification regarding the job status. By default jobs are kept private. In this case, the data is only accessible via the unique job id created by the server. Moreover, the users can change the settings for several parameters (e.g., for forcing deletion of reference samples, outliers, and/or noisy metabolites before statistical data analysis, and forcing the calculation of metabolite ratios). All job results remain on the server for at least four weeks. Analysis results can be downloaded as an archive (zip) file.
3. Processing and Methods
After submitting the job, the web-server first tests the compliance of uploaded data with the format specified. The server then starts several analyses that are related to data quality control. Depending on the options chosen on the submission page, the server either deletes outliers, noisy metabolites, and reference samples before further data analysis or the server continues analysis based on all data points disregarding quality.
Though metaP-server does not explicitly restrict the number of samples, quantitated metabolites/peak intensities, or phenotypes that can be uploaded, the time required for the complete analysis including the generation of clickable images largely depends on these numbers. As an example, data analysis for a typical data set from a kit-based experiment with 96 samples and 163 metabolites took 2 minutes for two phenotypes. For 1000 samples and 200 metabolites the analysis of two phenotypes was finished after 27 minutes, while the analysis of 100 samples and 5000 peak intensities took 204 minutes When the option for the calculation and analysis of all-against-all metabolite ratios was chosen for the first example with 96 samples and 163 metabolites, the run time increased to 24 minutes.
3.1. Data Quality Control
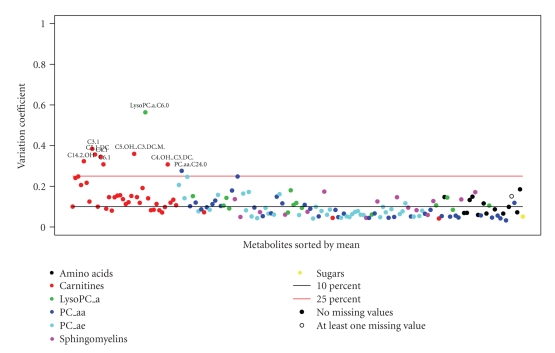
If replicated measurements of reference samples (controls) are provided with the data, metaP-server calculates the corresponding coefficient of variation (cv) for each metabolite and tags all metabolites with a cv above a given threshold. The cv for each metabolite is visualized in a diagram (Figure 1). For estimating batch effects in large metabolomics experiments, metaP-server provides p-values for the association of metabolite concentrations with batches. Boxplots showing the metabolomics data and, if available, the corresponding reference data depending on the batches help to immediately capture potential batch effects. metaP-server also reports outliers among the samples. Samples are considered as outliers if the metabolite quantities measured for this sample lie 1.5 times the inter quartile range (IQR) below or above the corresponding median for 30% of the data columns.
Figure 1.
Example for output generated by metaP-server: plot of coefficient of variation for replicated measurement of reference samples (controls) as part of data quality checks.
The uploaded phenotypes are matched with the samples provided in the quantitation data according to the unique sample identifiers. Empty columns and columns containing nonnumeric values that have different values for all samples are ignored for further analysis.
3.2. Data Analysis in the Context of Sample Phenotypes
The main objective of metaP-server is allowing for the analysis of metabolomics data in the context of sample phenotypes. The following types of analyses are provided.
3.2.1. General Statistical Measures
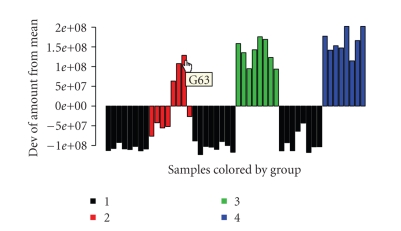
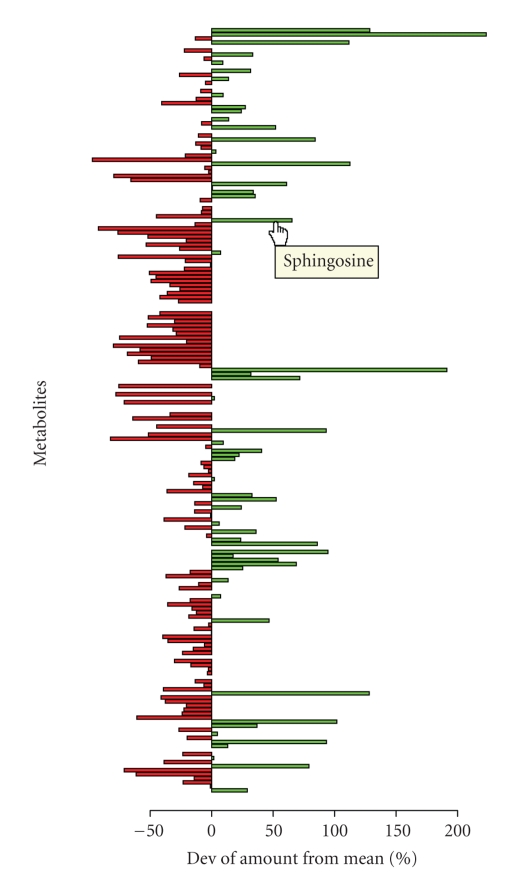
metaP-server calculates general statistical measures for the metabolite quantifications including mean, median, and standard deviation in relation to the mean. The server also provides histograms for estimating the distribution of metabolite concentrations in the samples. QQ-Plots plotting the actual distribution versus the corresponding theoretical values for normal (red) and log-normal (black) distributions allow for deciding which of the theoretical distributions fits best. Metabolite barplots show the concentrations of a particular metabolite in all samples measured (Figure 2) and, vice versa, sample barplots visualize the concentrations of all metabolite concentrations measured for a particular sample (Figure 3). Metabolite barplots can be easily colored by the phenotypes.
Figure 2.
Examples for output generated by metaP-server: metabolite barplot colored by the phenotype “groups” with the classes 1–4.
Figure 3.
Examples for output generated by metaP-server: sample barplot with green color denoting high and red color denoting low concentration of the respective metabolite relative to the mean value.
3.2.2. Principal Component Analysis
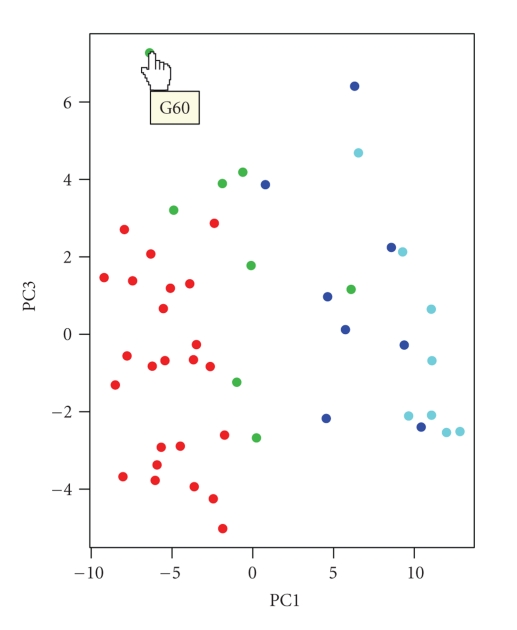
In general, principal component analysis (PCA) transforms the original data into a new system of orthogonal axes (components) with the first components covering the major variance in the data. Thus, looking at the projections of the data onto the first principal components often reveals intrinsic groups in the data. PCA is an unsupervised method and, thus, does not use any prior phenotypic knowledge for calculating the principal components. Principal components represent combinations of the original dimensions (metabolites), whose contributions to the component can give hints which metabolites separate intrinsic groups (if any) best. Please note that groups becoming apparent on a PCA plot do not necessarily correspond to phenotype classes, since PCA—as an unsupervised method—is only based on the metabolomics data matrix without using any phenotypic information on groups. The so-called loadings of the components are provided for download in table format (semicolon separated values). Before PCA analysis, metaP-server scales the original data to mean 0 and standard deviation 1 in order to make the concentrations of the metabolites comparable. The server shows the proportion of variance covered by the first ten principal components and plots for the projections of the data to the first three components. The user can color the data points (each representing a specific sample) by the categorical phenotypes uploaded (Figure 4). Moreover, each data point is cross-linked to a sample page describing the details for the respective sample and showing the sample barplot described previously. Typical representatives of specific phenotypic groups as well as extreme samples can thus be picked easily.
Figure 4.
Examples for output generated by metaP-server: PCA plot colored by phenotype.
3.2.3. Hypothesis Tests and Correlation Analysis
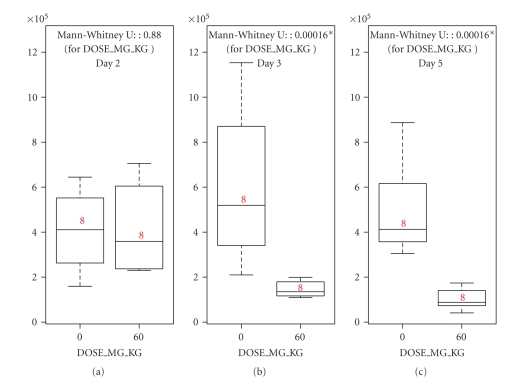
For testing the association of metabolite concentrations with categorical phenotypes, we use the Mann-Whitney nonparametric hypothesis test for two-class phenotypes and the non-parametric Kruskal-Wallis test for multi-class categorical phenotypes.For visualizing potential association, the server creates boxplots for the metabolite concentrations depending on the classes of the respective phenotype. The calculated P-values are given within the boxplots. With respect to the problem of multiple testing, only those metabolite-phenotype associations are marked as significant that show a P-value below the significance level after Bonferroni correction. Thereby “∗” denotes a significance level of 5% (after correction) and “∗∗” denotes a significant level of 1% (after correction). If the user provides only two phenotypes with categorical values, metaP-server additionally performs hypothesis tests for the first phenotype depending on the different classes of the second phenotype and vice versa (see Section 5 and Figure 5). For each phenotype column containing numeric values, metaP-server tests the correlation of the metabolite concentrations with the phenotypes using the non-parametric Kendall method. The resulting correlation coefficients are visualized in a heatmap showing negative association in red and positive correlations in green. P-values and correlation coefficients are provided for download in table format (semicolon separated values).
Figure 5.
Examples for output generated by metaP-server: boxplots produced for groupwise hypothesis tests applied to the data set from the walk-through example provided with metaP-server; the association between ophthalmate and drug dose is tested for each day of treatment separately producing three separated box plots.
3.2.4. Ratios
If the user has chosen the respective option, metaP-server calculates all-against-all metabolite concentration ratios (with logarithmic scaling). In this case, the server automatically tests for associations between all ratios and the phenotypes as described above. Using ratios instead of single metabolites can bring up new associations if the underlying metabolites are, for example, closely linked by occurring in the same pathway [5, 8].
3.2.5. Mapping Metabolites on KEGG Pathways
In the sample barplots, the metabolite quantities measured for a sample are shown relative (up/down) to the metabolites' mean derived from the complete uploaded data set. These relative concentrations can be mapped onto KEGG pathway maps by coloring the corresponding KEGG compounds red in case of metabolites with low concentration and green in case of metabolites with high concentration relative to their mean values.
3.2.6. Cross-References for Kit Metabolites
For AbsoluteIDQ data, detailed information on the kit metabolites including cross references to HMDB, LipidMaps, KEGG, PubChem, and CAS numbers are provided.
3.3. Implementation
The web-server is mainly based on Perl CGI scripts. For statistical analyses, we rely on the open source R-project (http://www.R-project.org). For coloring metabolites on KEGG pathway maps, we use the forms provided by KEGG.
4. Interpreting the Results
In order to illustrate how the results of metaP-server server analysis can be interpreted, we provide two walk-through examples from typical applications. (i) LC-MS/MS data (raw area counts) from a drug dosing study in liver tissue (Metabolon Inc., 2006). In this case, the phenotypes “(drug) dose”, “day”, “group”, and “weight” are provided. (ii) Human, mouse, and bovine plasma samples are measured using AbsoluteIDQ. Users can easily upload the example data files (via hyperlinks) onto the job submission page and rerun the examples at any time.
After completion of the processing, there are several starting points for exploring the data. The walk-through examples contain detailed descriptions of these starting points and of the analysis results produced by metaP-server. Here, we only highlight a few specific possibilities how the server can be used for data exploration in the first example. The user can, for instance, immediately check whether the concentrations of a specific metabolite shows the expected difference between the control group and the treated groups. For this purpose, the user can click on that metabolite in the metabolite overview and color the appearing barplot by the phenotype “groups” (Figure 2). Analogously, using PCA as a starting point, the user can check whether the grouping of samples in the PCA reflects the grouping given by the various uploaded phenotypes such as “(drug) dose” or “day” (Figure 4). The user can also pick a representative sample for a specific group and check immediately on the sample page which of the metabolites are up or down compared to other samples (Figure 3). These relative concentrations can also be automatically mapped onto KEGG pathway maps. The user can then screen the colored maps for situationswhere all metabolites downstream of a certain metabolite are red whereas the metabolites upstream are green. Hypothesis tests provided by the metaP-server server are another starting point for data exploration. In particular, tests performed for a phenotype separately for the different classes of a second phenotype can easily highlight effects that are otherwise only seen by using more sophisticated statistical methods. In the drug testing example, for instance, the metabolite ophthalmate is not significantly associated with the phenotype day when hypothesis testing is performed on complete data. However, in case of separated analysis as shown in Figure 5 the dependency of ophthalmate concentrations on the day of treatment for the group taking the drug becomes apparent. The concentration of ophthalmate is significantly increased at day three and day five for drug intake versus control whereas it is not significantly increased on day one.
5. Conclusion
The main objective of metaP-server is responding to the raising need for interpretation of high-throughput metabolomics data with respect to multiple sample phenotypes on an easy-to-use web-server-based platform, especially in the context of identifying metabolic biomarker for drug testing, therapy and diagnosis, and in epidemiological and metabolome wide association studies. metaP-server is mainly adapted to quantitative metabolomics data from kits and commercial platforms, such as Biocrates, Chenomx, Metabolon, and Phenomenome, but may also be used with any other metabolomics data set that is available in tabular format. The server has been developed in close cooperation with experimentalists and, as a result, focuses more on interactive and intuitive data exploration in the context of multiple multiclass phenotypes rather than on providing a large set of different statistical methods. Nonetheless, the spectrum of analysis tools implemented ranging from estimation of reproducibility and batch effects, hypothesis and correlation tests, PCA analysis, to pathway mapping still covers various types of typical approaches used in data analysis. Of particular interest for the community is probably the ability of metaP-server to directly analyze metabolite concentration ratios, which corresponds to a relatively high computational effort. Moreover, special emphasis has been put on the mapping of metabolite identifiers of the Biocrates AbsoluteIDQ kit to the major metabolomics databases. As the metabolomics community and the number of kits will increase, we intend to implement new features in close cooperation with the relevant parties.
Acknowledgments
The authors thank Jerzy Adamski and Cornelia Prehn from the Genome Analysis Center (GAC) at the Helmholtz Zentrum München and John Ryals and Mike Milburn from Metabolon Inc. (Durham, NC, USA) for providing metabolomics data. They also thank Jerzy Adamski, Julia Henrichs, Anna Artati, Katja Vohouk, Cornelia Prehn, Susanne Neschen, and Melanie Kahle for intensive testing the server and for many valuable suggestions and comments. This work was supported in part by a Grant from the German Federal Ministry of Education and Research (BMBF) to the German Center Diabetes Research (DZD e.V.), by BMBF Grant no. 03IS2061B (project Gani_Med), by BMBF Grant no. 0315494A (project SysMBo), and by Era-Net grant no. 0315442A (project PathoGenoMics). G. Kastenmüller and W. Römisch-Margl contributed equally to this work.
References
- 1.Nicholson JK, Connelly J, Lindon JC, Holmes E. Metabonomics: a platform for studying drug toxicity and gene function. Nature Reviews Drug Discovery. 2002;1(2):153–161. doi: 10.1038/nrd728. [DOI] [PubMed] [Google Scholar]
- 2.Fiehn O. Metabolomics—the link between genotypes and phenotypes. Plant Molecular Biology. 2002;48(1-2):155–171. [PubMed] [Google Scholar]
- 3.Bino RJ, Hall RD, Fiehn O, et al. Potential of metabolomics as a functional genomics tool. Trends in Plant Science. 2004;9(9):418–425. doi: 10.1016/j.tplants.2004.07.004. [DOI] [PubMed] [Google Scholar]
- 4.Hirai MY, Yano M, Goodenowe DB, et al. Integration of transcriptomics and metabolomics for understanding of global responses to nutritional stresses in Arabidopsis thaliana. Proceedings of the National Academy of Sciences of the United States of America. 2004;101(27):10205–10210. doi: 10.1073/pnas.0403218101. [DOI] [PMC free article] [PubMed] [Google Scholar]
- 5.Altmaier E, Ramsay SL, Graber A, Mewes H-W, Weinberger KM, Suhre K. Bioinformatics analysis of targeted metabolomics—uncovering old and new tales of diabetic mice under medication. Endocrinology. 2008;149(7):3478–3489. doi: 10.1210/en.2007-1747. [DOI] [PubMed] [Google Scholar]
- 6.Altmaier E, Kastenmüller G, Römisch-Margl W, et al. Variation in the human lipidome associated with coffee consumption as revealed by quantitative targeted metabolomics. Molecular Nutrition and Food Research. 2009;53(11):1357–1365. doi: 10.1002/mnfr.200900116. [DOI] [PubMed] [Google Scholar]
- 7.Gieger C, Geistlinger L, Altmaier E, et al. Genetics meets metabolomics: a genome-wide association study of metabolite profiles in human serum. PLoS Genet. 2008;4(11) doi: 10.1371/journal.pgen.1000282. Article ID e1000282. [DOI] [PMC free article] [PubMed] [Google Scholar]
- 8.Illig T, Gieger C, Zhai G, et al. A genome-wide perspective of genetic variation in human metabolism. Nature Genetics. 2010;42(2):137–141. doi: 10.1038/ng.507. [DOI] [PMC free article] [PubMed] [Google Scholar]
- 9.Sreekumar A, Poisson LM, Rajendiran TM, et al. Metabolomic profiles delineate potential role for sarcosine in prostate cancer progression. Nature. 2009;457(7231):910–914. doi: 10.1038/nature07762. [DOI] [PMC free article] [PubMed] [Google Scholar] [Research Misconduct Found]
- 10.Wood PL, Mankidy R, Ritchie S, et al. Circulating plasmalogen levels and Alzheimer disease assessment scale-cognitive scores in Alzheimer patients. Journal of Psychiatry & Neuroscience. 2010;35(1):59–62. doi: 10.1503/jpn.090059. [DOI] [PMC free article] [PubMed] [Google Scholar]
- 11.Shearer J, Duggan G, Weljie A, Hittel DS, Wasserman DH, Vogel HJ. Metabolomic profiling of dietary-induced insulin resistance in the high fat-fed C57BL/6J mouse. Diabetes, Obesity and Metabolism. 2008;10(10):950–958. doi: 10.1111/j.1463-1326.2007.00837.x. [DOI] [PMC free article] [PubMed] [Google Scholar]
- 12.Katajamaa M, Miettinen J, Orešič M. MZmine: toolbox for processing and visualization of mass spectrometry based molecular profile data. Bioinformatics. 2006;22(5):634–636. doi: 10.1093/bioinformatics/btk039. [DOI] [PubMed] [Google Scholar]
- 13.Suhre K, Schmitt-Kopplin P. MassTRIX: mass translator into pathways. Nucleic Acids Research. 2008;36, Web Server issue:W481–W484. doi: 10.1093/nar/gkn194. [DOI] [PMC free article] [PubMed] [Google Scholar]
- 14.Xia J, Bjorndahl TC, Tang P, Wishart DS. MetaboMiner—semi-automated identification of metabolites from 2D NMR spectra of complex biofluids. BMC Bioinformatics. 2008;9, article 507 doi: 10.1186/1471-2105-9-507. [DOI] [PMC free article] [PubMed] [Google Scholar]
- 15.Xia J, Psychogios N, Young N, Wishart DS. MetaboAnalyst: a web server for metabolomic data analysis and interpretation. Nucleic Acids Research. 2009;37, Web Server issue:W652–W660. doi: 10.1093/nar/gkp356. [DOI] [PMC free article] [PubMed] [Google Scholar]
- 16.Neuweger H, Albaum SP, Dondrup M, et al. MeltDB: a software platform for the analysis and integration of metabolomics experiment data. Bioinformatics. 2008;24(23):2726–2732. doi: 10.1093/bioinformatics/btn452. [DOI] [PubMed] [Google Scholar]
- 17.Wishart DS, Knox C, Guo AC, et al. HMDB: a knowledgebase for the human metabolome. Nucleic Acids Research. 2009;37, Database issue:D603–D610. doi: 10.1093/nar/gkn810. [DOI] [PMC free article] [PubMed] [Google Scholar]
- 18.Sud M, Fahy E, Cotter D, et al. LMSD: LIPID MAPS structure database. Nucleic Acids Research. 2007;35, Database issue:D527–D532. doi: 10.1093/nar/gkl838. [DOI] [PMC free article] [PubMed] [Google Scholar]
- 19.Kanehisa M, Goto S, Furumichi M, Tanabe M, Hirakawa M. KEGG forrepresentation and analysis of molecular networks involving diseases and drugs. Nucleic Acids Research. 2010;38, Database issue:D355–D360. doi: 10.1093/nar/gkp896. [DOI] [PMC free article] [PubMed] [Google Scholar]
- 20.Wang Y, Xiao J, Suzek TO, Zhang J, Wang J, Bryant SH. PubChem: a public information system for analyzing bioactivities of small molecules. Nucleic Acids Research. 2009;37, Web Server issue:W623–W633. doi: 10.1093/nar/gkp456. [DOI] [PMC free article] [PubMed] [Google Scholar]


