Abstract
Purpose
To investigate the feasibility of measuring myocardial T2 at 3 Tesla for assessment of tissue iron in thalassemia major and other iron overloaded patients.
Materials and Methods
A single-breathhold electrocardiogram-triggered black-blood multi-echo spin-echo (MESE) sequence with a turbo factor of 2 was implemented at 3 Tesla (T). Myocardial and liver T2 values were measured with three repeated breathholds in 8 normal subjects and 24 patients. Their values, together with the T2* values measured using a breathhold multi-echo gradient-echo sequence, were compared with those at 1.5T in the same patients.
Results
At 3T, myocardial T2 was found to be 39.6 ± 7.4 ms in normal subjects. In patients, it ranged from 12.9 to 50.1 ms. T2 and T2* were observed to correlate in heart (P = 0.93, P < 0.0001) and liver (P = 0.95, P < 0.0001). Myocardial T2 and T2* at 3T were also highly correlated with the 1.5T measurements. Preliminary results indicated that myocardial T2 quantitation was relatively insensitive to B1 variation, and reproducible with 3.2% intra-exam and 3.8% inter-exam variations.
Conclusion
Myocardial T2 quantitation is feasible at 3T. Given the substantially decreased T2* and increased B0 inhomogeneity, the rapid myocardial T2 measurement protocol demonstrated here may present a robust alternative to study cardiac iron overload at 3T.
Keywords: MRI, cardiac MR, heart, liver, T2, T2*, thalassemia, tissue iron, iron overload
Thalassemia, the most common monogenic disease, is caused by defective and imbalanced production of globin, the protein component of hemoglobin (1,2). Some severely affected individuals develop iron overload as a consequence of regular red blood cell transfusion. Progressive iron accumulation eventually produces potentially lethal injury in the heart, liver, pancreas, and other organs; overall, approximately 67% of patients with thalassemia major die of heart disease (3). Chelating agents being able to bind the excess iron and promote its excretion have been developed, but reliable means to evaluate the effectiveness of treatment are urgently needed because repeated biopsies of liver and heart are not practical clinically (4,5).
In the past decade, considerable efforts have been made to develop MRI as a safe, noninvasive, reliable, and quantitative means of measuring tissue iron in various patients with iron overload (6–12). The application of the MR transverse relaxation times T2* and T2 (or the corresponding rates R2* = 1/T2* and R2 = 1/T2) has been successfully demonstrated by several groups for quantitative assessment of the iron concentration in the heart and liver, and mainly at low magnetic field strength (1.5 Tesla [T] or less) (7–9,12–19). T2* measurement can be routinely performed with a single-breathhold multi-echo gradient echo (MEGE) acquisition. However, it is known to be more sensitive to static magnetic field (B0) inhomogeneity and susceptibility effects from the lung–heart interface (20) and possibly the boundaries of cardiac veins (21). Clinically, T2* measurement of myocardial iron is presently the gold standard for monitoring and adjusting chelation in thalassemia patients. In comparison, reliable measurement of myocardial T2 often requires long image acquisition time with single spin-echo (SE) sequences (12). More recent development includes the use of respiratory-navigated free-breathing multi-echo spin-echo (MESE) or accelerated single-breathhold MESE acquisitions (14,15,22,23).
With a signal-to-noise ratio (SNR) increase and several other technical improvements, 3T MRI has become an increasingly available and accepted platform for routine clinical investigations and services. However, quantitative cardiac MR at 3T is technically challenging, in part because of substantially increased B0 and B1 inhomogeneity and specific absorption rate (SAR) (24–28). In a recent study, T2* has been investigated and calibrated against liver iron concentration from liver biopsies at 3T (29). However, T2* decreases substantially at 3T, thereby making it difficult to measure the heart and liver T2* reliably in patients with severe iron overload. Although a previous study has shown that T2 is a highly specific index for iron deposition (30), quantitation of myocardial T2 at 3T has not been reported so far in either normal subjects or patients with thalassemia major and other transfusion-related hemosiderosis.
In this study, we aimed to investigate the feasibility of quantifying myocardial T2 at 3T in thalassemia and iron overloaded patients using a single-breathhold MESE sequence. Both T2 and T2* measurements at 3T were compared with those obtained at 1.5T in the same patients.
MATERIALS AND METHODS
3T MRI Protocol
A single-breathhold electrocardiogram (ECG) -triggered spin-echo sequence was implemented to map myocardial T2 on a 3T MRI scanner (Philips Achieva) with a six-channel cardiac coil. It was an accelerated MESE sequence (14,23) with a turbo factor of 2, partial Fourier and sensitivity encoding (SENSE) acquisition, permitting single-slice multi-echo T2 mapping within a single end-expiratory breathhold (~ 15 cardiac cycles). In brief, 2 k-space lines were acquired per TR (= 1 cardiac cycle) for each effective echo time. Both the first echo time and the echo spacing (between adjacent echoes) were chosen to be 5 ms. They were largely limited by the minimum duration of the selective 180° radio-frequency (RF) pulse, which was in turn limited by the maximum B1 of 13.5 μT (associated with 25 kW peak RF power) for body RF transmission. With turbo factor of 2 and an odd echo occupying the central k-space line, the first effective echo time (TE) was 5 ms and subsequent effective inter-echo spacing 10 ms. The total echo numbers were limited by the maximum allowable SAR and heart rates. Typically, they ranged from 10 to 12 (i.e., 5 to 6 echo images accordingly) for normal subjects and 8 to 12 for patients. Other parameters were acquisition matrix = 128 × 96, SENSE factor = 2, partial Fourier factor = 0.6, repetition time (TR) = 750–1200 ms, field of view (FOV) = 370–400 mm (dependent on patient size), and slice thickness = 10 mm for 90° excitation. Slice thickness of 30 mm was chosen for 180° refocusing to minimize the stimulated echo effects (31,32). ECG trigger delay was set to the late diastole to minimize the effect of cardiac wall motion. A double-inversion black-blood technique was incorporated to reduce flow artifact and enhance left ventricular (LV) wall delineation (14,33,34). To achieve minimum TE, a 1.97-ms 90° self-refocusing excitation pulse was used together with a 1.52-ms 180° refocusing pulse. Gradient crushers were applied around each refocusing pulse along all three directions with 0.68-ms duration and intra-voxel phase dispersion of 8.5 π (35) along each direction. The slice was positioned to cover the short-axis LV view at mid-ventricular level, which also included part of the liver. Before T2 mapping, B0 shimming was performed in a three-dimensional (3D) volume covering the whole heart region. To improve the T2 measurement precision, the single-breathhold acquisition described above was repeated three times at the same slice location during each exam for each subject. The three repeated trials or measurements were analyzed to obtain the average myocardial and liver T2.
T2* mapping was also performed in the same imaging slice using a ECG-triggered multi-echo MEGE sequence (13) with a single end-expiratory breathhold (~9 cardiac cycles). Relevant imaging parameters were echo number = 25, flip angle = 20°, turbo field echo factor = 4, and black-blood preparation. For normal subjects, the first TE and subsequent echo spacing were set to 3 ms and 2 ms, respectively. For patients, they were 1.56–2 ms and 1–2 ms, respectively, depending on the severity of iron overload in heart.
Analysis Procedure
For analysis, a region of interest (ROI) was placed within the interventricular septum and within the liver. For the liver, regions with large blood vessels were excluded from the ROI. T2 and T2* values were calculated by nonlinear curve fitting of the ROI signals to a mono-exponential model with floating baseline noise (36,37) using a customized software programmed in Matlab (The MathWorks, Inc., Natick, MA). To quantify T2, identical heart or liver ROIs were used to analyze the three single-breathhold acquisitions but with slight position adjustments to account for the motion between the three breathholds. The mean T2 values were then calculated from the three measurements.
MRI Data Acquisitions
The MESE T2 mapping sequence was first used to quantify the T2 value in the 2% agarose gel phantoms with varying MnCl2 concentrations (0 to 1 mM with 0.1 mM increments). The sequence parameters were FOV = 240 mm, thickness = 10 mm and TR = 1 s with one repetition only.
Before patient study, eight normal subjects (23–31 years with mean age 25.8 ± 2.9 years) were scanned to measure normal myocardial T2. To assess the measurement reproducibility, T2 values were measured in two of eight normal subjects on 3 different days within 1 week. To examine the effect of B1 inhomogeneity on myocardial T2 quantitation, one subject was scanned with six different flip angle sets by using six RF calibration scaling factors (0.7, 0.8, 0.9, 1.0, 1.1, and 1.2, respectively, with 1.0 corresponding to the automatic scanner calibration based on the total MR signal within the imaging slice).
A total of 24 patients (14–73 years old; mean age, 38.0 ± 15.6 years) with varying levels of iron overload, including 11 thalassemia major, 3 myelodysplasia/aplastic anemia, and 10 post-bone marrow transplant cases, were studied together with 2 normal subjects for myocardium and liver T2 and T2*. To minimize inter-subject and intra-subject variation, all subjects were trained for the end-expiratory breathhold procedure before MRI data acquisition.
These 24 patients were serially assessed in previously reported studies in which all their myocardium and liver T2*, liver T2, and most myocardium T2 values were determined on a 1.5T Siemens scanner using similar single-breathhold MESE and MEGE sequences (15,38–40). The cases were chosen to cover a wide range of iron overload. In brief, the turbo MESE sequence involved the following key parameters: 36 echoes with a turbo factor of 3; single breathhold time of ~18 s; acquisition matrix, 64 × 128; nonselective 180° refocusing pulse; and crusher gradients along the slice selection and phase encoding directions only. For the heart T2* measurement, the MEGE had flip angle = 20°, slice thickness = 10 mm, image matrix = 256 × 128, the first TE = 2.6 ms, echo spacing = 2.02 ms, echo number = 8, FOV = 400 mm, and one breathhold of 18 s (8). For the liver, the MEGE had flip angle = 20°, slice thickness = 10 mm, image matrix = 128 × 128, the first TE = 1.07 ms, echo spacing = 0.76 ms, echo number = 20, FOV = 360 mm, and one breathhold of 13 s (8). Note that the time lapses between the 1.5T and 3T scans ranged from 59 to 176 days with a mean of 97 ± 29.9 days for the 24 patients studied. For the 11 thalassemia major and 2 myelodysplasia cases, the interval stable treatments consisted of regular transfusion (2 to 3 units red cell per month) and daily chelation (deferoxamine: n = 4; deferiprone: n = 4; deferoxamine and deferiprone combination: n = 4; and deferasirox: n = 1), and there was no major fluctuation in ferritin levels between the two scans. The other 11 patients had no transfusion or chelation between the two scans.
RESULTS
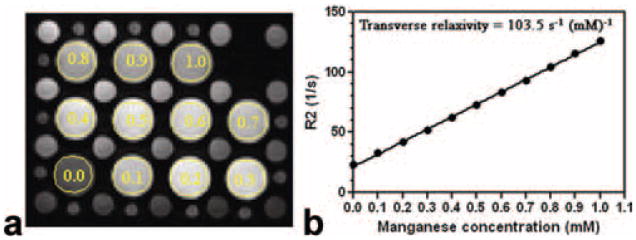
Figure 1 shows that relaxation rate R2 (=1/T2) value increased linearly with MnCl2 concentration in the gel phantoms (R = 0.999 and P < 0.0001), indicating the robustness of T2 measurement by the turbo MESE protocol. Multi-echo images were typically seen free of artifacts. The transverse relaxivity was measured as 103.5 s−1mM−1 at 3T in contrast to 73.6 s−1mM−1 previously reported for 1.5T (12) for aqueous MnCl2.
Figure 1.
a: First echo MESE image acquired by the single-breathhold T2 (=1/R2) mapping sequence. b: Relationship between the measured R2 values and MnCl2 concentrations. The 11 large phantom tubes contain varying MnCl2 concentrations from 0 to 1 mM with 0.l mM increment, as indicated by the legends. Measurement ROIs are also shown. Linear dependency was clearly seen with R = 0.999 (P < 0.0001).
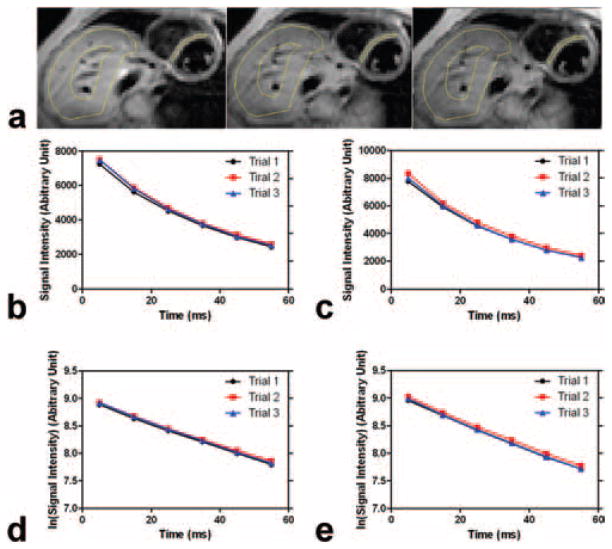
Figure 2a illustrates the representative MESE images from three consecutive acquisitions (i.e., three trials with three different breathholds during a single MRI exam) in one patient. Figure 2b,c shows the corresponding signal intensities with echo time in the septal myocardium and liver ROIs, respectively, demonstrating excellent monoexponential decay behavior and reproducibility among three trials or measurements during the MRI exam. Note that the zigzag decay often observed by traditional MESE CPMG (Carr-Purcell Meiboom-Gill) sequences was absent here because both odd echo and the following even echo were combined (i.e., turbo factor = 2) with the central k-space line occupied by an odd echo.
Figure 2.
a: First echo MESE images acquired during the three consecutive breathholds or trials from an iron overloaded patient. Heart and liver measurement ROIs are delineated in yellow. b: Corresponding echo signal decays in the septal myocardium. c: Corresponding echo signal decays in the liver. d,e: Echo signal decays are also plotted in logarithmic scale in the septal myocardium (d) and liver (e). Note that liver ROI is typically chosen to exclude large blood vessels.
The reproducibility of the data acquired from the two normal subjects was analyzed for inter-trial or intra-exam variation among the three repeats (during the same exam) and inter-exam variation among the three exams performed on different days. The results are shown in Figure 3. The intra-exam T2 peak-to-peak variations were 2.6 ± 1.3% and 3.7 ± 2.5%, respectively, for the two subjects. Their inter-exam peak-to-peak variations were 3.1% and 4.4%, respectively. Thus the mean peak-to-peak intra-exam and inter-exam variations were 3.2% and 3.8%, respectively. Although limited, these results demonstrated a reasonable reproducibility in myocardial T2 measurements.
Figure 3.
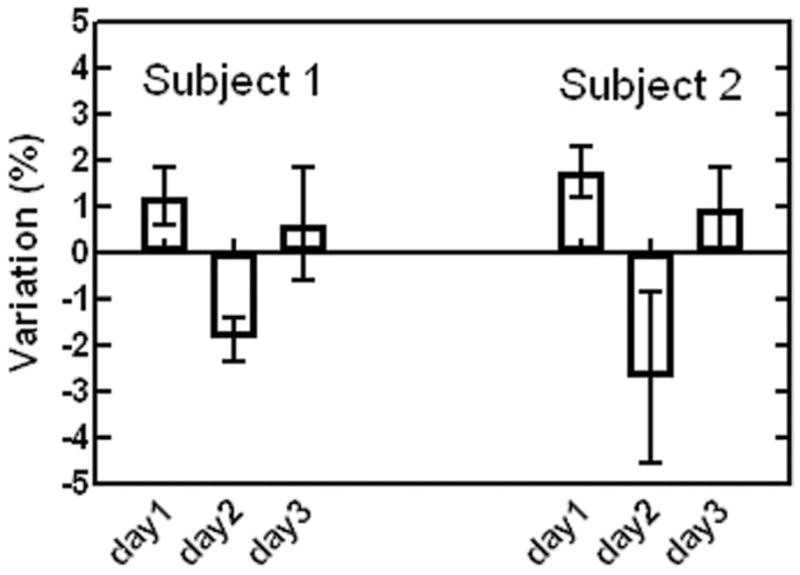
Myocardial T2 measurement reproducibility observed in two normal subjects. Intra-exam variations among the three repeats (during the same exam) and inter-exam variations among the three exams (performed on different days within a week) are shown.
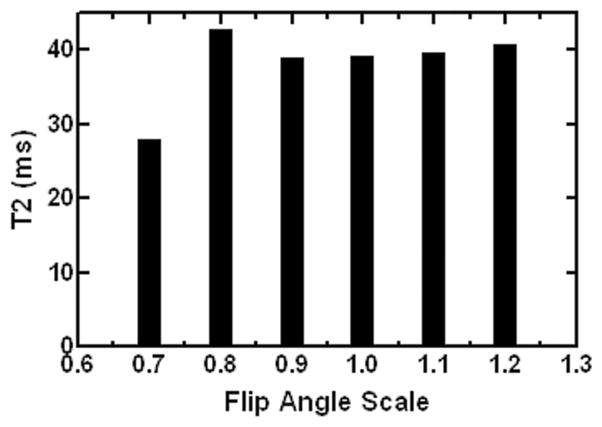
Figure 4 shows the effect of varying B1 on myocardial T2 quantitation in one normal subject. Different flip angle sets or B1 scaling factors led to substantial variations in T2 measurements, which was likely due to the increased contribution and interference from stimulated echoes in MESE signal decays. However, the peak-to-peak T2 variation was seen to be small and within 4.8% for B1 scaling between 0.9 and 1.2 (and within 9.4% for 0.8–1.2). This finding suggested that B1 inhomogeneity, particularly the underflipping reported in myocardium at 3T (25,28), may have limited effect on the myocardial T2 quantitation using the specific protocol in the current study.
Figure 4.
Measured myocardial T2 values versus the different RF flip angle scaling factors (with 1.0 corresponding to the automatic scanner calibration based on the total MR signal within imaging slice).
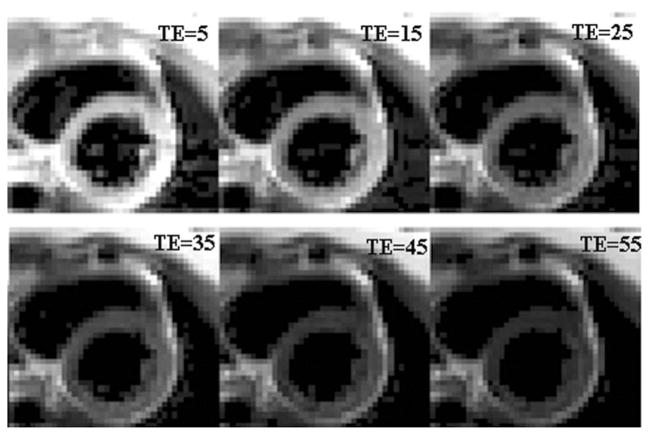
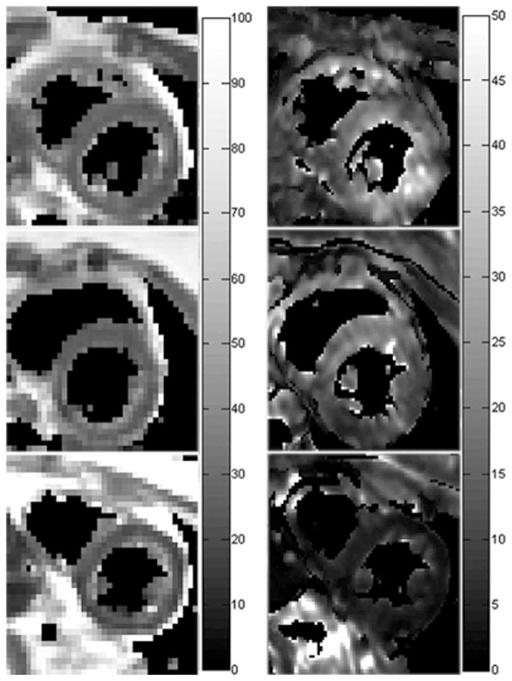
Figure 5 shows the representative MESE images from a patient with mild iron overload, exhibiting no apparent image artifacts. The T2 and T2* maps from this patient, and those from a normal subject and a patient with severe iron overload are shown in Figure 6.
Figure 5.
Representative MESE heart images observed in a patient with mild iron overload. Echo time (TE) is given in ms. The corresponding T2 map is shown in Figure 6.
Figure 6.
Typical T2 (left column) and T2* (right column) maps from a normal subject (top row), and patients with mild (middle row) and severe (bottom row) iron overload in heart. Display grayscales have a unit of ms.
The average myocardial T2 was found to be 39.6 ± 7.4 ms among the eight normal subjects studied. The average coefficient of variation (CV) of the three repeated measurements was 4.6%. The average myocardial T2* was 32.7 ± 3.6 ms in the two normal subjects examined, consistent with that (33.3 ± 4.0 ms) previously reported at 3T (29).
Among the 24 iron overloaded patients recruited for this study, T2* value could not be reliably determined with the 3T T2* protocol in certain severely iron overloaded patients with T2* < 2 ms (heart, n = 6; liver, n = 8). Among the analyzable cases, the myocardial T2 ranged from 12.9 ms to 50.1 ms (mean, 31.9 ± 13.4 ms), and T2* ranged from 2.7 ms to 41.7 ms (mean 17.3 ± 12.0 ms). For liver, T2 and T2* ranges were found to be 10.4–32.3 ms (mean 17.6 ± 6.8 ms) and 1.2–7.4 ms (mean 3.5 ± 2.0 ms), respectively. The average CV of the 3 repeated measurements was 8.8% and 2.4% for the heart and liver T2, respectively.
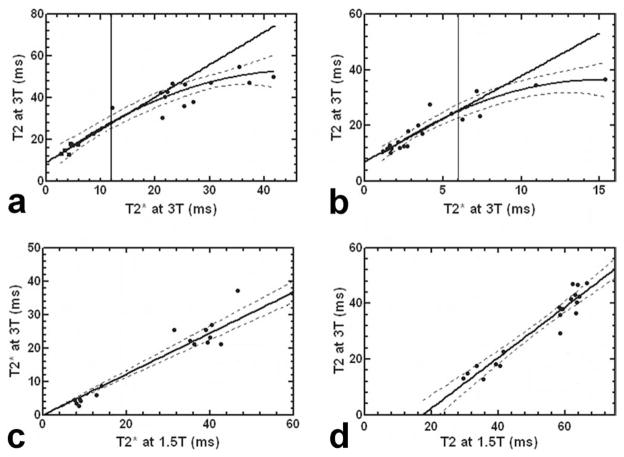
Figure 7a,b shows the relationship between T2 and T2* at 3T in heart and liver, respectively. Without assuming the distribution of the measurements, Spearman-rho analysis revealed high correlations between T2 and T2* measurements with P = 0.93 (P < 0.0001) and P = 0.95 (P < 0.0001) for heart and liver, respectively. For the heart, all measurement points were found to fit well to a quadratic curve (R = 0.95). In addition, linear fitting was performed for the patients with T2* ≤ 12 ms, yielding a T2 over T2* slope of 1.56 ± 0.35 (R = 0.89) as shown by the straight line in Figure 7a. Similarly, all liver measurements were found to fit the curvilinear line well with R = 0.94. Within an arbitrarily chosen range of T2* ≤ 6 ms, liver T2 and T2* were found to correlate linearly with a slope of 3.12 ± 0.56 (R = 0.85) as shown in Figure 7b. Figure 7c plots the 3T T2* versus 1.5T T2* in heart, showing a linear correlation with a slope of 0.61 ± 0.03 (R = 0.95) and zero intercept. As shown in Figure 7d, T2 measurements at two field strengths exhibited a close correlation by Spearman-rho analysis with P = 0.91 (P < 0.0001). Linear fitting was also performed, yielding a slope of 0.91 ± 0.06 (R = 0.96).
Figure 7.
a: Myocardial T2* and T2 at 3T in 18 iron overloaded patients and 2 normal subjects. b: Liver T2* versus T2 in 16 patients and 2 normal subjects. c: The 3T T2* versus 1.5T T2* in heart in 18 patients. d: The 3T T2 versus 1.5T T2 in heart in 19 patients. The dashed lines indicate the 95% limits.
DISCUSSION
In this study, we measured the myocardium and liver T2 by using a black-blood single-breathhold accelerated MESE sequence in both normal volunteers and patients with varying iron overloads. Myocardium T2 at 3T was documented for the first time. The myocardial T2 quantitation was largely reproducible in two volunteers studied on different days. It was also observed to be relatively robust in the presence of the B1 variations (up to ±20%) with the specific T2 measurement protocol used in this study.
Myocardial T2 values were successfully measured at 3T in 24 iron overloaded patients with varying levels of iron overloads in heart. For both heart and liver, a quadratic relationship between T2 and T2* was observed across the entire range, while it was mostly linear for small T2 and T2* values. Such correlations were qualitatively similar to those reported in a recent 1.5T study where myocardial T2 and T2* were quantified in a large population of thalassemia patients (41). More importantly, it demonstrated the strong and linear correlation between T2* and T2 in iron overloaded hearts at 3T with T2* ≤ 12 ms. Note that this threshold of 12 ms was chosen to include the iron overloaded hearts based on a 1.5T T2* threshold for heart iron overload previously determined (20 ms) (7,41) and the 3T T2* over 1.5T T2* slope measured in the current study (Fig. 7c). At 3T, myocardial T2* dramatically shortened by approximately 40%, which was largely consistent with a recent study (~44%) using a breathhold bright-blood MEGE sequence (29). Such reduction in T2* makes it technically challenging to use T2* as an iron overload index at 3T where the shortest echo time and echo spacing can be limited by the peak RF power and gradient strength. In the current study, myocardial T2* was too short to be reliably determined in six patients with severe iron overload using the first echo time 1.56 ms and echo spacing 1.0 ms. Note that both the first echo time and echo spacing could potentially be optimized by use of short self-refocusing RF pulse and high sampling bandwidth at expense of high gradient strength requirement, SNR reduction and slice profile degradation. Furthermore, as shown in Figure 6, T2* maps were generally observed to be more inhomogeneous than the corresponding T2 maps. Although uneven iron deposition in myocardium has been reported in several biopsy and autopsy studies (42,43), this discrepancy in uniformity more likely resulted from the increased susceptibility- and shimming-related T2* effects in the region, underscoring the challenge facing the myocardial T2* mapping at 3T.
In this study, myocardial T2 at 3T in normal subjects was found to decrease by approximately 30% compared with that (56.9 ± 8.4 ms) reported for 1.5T (14). Among the patients studied, T2 values at 3T were found to be much lower than their 1.5T values, particularly in patients with iron overload in the heart (see Fig. 7d). In addition, an approximately linear correlation was observed between these 3T and 1.5T T2 values but with a large and negative intercept. Note that it remains unclear from the current study whether 3T can produce more reliable myocardial T2 measurement. Single-breathhold acquisition is known to provide more accurate and reproducible measurement than free-breathing acquisition because of its much reduced vulnerability to motion. SNR increase at 3T can facilitate the acceleration of breathhold acquisition sequence by use of large SENSE factor and half-Fourier sampling as demonstrated in the current study. Such reduction of breathhold time can be a major advantage in patient study, likely leading to more patient comfort and reliable measurements at 3T. On the other hand, T2 shortening at 3T decreases SNR. The B1 inhomogeneity in the heart region can potentially compromise myocardial T2 quantitation. Furthermore, the substantially increased SAR at 3T limits the maximum number of RF echoes and slices per acquisition.
In conclusion, we demonstrated the feasibility of measuring myocardial T2 at 3T for the first time in both normal subjects and iron overloaded patients. We investigated the myocardial and liver T2, together with T2*. The results demonstrated close correlations between 3T and 1.5T measurements, indicating that myocardial and liver T2 can be measured at 3T as an indicator for iron overload. Because T2* at high field decreases substantially and its quantitation is vulnerable to increased B0 inhomogeneity, the rapid myocardial T2 measurement protocol demonstrated in this study can constitute a robust alternative to the traditional T2* measurement for assessment of cardiac iron overload at 3T. To fulfill this promise, large-scale, multicenter and serial measurements of cardiac T2 using 3T scanners with this protocol and correlation with clinical features and treatment outcomes are needed.
Acknowledgments
The authors thank Ms. Amanda Mok for patient recruitment.
Contract grant sponsor: Hong Kong Research Grant Council; Contract grant number: CRF7794/07M; Contract grant sponsor: Hong Kong Children Thalassaemia Foundation; Contract grant number: 2007/02; Contract grant sponsor: National Institutes of Health; Contract grant number: R01-DK069373; Contract grant number: R01-DK066251; Contract grant number: R37-DK049108; Contract grant number: R01-DK049108; Contract grant sponsor: American Heart Association; Contract grant number: 0730143N.
References
- 1.Mentzer WC, Kan YW. Prospects for research in hematologic disorders: sickle cell disease and thalassemia. JAMA. 2001;285:640–642. doi: 10.1001/jama.285.5.640. [DOI] [PubMed] [Google Scholar]
- 2.Tuzmen S, Schechter AN. Genetic diseases of hemoglobin: diagnostic methods for elucidating beta-thalassemia mutations. Blood Rev. 2001;15:19–29. doi: 10.1054/blre.2001.0147. [DOI] [PubMed] [Google Scholar]
- 3.Borgna-Pignatti C, Rugolotto S, De Stefano P, et al. Survival and complications in patients with thalassemia major treated with transfusion and deferoxamine. Haematologica. 2004;89:1187–1193. [PubMed] [Google Scholar]
- 4.Brittenham GM, Griffith PM, Nienhuis AW, et al. Efficacy of deferoxamine in preventing complications of iron overload in patients with thalassemia major. N Engl J Med. 1994;331:567–573. doi: 10.1056/NEJM199409013310902. [DOI] [PubMed] [Google Scholar]
- 5.Brittenham GM, Badman DG. Noninvasive measurement of iron: report of an NIDDK workshop. Blood. 2003;101:15–19. doi: 10.1182/blood-2002-06-1723. [DOI] [PubMed] [Google Scholar]
- 6.Bonkovsky HL, Rubin RB, Cable EE, Davidoff A, Rijcken TH, Stark DD. Hepatic iron concentration: noninvasive estimation by means of MR imaging techniques. Radiology. 1999;212:227–234. doi: 10.1148/radiology.212.1.r99jl35227. [DOI] [PubMed] [Google Scholar]
- 7.He T, Gatehouse PD, Smith GC, Mohiaddin RH, Pennell DJ, Firmin DN. Comparing myocardial T2* and T2 measurements in thalassemia patients. Proceedings of the 16th Annual Meeting of ISMRM; Toronto. 2008. (abstract 1014) [Google Scholar]
- 8.Lam WW, Au WY, Chu WC, Tam S, Ha SY, Pennell DJ. One-stop measurement of iron deposition in the anterior pituitary, liver, and heart in thalassemia patients. J Magn Reson Imaging. 2008;28:29–33. doi: 10.1002/jmri.21433. [DOI] [PubMed] [Google Scholar]
- 9.Westwood MA, Anderson LJ, Firmin DN, et al. Interscanner reproducibility of cardiovascular magnetic resonance T2* measurements of tissue iron in thalassemia. J Magn Reson Imaging. 2003;18:616–620. doi: 10.1002/jmri.10396. [DOI] [PubMed] [Google Scholar]
- 10.Jensen PD. Evaluation of iron overload. Br J Haematol. 2004;124:697–711. doi: 10.1111/j.1365-2141.2004.04838.x. [DOI] [PubMed] [Google Scholar]
- 11.Wang ZJ, Lian L, Chen Q, Zhao H, Asakura T, Cohen AR. 1/T2 and magnetic susceptibility measurements in a gerbil cardiac iron overload model. Radiology. 2005;234:749–755. doi: 10.1148/radiol.2343031084. [DOI] [PubMed] [Google Scholar]
- 12.St Pierre TG, Clark PR, Chuaanusorn W, et al. Noninvasive measurement and imaging of liver iron concentrations using proton magnetic resonance. Blood. 2005;105:855–861. doi: 10.1182/blood-2004-01-0177. [DOI] [PubMed] [Google Scholar]
- 13.Westwood M, Anderson LJ, Firmin DN, et al. A single breath-hold multiecho T2* cardiovascular magnetic resonance technique for diagnosis of myocardial iron overload. J Magn Reson Imaging. 2003;18:33–39. doi: 10.1002/jmri.10332. [DOI] [PubMed] [Google Scholar]
- 14.He T, Gatehouse PD, Anderson LJ, et al. Development of a novel optimized breathhold technique for myocardial T2 measurement in thalassemia. J Magn Reson Imaging. 2006;24:580–585. doi: 10.1002/jmri.20681. [DOI] [PubMed] [Google Scholar]
- 15.He T, Kirk P, Firmin DN, et al. Multi-center transferability of a breath-hold T2 technique for myocardial iron assessment. J Cardiovasc Magn Reson. 2008;10:11. doi: 10.1186/1532-429X-10-11. [DOI] [PMC free article] [PubMed] [Google Scholar]
- 16.Pepe A, Positano V, Santarelli MF, et al. Multislice multiecho T2* cardiovascular magnetic resonance for detection of the heterogeneous distribution of myocardial iron overload. J Magn Reson Imaging. 2006;23:662–668. doi: 10.1002/jmri.20566. [DOI] [PubMed] [Google Scholar]
- 17.Ghugre NR, Enriquez CM, Coates TD, Nelson MD, Jr, Wood JC. Improved R2* measurements in myocardial iron overload. J Magn Reson Imaging. 2006;23:9–16. doi: 10.1002/jmri.20467. [DOI] [PMC free article] [PubMed] [Google Scholar]
- 18.Wood JC, Enriquez C, Ghugre N, et al. MRI R2 and R2* mapping accurately estimates hepatic iron concentration in transfusion-dependent thalassemia and sickle cell disease patients. Blood. 2005;106:1460–1465. doi: 10.1182/blood-2004-10-3982. [DOI] [PMC free article] [PubMed] [Google Scholar]
- 19.Anderson LJ, Holden S, Davis B, et al. Cardiovascular T2-star (T2*) magnetic resonance for the early diagnosis of myocardial iron overload. Eur Heart J. 2001;22:2171–2179. doi: 10.1053/euhj.2001.2822. [DOI] [PubMed] [Google Scholar]
- 20.Atalay MK, Poncelet BP, Kantor HL, Brady TJ, Weisskoff RM. Cardiac susceptibility artifacts arising from the heart-lung interface. Magn Reson Med. 2001;45:341–345. doi: 10.1002/1522-2594(200102)45:2<341::aid-mrm1043>3.0.co;2-q. [DOI] [PubMed] [Google Scholar]
- 21.Reeder SB, Faranesh AZ, Boxerman JL, McVeigh ER. In vivo measurement of T*2 and field inhomogeneity maps in the human heart at 1.5 T. Magn Reson Med. 1998;39:988–998. doi: 10.1002/mrm.1910390617. [DOI] [PMC free article] [PubMed] [Google Scholar]
- 22.Sheth S, Tang H, Jensen JH, et al. Methods for noninvasive measurement of tissue iron in Cooley’s anemia. Ann N Y Acad Sci. 2005;1054:358–372. doi: 10.1196/annals.1345.044. [DOI] [PubMed] [Google Scholar]
- 23.Kim D, Jensen JH, Wu EX, Sheth SS, Brittenham GM. Breathhold multiecho fast spin-echo pulse sequence for accurate R2 measurement in the heart and liver. Magn Reson Med. 2009 doi: 10.1002/mrm.22047. (in press) [DOI] [PMC free article] [PubMed] [Google Scholar]
- 24.Noeske R, Seifert F, Rhein KH, Rinneberg H. Human cardiac imaging at 3 T using phased array coils. Magn Reson Med. 2000;44:978–982. doi: 10.1002/1522-2594(200012)44:6<978::aid-mrm22>3.0.co;2-9. [DOI] [PubMed] [Google Scholar]
- 25.Cunningham CH, Pauly JM, Nayak KS. Saturated double-angle method for rapid B1+ mapping. Magn Reson Med. 2006;55:1326–1333. doi: 10.1002/mrm.20896. [DOI] [PubMed] [Google Scholar]
- 26.Singerman RW, Denison TJ, Wen H, Balaban RS. Simulation of B1 field distribution and intrinsic signal-to-noise in cardiac MRI as a function of static magnetic field. J Magn Reson. 1997;125:72–83. doi: 10.1006/jmre.1996.1073. [DOI] [PubMed] [Google Scholar]
- 27.Schmitt M, Feiweier T, Voellmecke E, Lazar R, Krueger G, Reykowski A. B1-Homogenization in abdominal imaging at 3T by means of coupling coils. Proceedings of the 13th Annual Meeting of ISMRM; Miami. 2005. (abstract 331) [Google Scholar]
- 28.Sung K, Nayak KS. Measurement and characterization of RF nonuniformity over the heart at 3T using body coil transmission. J Magn Reson Imaging. 2008;27:643–648. doi: 10.1002/jmri.21253. [DOI] [PubMed] [Google Scholar]
- 29.Storey P, Thompson AA, Carqueville CL, Wood JC, de Freitas RA, Rigsby CK. R2* imaging of transfusional iron burden at 3T and comparison with 1.5T. J Magn Reson Imaging. 2007;25:540–547. doi: 10.1002/jmri.20816. [DOI] [PMC free article] [PubMed] [Google Scholar]
- 30.Clark PR, Chua-Anusorn W, St Pierre TG. Proton transverse relaxation rate (R2) images of liver tissue; mapping local tissue iron concentrations with MRI [corrected] Magn Reson Med. 2003;49:572–575. doi: 10.1002/mrm.10378. [DOI] [PubMed] [Google Scholar]
- 31.Pell GS, Briellmann RS, Waites AB, Abbott DF, Lewis DP, Jackson GD. Optimized clinical T2 relaxometry with a standard CPMG sequence. J Magn Reson Imaging. 2006;23:248–252. doi: 10.1002/jmri.20490. [DOI] [PubMed] [Google Scholar]
- 32.Sarlls JE, Pierpaoli C. Diffusion-weighted radial fast spin-echo for high-resolution diffusion tensor imaging at 3T. Magn Reson Med. 2008;60:270–276. doi: 10.1002/mrm.21639. [DOI] [PMC free article] [PubMed] [Google Scholar]
- 33.Greenman RL, Shirosky JE, Mulkern RV, Rofsky NM. Double inversion black-blood fast spin-echo imaging of the human heart: a comparison between 1.5T and 3.0T. J Magn Reson Imaging. 2003;17:648–655. doi: 10.1002/jmri.10316. [DOI] [PubMed] [Google Scholar]
- 34.He T, Gatehouse PD, Kirk P, et al. Black-blood T2* technique for myocardial iron measurement in thalassemia. J Magn Reson Imaging. 2007;25:1205–1209. doi: 10.1002/jmri.20929. [DOI] [PubMed] [Google Scholar]
- 35.Hennig J. Multiecho sequences with low refocusing flip angles. J Magn Reson. 1988;78:397–407. [Google Scholar]
- 36.Gossuin Y, Muller RN, Gillis P, Bartel L. Relaxivities of human liver and spleen ferritin. Magn Reson Imaging. 2005;23:1001–1004. doi: 10.1016/j.mri.2005.10.009. [DOI] [PubMed] [Google Scholar]
- 37.He T, Gatehouse PD, Kirk P, Mohiaddin RH, Pennell DJ, Firmin DN. Myocardial T(*)2 measurement in iron-overloaded thalassemia: an ex vivo study to investigate optimal methods of quantification. Magn Reson Med. 2008;60:350–356. doi: 10.1002/mrm.21625. [DOI] [PubMed] [Google Scholar]
- 38.Au WY, Lam WW, Chu WW, Tam S, Wong WK, Penell DJ. A magnetic resonance imaging (MRI) study of iron overload in haemopoietic stem cell transplantation recipients with increased ferritin levels. Transplant Proc. 2007;39:3369–3374. doi: 10.1016/j.transproceed.2007.09.027. [DOI] [PubMed] [Google Scholar]
- 39.Au W, Lam W, Chu W, et al. A pilot MRI study of organ specific hemosiderosis and functional correlation in Chinese patients with myelodysplasia and aplastic anemia with raised ferritin levels. Hematol Oncol. 2008;26:225–228. doi: 10.1002/hon.862. [DOI] [PubMed] [Google Scholar]
- 40.Au WY, Lam WW, Chu WW, et al. A cross-sectional magnetic resonance imaging assessment of organ specific hemosiderosis in 180 thalassemia major patients in Hong Kong. Haematologica. 2008;93:784–786. doi: 10.3324/haematol.12367. [DOI] [PubMed] [Google Scholar]
- 41.He T, Smith GC, Gatehouse PD, Mohiaddin RH, Firmin DN, Pennell DJ. On using T2 to assess extrinsic magnetic field inhomogeneity effects on T(2)* measurements in myocardial siderosis in thalassemia. Magn Reson Med. 2008;61:501–506. doi: 10.1002/mrm.21874. [DOI] [PubMed] [Google Scholar]
- 42.Fitchett DH, Coltart DJ, Littler WA, et al. Cardiac involvement in secondary haemochromatosis: a catheter biopsy study and analysis of myocardium. Cardiovasc Res. 1980;14:719–724. doi: 10.1093/cvr/14.12.719. [DOI] [PubMed] [Google Scholar]
- 43.Ghugre NR, Enriquez CM, Gonzalez I, Nelson MD, Jr, Coates TD, Wood JC. MRI detects myocardial iron in the human heart. Magn Reson Med. 2006;56:681–686. doi: 10.1002/mrm.20981. [DOI] [PMC free article] [PubMed] [Google Scholar]


