

Abstract
Menadione is a metabolite of vitamin K that is excreted in urine. A high performance liquid chromatography (HPLC) method using a C30 column, post-column zinc reduction and fluorescence detection was developed to measure urinary menadione. The mobile phase was composed of 95% methanol with 0.55% aqueous solution and 5% DI H2O. Menaquinone-2 (MK-2) was used as an internal standard. The standard calibration curve was linear with a correlation coefficient (R2) of 0.999 for both menadione and MK-2. The lower limit of quantification (LLOQ) was 0.3 pmole menadione/mL urine. Sample preparation involved hydrolysis of menadiol conjugates and oxidizing the released menadiol to menadione. Using this method, urinary menadione was shown to increase in response to 3 years of phylloquinone supplementation. This HPLC method is a sensitive and reproducible way to detect menadione in urine. Research support: USDA ARS Cooperative Agreement 58-1950-7-707.
Keywords: menadione, HPLC, vitamin K, phylloquinone, menaquinone-4
1. Introduction
Vitamin K is a fat soluble vitamin known for its role in coagulation. [1] New physiological functions have been attributed to vitamin K, including regulation of calcification in vessel walls and protection against oxidative stress. [2–3]
All forms of vitamin K share a common naphthoquinone ring, but differ in the position-3 side chain. Phylloquinone, which contains the phytyl group as its side chain, is the main dietary source of vitamin K. [1] Menadione, which lacks the side chain, is best known as a synthetic form of vitamin K added to animal feed. Menaquinones are a group of vitamin K-related compounds that contain a poly-isoprenoid side chain of varying lengths at position-3 of the naphthoquinone ring. Even though MK-4 is not abundant in the food supply, it is found in high concentrations in certain tissues. MK-4 may have unique roles in novel functions of vitamin K.
The phytyl side chain of dietary phylloquinone is thought to be removed forming menadione, and the preformed geranylgeranyl side chain is donated by geranylgeranyl pyrophosphate (GGPP) [4]to form tissue MK-4. The removal of the side chain may take place in a central compartment. Menadione is then released to the circulation and prenylated in target tissues forming MK-4. Circulating menadione is most likely conjugated and excreted in the urine.
Sensitive assays for measurement of menadione are required for the study of this conversion of phylloquinone to MK-4. Previous attempts to measure menadione lack the sensitivity to detect this compound in response to a variety of dietary and physiological conditions. [5–7]
We have developed and validated a high performance liquid chromatography (HPLC) method using a C30 column, post-column zinc reduction and fluorescence detection for the purpose of measuring urinary menadione. This HPLC method presents a sensitive and reproducible way to detect menadione in urine, and can be used to help elucidate the role played by menadione in MK-4 formation.
2. Materials and Methods
2.1. Reagents and Standards
Solvents used for extraction and chromatography were HPLC grade (Fisher Scientific, Springfield, NJ). Menadione standard (Sigma-Aldrich, St Louis, MO. Product number M 5625) and internal standard, Menaquinone-2 (MK-2, 2-methyl-3-geranyl-1, 4- Naphthoquinone, a gift from Hoffman La Roche®) were prepared in iso-octane, and characterized spectrophotometrically [8] and chromatographically before use. All operations were performed under yellow light to avoid any losses due to light sensitivity of vitamin K.
2.2. Hydrolysis and Extraction
Menadione is excreted in urine in the form of glucuronide and sulfate conjugates of menadiol. [9] An acid treatment procedure for hydrolysis and oxidation of menadione conjugates in urine was used as previously described [5] The internal standard (MK-2) was added and the samples were vortexed. Three mL of iso-octane was added to each sample in 16×100 borosilicate culture tubes, and the tubes were capped with Teflon-lined screw caps. Samples were vortexed for 3 minutes and centrifuged for 5 minutes at 1800xg to separate the aqueous and organic layers. The top, iso-octane, layer was aspirated and transferred to a clean set of tubes. The iso-octane was evaporated using a gentle stream of nitrogen until approximately 200 μL of iso-octane was left in each tube. The remaining iso-octane residue was transferred to an amber vial, and a suitable aliquot was injected into the HPLC.
2.3. HPLC
The HPLC method is adapted from that used for measurement of vitamin K compounds. [10] The method uses online post-column reduction with zinc metal and fluorescence detection. The HPLC consists of a Waters 2695 Separations Module equipped with a vacuum degasser and auto injector. Excitation and emission wavelengths using a Shimadzu Fluorescence Detector were 244 and 430 nm, respectively. We used a ProntoSil C30 column (5μm, 250 × 4.6 mm) (MAC-MOD Analytical Inc., Chadds Ford, PA), which was cooled to 5°C using a Cool PocketTM (Thermo Electron Corporation, Waltham, MA). To achieve post-column reduction of vitamin K compounds that are not otherwise fluorescent, 100-mesh zinc particles (Alfa Aesar; Ward Hill, MA) were dry-packed into a 50 mm × 3.9 mm (i.d) stainless-steel column equipped with 2 μm frits. The mobile phase consisted of 95% methanol and 5% DI H2O. The methanol has 0.55% aqueous solution added (2.0 M zinc chloride, 1.0 M acetic acid and 1.0 M sodium acetate). The flow rate was 0.6 mL/minute.
2.4. Assay Validation
2.4.1. Recoveries and Lower Limit of Quantification (LLOQ)
For spiking recovery experiments, 3 aliquots of a urine pool (6.1 pmol menadione/mL) were spiked with 4, 10 or 20 pmole menadione/mL, respectively. Four replicates of each aliquot were assayed for menadione.
For dilution recovery experiments, a urine pool containing 25.4 pmol menadione/mL was used to prepare three dilutions (urine: total volumes; 5:7, 1:2 and 1:4) using DI H2O as the diluent. Five replicates of each dilution were analyzed for menadione.
For LLOQ determination, a urine pool was serially diluted with DI H2O. Four replicates of each dilution were assayed. The LLOQ was defined as the lowest level of menadione detected which met the following criteria: 1) a coefficient of variation ≤20%; 2) a percentage of measured/expected menadione of 80–120%; and 3) statistically different from adjacent concentrations. Group means were compared using general linear model (GLM) with Tukey-Kramer adjustment for multiple comparisons. Results were considered statistically significant if P < 0.05.
2.4.2. Intra- and Inter-Assay Variation
Two pooled urine samples with different menadione concentrations [17.3 pmole/mL in control pool one (C-1) and 4.6 pmole/mL in control pool two (C-2)] were used to determine intra- and inter- assay variations. Six replicates of each control were tested per assay; four assays were run on four different days. All individual results were pooled to calculate the inter-assay variability, as expressed by CV%. To obtain the intra assay variability, also expressed by CV%, the individual coefficient of variation of each of the four assays was calculated, and their mean was defined as the intra assay CV%.
2.4.3. Stability
Four aliquots of fresh urine were spiked with different menadione concentrations (final concentrations: 10.4, 15.4, 18.9, and 23.4 pmole menadione/mL urine). Four freeze and thaw cycles were done. For each aliquot, six replicates of fresh urine and each freeze thaw cycle were tested. Results were expressed as % of menadione in fresh urine. GLM with Dunnett adjustment for multiple comparisons was used. Results were considered statistically significant if P < 0.05.
To assess long-term stability, low and high urine controls were tested 48 times over a 5 month period. All aliquots were frozen and thawed once prior to analysis.
2.5. Clinical Applications
Archived urine samples from a human phylloquinone supplementation study [11] were analyzed for menadione. Urine samples collected at baseline (month 0) and at the end of the study (month 36) were used for each participant from either the control group (n=181) or the phylloquinone-supplemented group (500 μg phylloquinone/day, n=186). We hypothesized that changes in 24 hour urinary menadione excretion over the 36 month study period would be significantly higher in the phylloquinone-supplemented group compared to the control group.
2.6. Statistical Analysis
Student’s t test with Bonferroni adjustment for multiple comparisons was used for comparing 24 hour urinary menadione excretion at baseline, end of study, and change in urinary menadione excretion in phylloquinone-supplemented group versus control group. Paired student’s t test with Bonferroni adjustment for multiple comparisons was used for comparing menadione excretion at baseline versus menadione excretion at the end of the study for both phylloquinone-supplemented and control groups. Results were considered statistically significant if the observed significance value was less than 0.01 due to multiple testing (P < 0.01). All statistical analyses were performed using SAS 9.1 software.
3. Results and Discussion
3.1. Choice of Internal Standard
MK-2 was selected as the internal standard for multiple reasons. First, MK-2 shares a naphthoquinone ring with menadione. Second, MK-2 is not a proposed by-product of phylloquinone metabolism, and has not been detected in biological material. Third, under the specified conditions, MK-2 elutes in less than 20 minutes after injection. In contrast, K1 (25), an internal standard used in vitamin K HPLC methods [12], did not elute under these conditions. Although 7- ethoxycoumarin (7-EC) has been used as an internal standard by others [5], it is endogenously fluorescent and does not require zinc reduction for fluorescent detection. As a consequence, changes in 7-EC’s response do not reflect the zinc column conditions that could influence calculation of menadione concentrations, whereas MK-2 does.
3.2. Urine Sample Preparation
Acid treatment prior to analysis was an essential step in detecting menadione in urine because urinary menadione is conjugated. After acid treatment, menadione was detected in urine samples (Figure. 1a), whereas in its absence, no menadione was detected (Figure. 1b).
Figure 1.
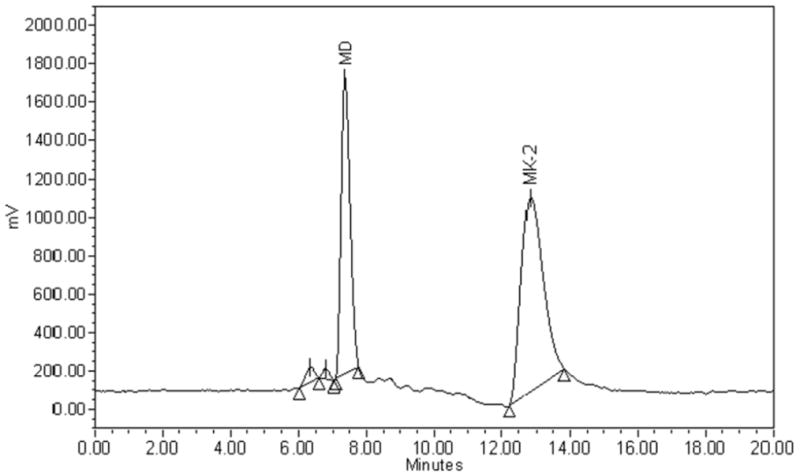
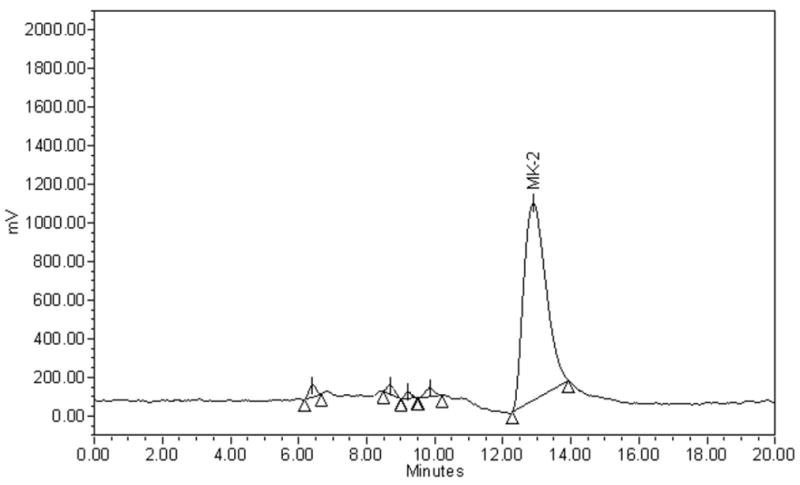
Chromatograms of menadione (MD) in a urine sample collected from a healthy volunteer:
1.a. Sample subjected to acid treatment prior to measurement.
1.b. Sample not subjected to acid treatment.
Iso-octane was found to be the optimal solvent for liquid-liquid extraction. Using Iso-octane resulted in equivalent recoveries of both menadione and MK-2 (paired t test P value = 0.382) (Figure. 2), which is an essential requirement for a valid assay. Multiple extractions of the urine samples did not confer any improvement in total recoveries of either menadione or MK-2 (data not shown).
Figure 2.
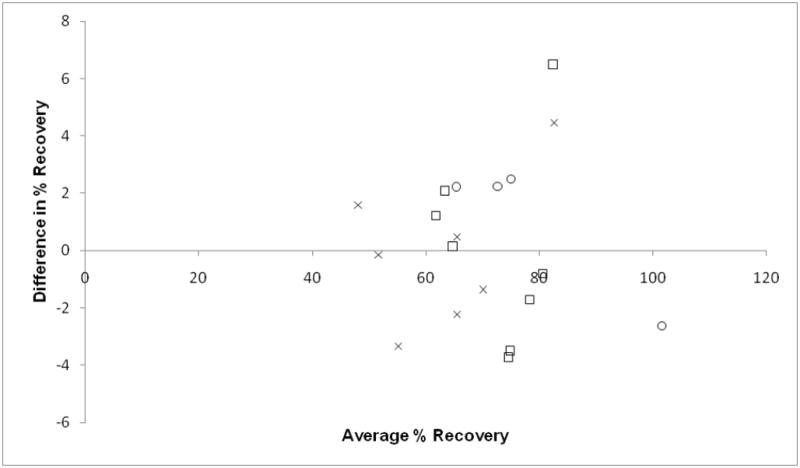
Bland-Altman Plot: Comparison of average % recoveries of each simultaneous injection (n=19) of menadione (MD) and menaquinone-2 (MK-2). Average % recovery= [(MK-2 + MD)/2] × 100.
Difference in % Recovery= (MK-2 − MD) × 100.
Paired student’s t test P value=0.382.
○: MD concentration = 13.3 pmol/mL, MK-2 concentration = 13.0 pmol/mL
X: MD concentration = 8.7 pmol/mL, MK-2 concentration = 11.1 pmol/mL
□: MD concentration = 7.0 pmol/mL, MK -2 concentration = 8.9 pmol/mL
Complete drying of extraction solvent prior to HPLC injection resulted in high menadione losses, as previously reported. [13] We found that the combination of using iso-octane and avoiding complete evaporation was most effective in attaining consistent recoveries of both menadione and MK-2. Therefore, approximately 200 μL residue was left in each tube prior to HPLC injection. More iso-octane was added to reach 200μL if needed. The use of internal standard compensated for any changes in volume of the final residue.
3.3. HPLC
The C30 column was cooled to 5°C to allow better separation of peaks of interest. Increasing the percentage of water in the mobile phase resulted in better separation but loss of sensitivity (Figure. 3). The optimum percentage of H2O in the mobile phase was 5%, which allowed baseline separation of peaks of interest while providing the highest sensitivity. HPLC with UV detection has also been used to measure menadione in plasma. [7, 13] However, fluorescence detection is more sensitive and specific for vitamin K compounds compared to UV detection.
Figure 3.
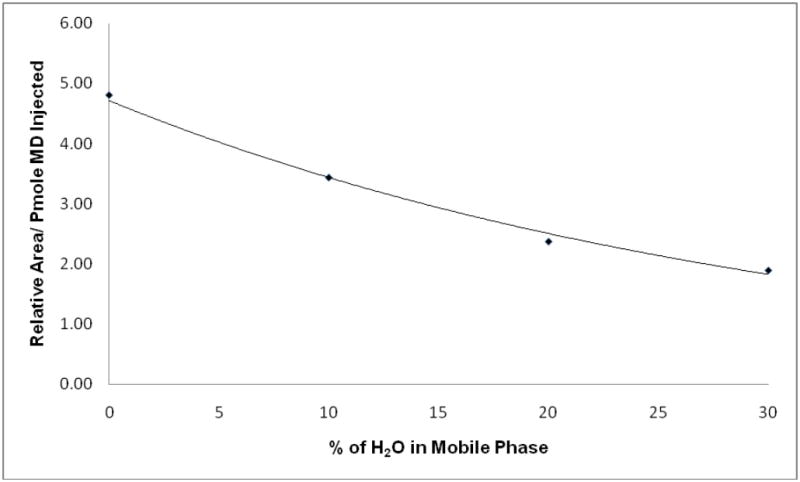
Effect of H2O content in mobile phase on sensitivity. Exponential trend line was fitted to the data.
3.4. Assay Validation
3.4.1. Recoveries and Lower Limit of Quantification (LLOQ)
For spiking recovery experiments, the expected amount of menadione was the sum of endogenous and spiked menadione. Three aliquots of a urine pool (6.1 pmol menadione/mL) were spiked with 4, 10 or 20 pmole menadione/mL, respectively. Recoveries of menadione, defined as measured/expected, from the three aliquots were (mean % ± SD): 104.4±6.0, 100.6±5.8 and 111.7±9.0, respectively.
For dilution recovery experiments, three dilutions of a urine pool containing 25.4 pmol menadione/mL were prepared using DI H2O as the diluent (urine: total volumes; 5:7, 1:2 and 1:4). The mean %± SD recoveries of menadione were 112.0±6.9, 103.9±2.9 and 85.1±2.5, respectively.
As additional strategies to validate the assay, removal of the zinc column eliminated the menadione and MK-2 peaks. Vitamin K is not endogenously fluorescent, thus it requires a post-column zinc reduction for fluorescent detection. Removing the zinc column is a simple technique for eliminating the possibility that we were measuring a fluorescent non-vitamin K compound that co-elutes with menadione. In addition, menadione peak disappearance when acid treatment of the urine was eliminated is a further validation of the assay. Finally, the molecular weight of the peak corresponding to menadione in representative samples and in standard solution was also confirmed by mass spectrometry (MW= 172 g/mole).
The standard calibration curve was linear from 0 to 3.64 pmole of menadione and 5.83 pmole of MK-2 injected, with a correlation coefficient (R2) of 0.999 between them. Exceeding the amount injected of both menadione and MK-2 caused the peaks to go off-scale. We routinely performed single point calibration forcing the slope of the lines through zero. The LLOQ was determined to be 0.3 pmole menadione/mL urine (Table 1). This level of sensitivity in measuring menadione is an improvement over previous reports, [5] and allows us the capacity to measure menadione in response to manipulation of physiological doses of vitamin K in a heterogenous population in terms of vitamin K status.
Table 1.
Menadione (MD) lower limit of quantification (LLOQ)
| Lower Limit of Quantification | |||||
|---|---|---|---|---|---|
| Dilution Factor | Expected Concentration (pmole MD/mL urine) | Measured ConcentrationB (pmole MD/mL urine) | Measured/Expected (%) | SD (%) | CV (%) |
| Initial | |||||
| 1 | N/A | 2.37 | N/A | 0.16 | 6.8 |
| Dilutions | |||||
| 2 | 1.19 | 1.14 w | 96.2% | 0.11 | 9.39 |
| 4 | 0.59 | 0.60 x | 101.3% | 0.06 | 9.36 |
| 8 | 0.30A | 0.30 y | 101.3% | 0.02 | 6.84 |
| 16 | 0.15 | 0.16 z | 108.0% | 0.04 | 31.84 |
| 32 | 0.07 | 0.09 z | 121.5% | 0.07 | 71.72 |
LLOQ of menadione
Concentrations with different superscripts are significantly different using Tukey’s adjusted multiple comparisons of groups’s means (P values <0.05).
3.4.2. Intra- and Inter-Assay Variation
Intra assay CV% was 3.3% and 4.1% for C-1 and C-2, respectively. Inter assay CV% was 4.8% and 4.9% for C-1 and C-2, respectively.
3.4.3. Stability
Menadione concentrations in the first two freeze thaw cycles were not statistically different from fresh urine (P value=0.224 and 0.737, respectively), whereas the third and fourth cycles were (P value<0.0001). These results suggest that urinary menadione is stable up to two freeze-thaw cycles.
In a long-term stability study, mean and CV% for low and high controls were 5.6 and 12.3%, and 21.5 and 11.6%, respectively, showing that menadione in urine is stable for at least 5 months when stored at −80°C.
3.5. Clinical Applications
As predicted, at the end of the 3 years study period, daily urinary menadione excretion for the phylloquinone-supplemented group was significantly higher than the baseline excretion (paired t test P value <0.0001) (Table 2). In contrast, for the control group there were no statistically significant differences between baseline and 3 years menadione excretion (paired t test P value =0.2951). There were no statistically significant differences in urinary menadione excretion between the phylloquinone-supplemented group and control group at baseline prior to supplementation. The change in urinary menadione excretion, as well as urinary menadione excretion at 3 years, were significantly higher in the phylloquinone-supplemented group compared to control group.
Table 2.
Changes in urinary menadione excretion in response to 3 years of 500 μg/day (1109 nmole/day) of phylloquinone (PK) supplementations. Values are presented as mean± SD.
| MD (nmole/24 hours urine excretion) | |||
|---|---|---|---|
| PK –Supplemented Group (n=186) | Control Group (n=181) | P ValueA | |
| Baseline | 12.55± 9.53 m | 13.26± 10.11 m | 0.4893 |
| 3 YearsB | 31.59± 29.73 n | 12.27± 10.67 m | <0.0001 |
| Δ (3 Years- Baseline) | 19.05± 28.29 | −0.98± 12.60 | <0.0001 |
P value based on student’s t test adjusted for multiple comparisons.
Paired student’s t test: PK group at 3 years is significantly different from baseline.
Menadione excretion increases in response to phylloquinone supplementation, which supports the hypothesis that menadione is an intermediate metabolite in the conversion of phylloquinone to MK-4. This assay will be useful for future studies on the role of menadione in this conversion process.
4. Conclusions
In conclusion, this HPLC method presents a sensitive and reproducible way to detect menadione in urine, and can be used in future studies to elucidate the role played by menadione in MK-4 formation.
Abbreviations
- MD
Menadione
- MK-4
Menaquinone-4
- MK-2
Menaquinone-2
- GGPP
geranylgeranyl pyrophosphate
- PK
Phylloquinone
- 7-EC
7- ethoxycoumarin
- LLOQ
lower limit of quantification
Footnotes
Clinical Trial Registration: This study is registered with ClinicalTrials.gov (#NCT00183001).
Publisher's Disclaimer: This is a PDF file of an unedited manuscript that has been accepted for publication. As a service to our customers we are providing this early version of the manuscript. The manuscript will undergo copyediting, typesetting, and review of the resulting proof before it is published in its final citable form. Please note that during the production process errors may be discovered which could affect the content, and all legal disclaimers that apply to the journal pertain.
Contributor Information
Ala Al Rajabi, Email: ala.al_rajabi@tufts.edu.
James Peterson, Email: james.peterson@tufts.edu.
Sang Woon Choi, Email: sang.choi@tufts.edu.
John Suttie, Email: suttie@biochem.wisc.edu.
Susan Barakat, Email: susan.barakat@tufts.edu.
Sarah L Booth, Email: sarah.booth@tufts.edu.
References
- 1.Shearer MJ, Newman P. Thromb Haemost. 2008;100:530–547. [PubMed] [Google Scholar]
- 2.Booth SL. Annu Rev Nutr. 2009;29:89–110. doi: 10.1146/annurev-nutr-080508-141217. [DOI] [PubMed] [Google Scholar]
- 3.Saito E, Wachi H, Sato F, Sugitani H, Seyama Y. J Atheroscler Thromb. 2007;14:317–324. doi: 10.5551/jat.e501. [DOI] [PubMed] [Google Scholar]
- 4.Martius C. Am J Clin Nutr. 1961;9:97–103. doi: 10.1093/ajcn/9.4.97. [DOI] [PubMed] [Google Scholar]
- 5.Thijssen HH, Vervoort LM, Schurgers LJ, Shearer MJ. Br J Nutr. 2006;95:260–266. doi: 10.1079/bjn20051630. [DOI] [PubMed] [Google Scholar]
- 6.Chatzimichalakis PF, Samanidou VF, Papadoyannis IN. J Chromatogr B Analyt Technol Biomed Life Sci. 2004;805:289–296. doi: 10.1016/j.jchromb.2004.03.009. [DOI] [PubMed] [Google Scholar]
- 7.Po ES, Ho JW, Gong BY. J Biochem Biophys Methods. 1997;34:99–106. doi: 10.1016/s0165-022x(97)01210-4. [DOI] [PubMed] [Google Scholar]
- 8.Davidson KW, Sadowski JA. Methods Enzymol. 1997;282:408–421. doi: 10.1016/s0076-6879(97)82124-6. [DOI] [PubMed] [Google Scholar]
- 9.Losito R, Owen CA, Jr, Flock EV. Biochemistry. 1967;6:62–68. doi: 10.1021/bi00853a012. [DOI] [PubMed] [Google Scholar]
- 10.Haroon Y, Bacon DS, Sadowski JA. Biomed Chromatogr. 1987;2:4–8. doi: 10.1002/bmc.1130020103. [DOI] [PubMed] [Google Scholar]
- 11.Booth SL, Dallal G, Shea MK, Gundberg C, Peterson JW, Dawson-Hughes B. J Clin Endocrinol Metab. 2008;93:1217–1223. doi: 10.1210/jc.2007-2490. [DOI] [PMC free article] [PubMed] [Google Scholar]
- 12.Fu X, Peterson JW, Hdeib M, Booth SL, Grusak MA, Lichtenstein AH, Dolnikowski GG. Anal Chem. 2009;81:5421–5425. doi: 10.1021/ac900732w. [DOI] [PMC free article] [PubMed] [Google Scholar]
- 13.Hu OY, Wu CY, Chan WK, Wu FY. J Chromatogr B Biomed Appl. 1995;666:299–305. doi: 10.1016/0378-4347(94)00572-m. [DOI] [PubMed] [Google Scholar]