In the trial reported by Hull et al in this weeks Annals examining venothromboembolism (VTE) prophylaxis in medical patients(1), an interim analysis performed after enrollment of more than 3000 patients at 370 sites in 20 countries, found a lower than anticipated VTE rate (symptomatic or asymptomatic) in those treated with standard enoxaparin prophylaxis (3.3%). In a different context, one might have expected the trial’s sponsor, who market enoxaparin, to have been pleased. However, since this trial was designed to test extended-duration enoxaparin, it is safe to assume these results were not cause for celebration. For new therapies, especially those with risks of serious harms, demonstrating benefit is highly dependent on a sufficiently high control rate(2). Still, rather than conclude that standard enoxaparin is highly effective, and that the benefits of prolonged therapy would be unlikely to outweigh the additional bleeding risk, the investigators set out to identify a subgroup of patients with a higher VTE rate who might be likely to have a net benefit from extended prophylaxis.
Notwithstanding the statistical issues that arise from their interim peek at the data, the concern that the overall result may not apply to all is well-founded. Since patients enrolled in a trial often have very different risks of the outcome, and since the net benefit of therapies with some serious treatment-related harm depends on this risk(3), aggregating results across patients may be misleading(4). While this issue is often addressed by subgroup analysis, because these analyses can group patients in any number of ways, the results of subgroups may also be misleading, even when their results are statistically credible
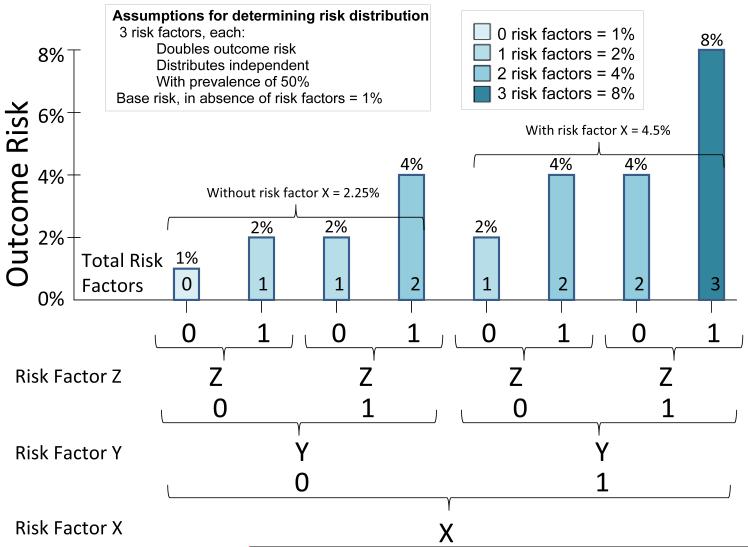
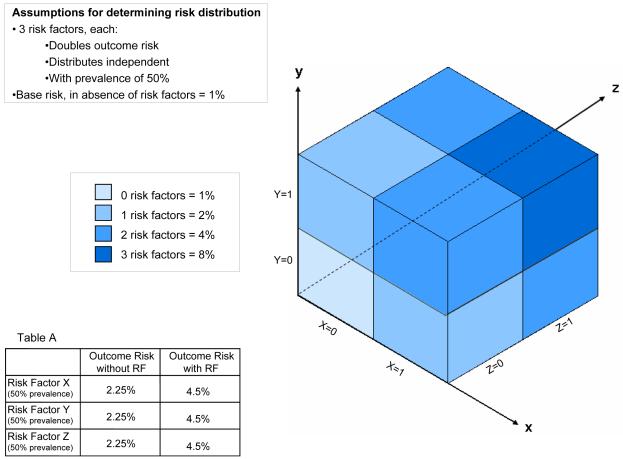
Some of the issues at play for therapies with harms whose benefits can be highly sensitive to baseline outcome risks are illustrated in Figure 1. In this simplified example, the outcome risks for all patients are determined by the presence or absence of 3 independent risk factors, that yield 8 equal-sized groups. For the purposes of discussion, we will assume that a treatment-favorable risk-benefit ratio depends on achieving an outcome rate in the control group of at least 4.5%--the overall rate achieved after the protocol amendment in the trial by Hull et al. However, much like the outcome rate found at the time of the interim analysis, the assumptions described in the figure result in an overall risk of just under 3.4% (the arithmetic mean across all 8 possible risk combinations). Thus, a trial enrolling patients with this risk distribution would yield unfavorable summary results. Nevertheless, subgroup analyses might reveal groups at sufficiently high risk to benefit from therapy.
Figure 1.
The risk distribution illustrated in the figure is generated from the simple assumptions described, and averages 3.4% for the population overall (i.e. based on the arithmetic mean across the subgroups). As illustrated, any subgroup (i.e. those with risk factor X or risk factor y or risk factor z comprised of patients with any one risk factor will have an outcome-risk of 4.5%--suggesting a benefit for 7 out of 8 patients. This is true even though within any of these “high risk” subgroups, ¾ of patients have risks lower than this average. More paradoxically, the average outcome-risk for patients with any risk factor in aggregate is only 3.7%. A risk-stratified analysis, which makes use of the 3 variables simultaneously, would demonstrate that only the highest risk 1/8 of patients would benefit from therapy.
A conventional subgroup analysis—examining for example risk factor X (shown)—would find that those with this risk factor have an outcome rate of 4.5%, suggesting such patients are at high risk and should be treated. Similar analyses would demonstrate that patients with risk factor Y and Z benefit as well. These sequential one-variable-at-a-time subgroup analyses would suggest that all patients should be treated except for those without any risk factors (comprising just one-eighth of the trial population). What this type of analysis would obscure is that three quarters of the patients included in any of the so-called “high-risk” groups have outcome-risks below the 4.5% threshold for net benefit. Even more paradoxically, the 7/8 of patients included as “high risk”, when analyzed in aggregate, have an average risk well below the threshold (average risk = 3.7%); thus, recommendations based on the one-variable-at-a-time analyses would result in net harm. This paradox is explained by the fact that the highest risk group—the only group that benefits—is repeatedly included in each of the sequential one-variable-at-at-time analyses grouped with a different set of lower risk patients who do not benefit.
Alternatively, an analysis that categorizes patients not by individual risk factors, but using a multivariate risk score (as represented by the different shades of green) would clearly show that treatment benefit is limited only to patients who have all 3 risk factors. This analysis would support treatment of only 1/8 of the patients, instead of 7/8 patients, yielding more net-benefit by avoiding exposure to the treatment ‘s harms which outweigh the benefits in lower risk patients.
Even in this highly simplified example, there are several other ways one might create subgroups which would appear to be at sufficient risk to warrant therapy. In the absence of guidelines on how best to assess and report treatment-effect heterogeneity, this is generally left to the discretion of the sponsors and investigators. Yet it is often in the sponsor’s interest to enlarge the treatment-favorable population through the inclusion of lower risk patients, as long as the aggregate risk-benefit remains favorable.
So how do these hypothetical considerations help with the interpretation of the myriad subgroup analyses in the trial reported by Hull et al? First, in the absence of strong evidence that relative treatment effects vary across patients the outcome rate in the control arm of the various subgroups, together with the overall effect, is likely to be more informative than the treatment effect in each of the groups(5), which are individually under-powered to yield precise estimates of treatment effects. Second, we should presume that the primary subgroups reported in the trial were carefully designed during the interim analysis to yield overall outcome rates near the required target, while still including many patients at substantially lower risk. Indeed, in the more finely disaggregated results reported in Table 5 of the study report, it becomes clear that the VTE event rate for patients less than age 75 are below 4% in all groups and less than 3% in most, even those with so-called “high-risk” features. Third, once we shift our focus from overall population to subgroups, it becomes apparent that better, multivariable risk models are critically needed to facilitate rational decision-making for therapies with both incremental risks and benefits (such as extended-duration enoxaparin). The risk model developed during the interim analysis is a start, but is insufficient in itself.
Indeed, given that only 1 in 4 VTE events were symptomatic, a 4.5% treatment threshold is probably insufficiently conservative. If approximately one third of all VTE are prevented at a cost of 1 major hemorrhage for every 200 patients treated, then simple math shows that an underlying VTE rate following in-hospital prophylaxis of approximately 6% is required simply to trade one symptomatic VTE (without extended enoxaparin) for one major hemorrhage (with extended enoxaparin). This is approximately the outcome rate in the group of patients older than 75. While some might consider this a reasonable trade-off, we suspect that most clinicians would not be enthusiastic about extending therapy unless it prevented at least 2 or 3 symptomatic events for each major complication. The highest risk older group might approach this threshold, but only if the observed higher relative treatment-effects in that subgroup apply.
This trial highlights the need for better VTE risk models to more precisely target patients with the best chance of benefiting from new (and existing) therapies(6). More generally, we need to reach consensus regarding the best way to routinely assess and report treatment-effect heterogeneity in both positive and negative trials, particularly for treatments with serious harms. Since a more individualized approach usually means smaller markets for the new therapy, it is imperative to require rigorous and transparent risk-stratification.
Acknowledgements
This editorial was partially supported by the grant NIH/NCRR Grant (KL2 RR025751) Tufts Clinical and Translational Science Institute
Reference List
- (1).Hull RD, Schellong SM, Tapson VF, Monreal M, Samama M, Nicol P, et al. Extended-Duration Venous Thromboembolism Prophylaxis in Acutely Ill Medical Patients with Recent Reduced Mobility: A randomized, controlled trial. Annals of Internal Medicine. 2010 doi: 10.7326/0003-4819-153-1-201007060-00004. In press. [DOI] [PubMed] [Google Scholar]
- (2).Kent DM, Trikalinos TA. Therapeutic innovations, diminishing returns, and control rate preservation. JAMA. 2009;302:2254–56. doi: 10.1001/jama.2009.1679. [DOI] [PMC free article] [PubMed] [Google Scholar]
- (3).Glasziou PP, Irwig LM. An evidence based approach to individualising treatment. BMJ. 1995;311:1356–59. doi: 10.1136/bmj.311.7016.1356. [DOI] [PMC free article] [PubMed] [Google Scholar]
- (4).Kent DM, Hayward RA. Limitations of applying summary results of clinical trials to individual patients: the need for risk stratification. JAMA. 2007;298:1209–12. doi: 10.1001/jama.298.10.1209. [DOI] [PubMed] [Google Scholar]
- (5).Sun X, Briel M, Walter SD, Guyatt GH. Is a subgroup effect believable? Updating criteria to evaluate the credibility of subgroup analyses. BMJ. 2010;340:c117. doi: 10.1136/bmj.c117. [DOI] [PubMed] [Google Scholar]
- (6).Rothberg MB, Lahti M, Pekow PS, Lindenauer PK. Venous Thromboembolism Prophylaxis among Medical Patients at US Hospitals. J Gen Intern Med. 2010 doi: 10.1007/s11606-010-1296-y. [DOI] [PMC free article] [PubMed] [Google Scholar]


