

Abstract
Normalization of regional measurements by the global mean is commonly employed to minimize inter-subject variability in functional imaging studies. This practice is based on the assumption that global values do not substantially differ between patient and control groups. Borghammer and colleagues challenge the validity of this assumption. They focus on Parkinson’s disease (PD) and use computer simulations to show that lower global values can produce spurious increases in subcortical brain regions. The authors speculate that the increased signal observed in these areas in PD patients is artifactual and unrelated to localized physiological changes in brain function. In this commentary, we summarize what is currently known of the relationship between regional and global metabolic activity in PD and experimental parkinsonism. Using SPM, we found that early PD patients demonstrated significant elevations in globally normalized metabolic activity localized to a discrete set of biologically relevant subcortical areas, despite virtually identical global metabolism in these patients and age-matched healthy controls. Group differences in the corresponding absolute measures were not detected because of their greater variability. Over time, abnormal increases in normalized (but not absolute) metabolic activity in subcortical regions appeared earlier in the course of disease and progressed faster than focal cortical reductions or declines in global values. These results indicate that subcortical elevations in normalized regional metabolism are not artifactual. In fact, these measures prove to be more sensitive than absolute values in detecting meaningful functional abnormalities in this disease. Multivariate analysis revealed that the abnormal spatial covariance structure of early PD is dominated by subcortical increases, which were not driven by reductions in cortical or global metabolic activity. Because of the stability of the network measurements, these indices are better suited for use as imaging biomarkers of PD progression and treatment efficacy.
In this issue of NeuroImage, Borghammer and colleagues (Borghammer et al., 2008a) report the results of simulation experiments undertaken to determine whether the elevations in subcortical cerebral blood flow (CBF) and metabolic rate for glucose (CMR) observed in Parkinson’s disease (PD) are artifacts of the global normalization procedure. The simulations were performed by artificially manipulating the distribution of regional activity in CBF PET images from healthy subjects to mimic different hypothetical functional abnormalities in the brain. The main purpose was to create a lower global value by decreasing CBF in specific cortical areas with and without concurrent increases in subcortical regions. The simulated images were spatially normalized and smoothed by a Gaussian filter according to standard practice. Differences in these simulated scans were then assessed voxel-wise using routine statistical parametric mapping (SPM), and with the scaled subprofile model (SSM) a spatial covariance method based on principal components analysis (PCA). Not surprisingly, lower global values in the simulated images led to localized subcortical increases following ratio normalization by the global mean. Based upon these findings, the authors opine that the increases in subcortical metabolic activity seen consistently in rest state CBF and CMR scans of PD populations (e.g., Eidelberg et al., 1994; Moeller et al., 1999; cf. Eckert et al., 2007 for review) do not represent true physiological signals.
Glucose Metabolism in Parkinson’s Disease: Are Regional Elevations Really Present?
Central to the authors’ argument is the notion that the global metabolic rate (GMR) is decreased in PD, due primarily to extensive neurodegeneration in the neocortex. They further posit that such global reductions often fail to reach statistical significance relative to control values because of the small sample sizes typically encountered in functional imaging studies. While such low-magnitude global reductions are not significant in the strict sense, normalization by these values can spuriously elevate measurements of regional metabolic activity. The current study emphasizes the impact of this potential error on the interpretation of metabolic findings in PD. Nonetheless, this issue is likely to be generic in that the authors have advanced the same concern with regard to CBF PET findings in hepatic encephalopathy (Borghammer et al., 2008b).
Since the early days of functional brain imaging, it has been widely appreciated that normalization by global values can introduce bias in comparisons of regional data from populations not adequately matched for these measures (see e.g., Petersson et al., 1999). Similar concerns also exist in the interpretation of within-subject changes when an intervention (behavioral, pharmacologic, or surgical) alters both regional and global values. Notably, global normalization can have a strong effect on the spatial covariance structure of a dataset (e.g., Ford, 1986). Indeed, data-driven statistical methods like SSM/PCA were designed originally to mitigate this confound by estimating regional effects independent of global changes (Moeller et al., 1987; Strother et al., 1995; cf. Alexander and Moeller, 1994). There can be little doubt that this issue is critical to the interpretation of functional imaging data from patients with neurodegenerative diseases like Alzheimer’s disease (AD) in which the pathology primarily affects the cerebral cortex, and in which GMR is reduced rather early in the clinical course. We note that localized increases in metabolic activity with concurrently declining GMR have also been observed in healthy aging (e.g., Moeller et al., 1996). These aging-related changes are, however, unrelated to the qualitatively similar regional abnormalities seen in PD (Moeller and Eidelberg, 1997; cf. Tang et al., 2008).
In this vein, one might ask whether these considerations pertain to disorders like PD in which cortical neuronal loss/dysfunction occurs as a later feature of the neurodegenerative process (e.g., Braak et al., 2003). In the following analyses, we will show that in keeping with the histopathological evidence as well as our previous metabolic data (e.g., Huang et al., 2007b; Eidelberg et al., 1994), absolute measurements of GMR are not reduced in the early clinical stages of the disease. Moreover, the subcortical increases in regional activity, which the authors consider to be artifactual, are in fact found to dominate the metabolic landscape of the disorder.
Analysis 1: Metabolic Comparison of Early PD and Normal Controls
To determine whether abnormal elevations of subcortical metabolism in PD are an artifact of reduced GMR, we analyzed FDG PET scans from 24 patients (age 57.1±10 years, mean±SD) with early stage PD (Hoehn & Yahr Stage I-II; mean Unified Parkinson’s Disease Rating Scale (UPDRS) motor score 18; mean duration 3.7 years). The imaging data from these subjects were compared with those from 24 healthy volunteer subjects (age 57±12 years). The scans were performed quantitatively with arterial blood sampling as described elsewhere (Fukuda et al., 2001).
We found that GMR values were nearly identical for the two groups (PD: 6.8±1.9, NL: 6.9±1.8 mg/min/100g; p=0.79, Student t-test). SPM 5 (Institute of Neurology, London, UK) was used to contrast ratio-normalized scans from the two groups. The analysis revealed abnormal increases (p<0.05, FWE-corrected) in regional metabolic activity in PD (Table 1). These changes (Figure 1A) were localized to the globus pallidus, ventral thalamus, dorsal pons/midbrain, and the sensorimotor cortex (SMC). By contrast, no regions with abnormal metabolic reductions were identified in the PD group, even at a less stringent hypothesis-testing threshold (p=0.01, uncorrected). These data are in accord with our previously published findings in early stage PD patients (Eidelberg et al., 1994; Huang et al., 2007b) indicating that GMR is normal in this group and that significant increases in metabolic activity are present in a specific set of interconnected brain regions (cf. Eidelberg et al., 1997; Lin et al., 2008).
Table 1.
Regions with abnormal increases in glucose metabolism in early stage PD
| Regions | Coordinatesa | Zmax | p-valueb | Glucose Metabolismc | ||||||
|---|---|---|---|---|---|---|---|---|---|---|
| Absoluted | Normalizede | |||||||||
| x | y | z | PD | Normal | PD | Normal | ||||
| Sensorimotor cortex | Right | 14 | −26 | 52 | 5.40 | <0.001 | 10.71 ± 2.99 | 9.70 ± 2.91 | 1.59 ± 0.08 | 1.39 ± 0.13 |
| Left | −38 | −26 | 52 | 4.37 | 0.004 | 12.24 ± 3.71 | 11.46 ± 3.44 | 1.81 ± 0.11 | 1.65 ± 0.12 | |
| Ventral thalamus | Left | −16 | −24 | 6 | 4.68 | 0.012 | 12.00 ± 3.60 | 11.10 ± 3.22 | 1.77 ± 0.10 | 1.60 ± 0.13 |
| Right | 22 | −30 | 2 | 4.60 | 0.011 | 10.29 ± 3.03 | 9.49 ± 3.00 | 1.52 ± 0.06 | 1.36 ± 0.15 | |
| Putamen, GP | Right | 32 | −10 | −2 | 4.48 | 0.034 | 12.78 ± 3.68 | 12.03 ± 3.61 | 1.90 ± 0.11 | 1.73 ± 0.12 |
| Midbrain/Pons | 0 | −36 | −10 | 4.51 | 0.034 | 9.49 ± 2.75 | 8.45 ± 2.88 | 1.41 ± 0.07 | 1.20 ± 0.19 | |
| Cerebellum lobules IV-VIa | Right | 14 | −48 | −20 | 4.72 | 0.001 | 11.02 ± 3.29 | 10.01 ± 0.63 | 1.63 ± 0.11 | 1.43 ± 0.14 |
| Left | −2 | −60 | −16 | 4.61 | 0.005 | 10.82 ± 3.13 | 9.65 ± 0.62 | 1.61 ± 0.11 | 1.38 ± 0.18 | |
Montreal Neurological Institute (MNI) standard space. Cerebellar localization according to the atlas of Schmahmann (Schmahmann et al., 2000)
FWE-corrected (see text).
Mean values (±SD) measured in spherical (radius = 4mm) volumes-of-interest (VOIs) centered at the peak voxel of each of the listed regions.
mg/min/l00g
Cerebral metabolic rate/GMR
Figure 1. Metabolic changes in early Parkinson’s disease.
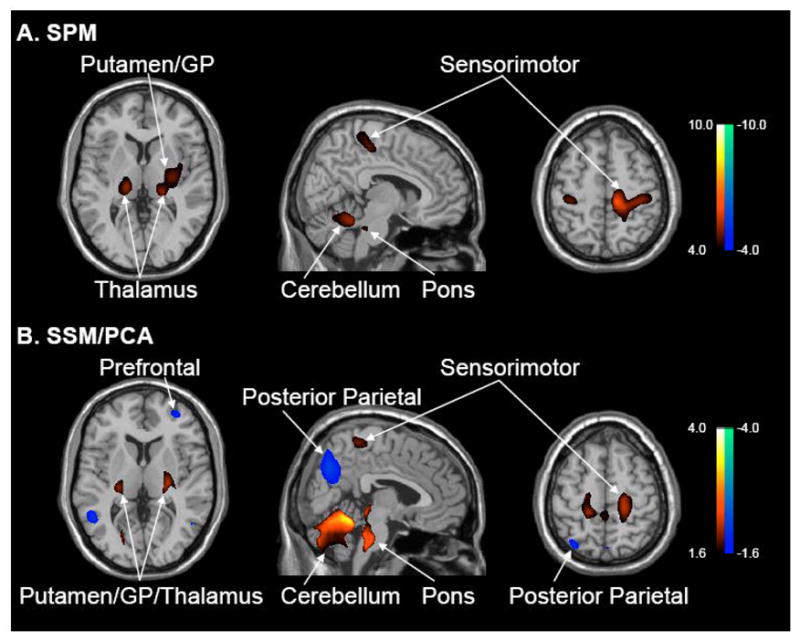
A. Voxel-based comparison of [18F]-fluorodeoxyglucose (FDG) positron emission tomography (PET) scans from 24 early stage Parkinson’s disease (PD) patients and 24 age-matched normal (NL) subjects. Global rates of glucose metabolism (GMR) were similar for the two groups (see text). Significant regional metabolic increases (p<0.05, corrected) were evident in PD that were localized to the putamen/globus pallidus, thalamus, pons, cerebellum, and sensorimotor cortex (see Table 1). No areas of reduced metabolic activity were noted at a hypothesis-testing threshold of p<0.01, uncorrected). [SPM(t) display was overlaid on a standard MRI brain template and thresholded at p<0.001 (uncorrected) with cluster cutoff of 100 voxels].
B. Voxel-based SSM/PCA analysis of the same FDG PET dataset revealed a significant spatial covariance pattern (PC1, 16% VAF) characterized by positive contributions from the areas that were found to be hypermetabolic on the SPM analysis. The pattern also included negative contributions from prefrontal and posterior parietal association areas. Subject scores for this pattern were elevated in PD patients relative to controls (p<0.00001); these values did not correlate with GMR (see text).
[Voxel weights on PC1 overlaid on a standard MRI brain template. The display represents voxels that contributed significantly to the pattern (p<0.005), and that were reliable on bootstrap resampling (see text). Voxels with positive region weights are color-coded from red to yellow; those with negative region weights are color-coded from blue to purple].
We also note that there was no evidence of significant regional differences in absolute measures of glucose utilization. That is, voxel-based comparison of regional metabolism in the early PD and control groups was negative without GMR normalization, even at very liberal uncorrected thresholds. This point is illustrated by review of absolute and globally normalized metabolic values for the regions that were found to have significant group differences on SPM analysis. None of these regions (Table 1) exhibited significant group differences in absolute metabolism (p>0.19), despite highly significant increases in the normalized values (p<0.0001, Student t-tests). This was attributable to the marked reduction in between-subject variability achieved by the normalization step (Absolute: mean coefficient of variation (COV)=29.3 % and 30.8 %; Normalized: 5.7% and 10.2% for PD patients and healthy controls). Apart from reducing the dispersion of the data, global normalization also improved the within-subject stability of the regional metabolic measurements. This was demonstrated by assessing the test-retest reproducibility of the absolute and normalized values for each of these areas in the scans of 20 independent PD subjects who were studied twice with FDG PET over an eight week period (Ma et al., 2007; Huang et al., 2007a). Indeed, we found that the globally normalized values for the significant regions exhibited greater reproducibility (mean ICC=0.82, range: 0.73 – 0.97) than the corresponding absolute metabolic measures (mean ICC=0.65, range: 0.54 – 0.75). GMR exhibited similar reproducibility to the absolute regional values (ICC=0.67, 95% confidence interval 0.34, 0.86). These findings indicate that when GMR values are carefully matched across groups, global normalization enhances the sensitivity of PET to detect meaningful regional differences. The normalization procedure can also improve the stability of regional metabolic measurements in individual subjects, an essential requirement for use as a disease biomarker. Whether normalized metabolic values are “physiological” will be addressed later in this commentary.
Spatial Covariance Analysis: SSM/PCA
The reported simulation experiments also suggest that lowered global values can produce specious network contributions (i.e., false positive voxel weights) from metabolically preserved subcortical regions (cf. Moeller et al., 1996). Before discussing the relevance of this concern to the abnormal spatial covariance topography of PD (cf. Moeller and Eidelberg, 1997; Eckert et al., 2007), we thought it helpful to review the multivariate technique that was employed in these analyses. The scaled subprofile model (SSM) was introduced by Moeller and colleagues (Moeller et al., 1987; Moeller and Strother, 1991; cf. Alexander and Moeller, 1994; Strother et al., 1995) to examine subject×region interactions in functional brain images, while disambiguating global and region-specific effects in the data. Although this data-driven approach was initially applied to metabolic scans acquired in the resting state using region-of-interest (ROI) data, it was ultimately extended to voxel-wise analyses of functional images acquired in both the resting and activated states (e.g., Strother et al., 1995; Alexander et al., 1999; Nakamura et al., 2001; Carbon et al., 2003b; Habeck et al., 2005; cf. Friston et al., 2008). A detailed review of the mathematical principles and basic theoretical assumptions underlying this method and its relationship to mass-univariate approaches like SPM has appeared recently (Moeller and Habeck, 2006).
In the SSM, it is assumed that after removing the between-subject and between-region variability in the natural log-transformed imaging data, the residual regional values are small but contain relevant biological information independent of the global mean. Following the initial “double normalization” step, principal components analysis (PCA) is applied to these residuals (termed “subject residual profiles”, SRP) to characterize the spatial covariance structure of the subject groups. This method quantifies the expression of the obtained covariance patterns in each subject; it can also be used to assess the expression of a given pattern on a prospective single case basis. SSM/PCA refers to the subject scores for each principal component (PC) as subject scaling factors (SSFs). These values can be compared across groups and/or correlated with demographic and clinical descriptors of disease (e.g., Eidelberg et al., 1994; 1995; cf. Alexander and Moeller, 1994). Specific covariance patterns are considered to be “disease-related” if the SSF values distinguish the patient and control groups at a threshold of p<0.001, Student t-test (see e.g., Moeller et al., 1999; Ma et al., 2007). The model also computes a multiplicative global scaling factor (GSF) that is independent of the topographic effects embodied in the SSFs.
All voxels included in the analysis are assigned weights reflecting the salience of their contribution to the spatial covariance pattern network. For high eigenvalues, the magnitude and sign of the correlation between subject expression of the pattern (i.e., the SSF) and globally-normalized metabolic activity at each voxel determines the regional loadings (voxel weights) of the network. Voxels with significant positive correlations between these variables are assigned positive weights such that as pattern expression increases, metabolic activity in the positively weighted voxels increases as well. Likewise, negative voxel weights indicate decreases in local metabolic activity with increasing pattern expression. By convention, voxels with positive weights are displayed on a red color scale; those with negative weights are displayed on a blue color scale.
Voxels not participating in the network, i.e., those in which the correlation between SSF and globally normalized regional metabolism is not significant at a prespecified threshold, are assigned weights of zero. These regions represent the “baseline” for interpreting the positive and negative voxel weights within the network. In other words, the non-zero loadings reflect the covariance structure of the voxels that participate in the pattern. These voxel weights describe relative metabolic activity at the different network nodes; they do not represent regional metabolic rates for glucose in the absolute sense. Quite importantly, the definition of “zero” on the region weights of a particular network is not arbitrary. The authors suggest that in our work positive loadings were incorrectly assigned to null regions through a shift of the network baseline. Such an error would in fact be tested by our model and accordingly rejected.
Analysis 2: Abnormal Spatial Covariance Pattern in Early PD
SSM/PCA was applied to the combined FDG PET data of the 24 early PD patients and 24 healthy controls described in Analysis 1. The computational procedure that was used has been described elsewhere (e.g., Ma et al., 2007; Habeck et al., 2008). The first principal component (PC1) accounted for 16% of the subject×voxel variability. Subject scores for this pattern accurately differentiated patients from controls (p<0.00001; Student t-test); these scores did not correlate with GMR (r2=0.02, p=0.8). Voxel weights on PC1 are displayed in Figure 1B. This early disease-related spatial covariance pattern was characterized by positive contributions (p<0.005) from the same brain regions that were found to be abnormally overactive on the SPM analysis (Analysis 1). At this threshold, the pattern also included a negative contribution from the posterior parietal cortex (BA 7/40) and from a small area of the prefrontal cortex (BA 9/10). In all contributing regions, voxel weights on the pattern proved to be stable by bootstrap resampling (|ICV|>2.75, p<0.005; 1000 iterations). Subject scores on this pattern exhibited excellent test-retest reliability (ICC 0.97, 95% confidence interval: 0.91, 0.99; p<0.001) when computed prospectively in the FDG PET scans from the test-retest cohort of 20 independent PD patients described above (Ma et al., 2007; cf. Huang et al., 2007a).
Thus, the metabolically overactive regions identified with SPM also make significant positive contributions to the disease-related spatial covariance topography. Interestingly, spatial covariance analysis also identified negative network contributions from posterior parietal and prefrontal cortex. We have recently reported increases in the metabolic activity of these areas following stereotaxic subthalamic nucleus (STN) surgery for PD, without change in global values (e.g., Trošt et al., 2006; Asanuma et al., 2006). This suggests that the metabolic reductions observed in these cortical regions in the untreated state are likely to be the consequence of abnormal signaling from functionally overactive subcortical regions.
PD-Related Covariance Pattern in Later Stage Patients
When SSM/PCA is applied to combined group FDG PET datasets that include non-demented PD patients with advanced motor symptoms (Hoehn & Yahr Stage 3 or greater), the resulting disease-related covariance patterns are characterized by greater negative contributions from parietal association regions and from premotor and prefrontal cortex (Ma et al., 2007; cf. Moeller et al., 1999; Carbon et al., 2003a). Borghammer and colleagues hypothesize that cortical changes are the main regional drivers of PDRP activity. If indeed the subcortical and SMC “red” areas of the network are truly neutral from a functional standpoint (i.e., their voxel weights are at or near zero, rather than positive), one would predict that a subnetwork comprised only of these regions will exhibit little if any change with disease progression. One would also predict highly significant longitudinal changes in the expression of a subnetwork comprised solely of the cortical “blue” regions. The latter possibility is particularly compelling in that an incorrect assignment of baseline could lead to an underestimation of the negative contributions of these areas.
Analysis 3: The Time Course of Positive and Negative PDRP Subnetworks
To explore this possibility, we utilized the longitudinal FDG PET data from a recent natural history study in which 15 early stage PD patients were scanned three times over a four year period (Huang et al., 2007b). Using a validated PDRP biomarker identified in PD patients with both early and more advanced disease (Ma et al., 2007) (Figure 3B) we computed pattern expression in every subject at each time point. However, unlike the published progression study, in this analysis we performed these computations in separate brain masks corresponding to the spaces defined by the positive and negative voxel weights (i.e., the respective PDRP subnetworks). We found that pattern expression increased over time in both masks (positive: F(2, 23)=15.99, p<0.0001; negative: F(2,23)=6.06, p<0.01; RMANOVA). Further analysis confirmed the graphical impression (Figure 2) that the rate of progression was relatively greater in the positive mask relative to the negative one (p=0.07; time×mask interaction). Indeed, significant abnormal elevations in the expression of the positive subnetwork were evident at all three time points relative to healthy controls. By contrast, the expression of the negative subnetwork did not differ from controls at any of the three time points. As previously reported in early stage PD patients, GMR values in the longitudinal cohort did not change significantly over the four years of follow-up (F(2,23)=0.9, p=0.44; RMANOVA). Moreover, these values did not differ from those of controls at any of the three time points (Huang et al., 2007b).
Figure 3. Abnormal metabolic covariance patterns in parkinsonian monkeys and PD patients.
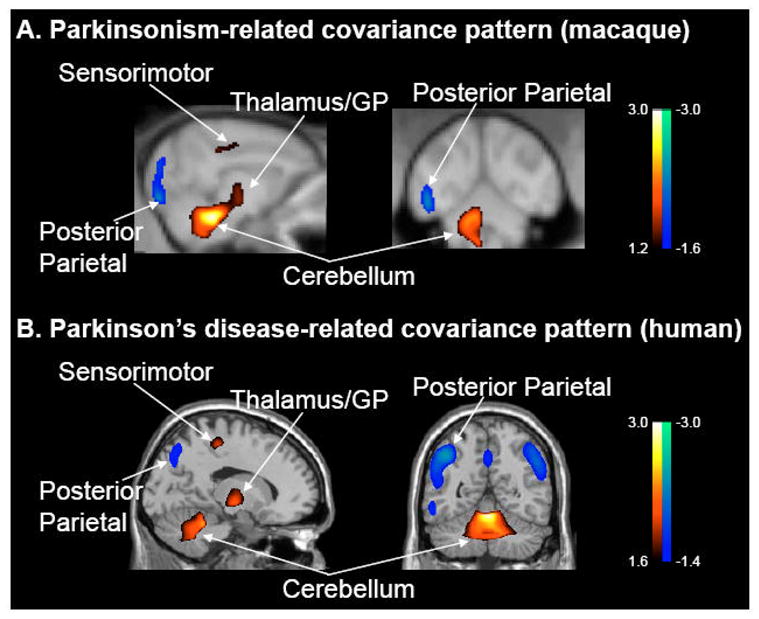
A. Voxel-based SSM/PCA of high resolution FDG PET images from parkinsonian and healthy age-matched macaques. This analysis revealed a spatial covariance pattern (PC1, 25% VAF) that discriminated the two groups of animals (p<0.0005; see text). The pattern was characterized by positive metabolic contributions from pallidothalamic, pontocerebellar and motor cortical regions, and negative contributions from the posterior parietal cortex.
B. This abnormal primate covariance pattern resembles the PDRP topography that has been observed consistently in human subjects with PD (e.g., Ma et al., 2007; cf. Moeller et al., 1999; Eckert et al., 2007). [Both spatial covariance patterns were displayed on standard MRI brain templates. Voxels with positive region weights are color-coded from red to yellow; those with negative region weights are color-coded from blue to purple].
Figure 2. Longitudinal time course of positive and negative subnetwork expression.

Subject scores (mean ± SE) for the positive and negative subnetworks of the PD-related spatial covariance pattern (PDRP) (Ma et al., 2007) were separately computed in scans acquired at each time point as part of a longitudinal PD imaging study (Huang et al., 2007b). The expression of both subnetworks increased over time, but at a faster rate for the positive subnetwork. We found that patient values for the positive subnetwork were abnormally elevated at all three longitudinal time points; those for the negative subnetwork did not differ from control values at any of these time points. [Values for the positive and negative subnetworks at each time point (filled circles and squares, respectively) were displayed relative to mean values measured in 15 age-matched healthy subjects. Subject scores were z-transformed and offset so that the control mean was zero. The shaded area represents 1 SE above the control mean. *p<0.05, **p<0.001, ***p<0.0001, relative to normal values].
Subject scores for the positive and negative subnetworks correlated closely with those of the composite PDRP parent network (p<0.0001). Interestingly, the two subnetworks had a much weaker correlation (p=0.03) with one another, suggesting that the positive and negative elements of the PDRP represent different manifestations of the disease. This notion is supported by the results of within-subject correlations (Bland and Altman, 1995) between the time course of subject scores for the two subnetworks and concurrent longitudinal changes in clinical motor ratings and global values (Table 2). Strong correlations (p<0.005) were present between longitudinal increases in subject scores for the positive pattern (and for the early PD covariance pattern described in Analysis 2) and concurrent changes in UPDRS motor ratings. By contrast, correlations between these variables were weaker (p=0.02) for the negative subnetwork. Longitudinal changes in the expression of the two subnetworks (and the parent PDRP network) did not correlate with concurrent GMR measurements (p>0.16).
Table 2.
Correlations between longitudinal changes in pattern expression, global values, and clinical motor ratings
| PDRP Networka | Positive Subnetwork | Negative Subnetwork | Early Networkb | GMR | UPDRS | |
|---|---|---|---|---|---|---|
| PDRP Networka | 0.85c, <0.0001 | 0.80, <0.0001 | 0.98, <0.0001 | −0.23, 0.25 | 0.62, 0.004 | |
| Positive Subnetwork | 0.85c, <0.0001 | 0.43, 0.03 | 0.88, <0.0001 | −0.11, 0.59 | 0.62, 0.004 | |
| Negative Subnetwork | 0.80, <0.0001 | 0.43, 0.03 | 0.75, <0.0001 | −0.28, 0.16 | 0.53, 0.02 | |
| Early Networkb | 0.98, <0.0001 | 0.88, <0.0001 | 0.75, <0.0001 | −0.14, 0.51 | 0.59, 0.006 | |
| GMR | −0.23, 0.25 | −0.11, 0.59 | −0.28, 0.16 | −0.14, 0.51 | −0.32, 0.17 | |
| UPDRS | 0.62, 0.004 | 0.62, 0.004 | 0.53, 0.02 | 0.59, 0.006 | −0.32, 0.17 |
PD-related spatial covariance pattern (PDRP) identified by SSM/PCA of FDG PET scans from a combined group of 33 mild-moderate PD patients and 33 healthy subjects (Ma et al., 2007).
Spatial covariance pattern identified by SSM/PCA of FDG PET scans from a combined group of 24 early stage PD patients and 24 healthy subjects (see Analysis 2 in text)
Bland-Altman within-subject correlation coefficients and associated p-values for comparisons of longitudinal changes in pattern expression with concurrent changes in PDRP subnetwork scores, GMR, and UPDRS motor ratings (see text).
PDRP = Parkinson’s disease-related pattern; GMR = global metabolic rate; UPDRS = Unified Parkinson’s Disease Rating Scale
These results are in keeping with those from a previous FDG PET study in which SPM was used to demonstrate significant correlations between clinical motor ratings and increases in the metabolic activity of the putamen and globus pallidus (Lozza et al., 2002). These findings also accord with SPM analysis of the same dataset showing that early disease progression is dominated by significant increases (p<0.001) in normalized metabolic activity in the globus pallidus, subthalamic nucleus, and dorsal pons/midbrain (see Figure 4 and Table 2 in Huang et al., 2007b). Over time, changes in normalized metabolic activity in these regions correlated with concurrent deterioration in motor ratings (GPi: p=0.01; STN: p=0.0005; pons/midbrain: p=0.001). By contrast, significant metabolic reductions in the neocortex (and reduced GMR) were evident with more advanced disease, emerging after the initial subcortical increases. Longitudinal changes in the absolute regional values and GMR were not significant and did not correlate with the motor ratings. This is consistent with the lower within-subject reproducibility of the absolute measures relative to their normalized counterparts (see above).
Relationship to Experimental Animal Studies
The authors discuss published data from experimental animal models suggesting that subcortical hypermetabolism is not a consistent functional by-product of nigrostriatal dopamine depletion. This literature is overall difficult to evaluate cohesively because of methodological variation as well as interspecies differences. Moreover, the authors do not cite recent reports demonstrating such findings in methyl-4-phenyl-1,2,3,6 tetrahydropyridine (MPTP) primates (Guigoni et al., 2005; cf. Emborg et al., 2007). In one experimental study, [3H] 2-DG autoradiography was used to demonstrate abnormally increased radiotracer uptake in the internal and external GP, STN, and ventral thalamus in macaques with bilateral MPTP-induced parkinsonism (Guigoni et al., 2005). Of note, absolute metabolic increases in these regions as well as in the pedunculopontine nucleus (PPN) and SMC have been specifically identified with quantitative [11C]-2-DG autoradiography in the 6-OHDA rodent model (Carlson et al., 1999). In any event, no previously published data exist to demonstrate the presence of abnormal spatial covariance patterns analogous to the PDRP in experimental animal models.
Analysis 4: Parkinsonism-Related Spatial Covariance Pattern in MPTP Primates
To determine whether such patterns are expressed in parkinsonian macaques, we used high resolution FDG PET (ECAT HRRT, CPS Innovations, Knoxville, TN, USA) to scan eight monkeys with bilateral parkinsonism following chronic intravenous MPTP (Peng et al., 2008; cf. Doudet et al., 2004). Six healthy monkeys served as controls. Images from both groups were spatially normalized to a standard macaque template (Black et al., 2001).
We found that global values were similar for the two groups (p=0.44, Student t-test). Significant (p<0.001, uncorrected; SPM) increases in globally-normalized metabolic activity were present in the GP/thalamus, pons, and cerebellum of the parkinsonian animals, along with a single area of reduced metabolic activity in the posterior parietal cortex. SSM/PCA revealed a spatial covariance pattern (PC1, 25% VAF) that was characterized by positive and negative contributions (Figure 3A) from the same brain regions that were found to have abnormal metabolic increases and decreases on SPM analysis. The expression of this pattern was significantly increased (p<0.0005, Student t-test) in the MPTP group relative to control animals. These subject scores did not correlate with global values (r2=0.010, p=0.67). These experimental data indicate that an abnormal spatial covariance pattern is present in the parkinsonian primate, which topographically resembles the human PDRP (Figure 3B). There is also no evidence to suggest that the primate pattern is an artifact of disparities in GMR across the lesion and control groups. Moreover, in both species pattern expression was found to be completely independent of the corresponding global values.
Physiological Correlates of the PDRP and Related Metabolic Patterns
The authors maintain that the PDRP and related spatial covariance patterns have no inherent physiological meaning. This assertion does not take into account recent published work in which a close relationship was demonstrated between regional metabolic activity and STN firing rates recorded intraoperatively in awake, unmedicated PD patients (Lin et al., 2008). These invasive measures of cell activity, adjusted for individual differences in disease duration and severity, correlated significantly (r2 = 0.39, p < 0.007) with PDRP expression and with globally-normalized regional metabolism in the putamen, GP/thalamus, and the motor cortex. The firing rates did not correlate with GMR (r2=0.11, p=0.2). Although the regional correlations with firing rate remained significant without global normalization (r2=0.34, p<0.02), their magnitude was lower than for the corresponding normalized values.
Thus, metabolic activity at the key subcortical nodes of the PDRP network correlates with STN discharge firing rate, a direct physiological index of circuit dysfunction in PD (see e.g., Wichmann and DeLong, 2003). In this regard, it is not surprising that stereotaxic surgical interventions that target these regions are effective in treating this disorder (Eckert and Eidelberg, 2005). Moreover, clinical improvement following these procedures has been shown to correlate with reductions in the basal metabolic overactivity of these areas, as well as with concurrent declines in PDRP expression (see Fukuda et al., 2001; Carbon et al., 2003a; Trošt et al., 2006; Asanuma et al., 2006). Indeed, analogous metabolic changes at both the regional and network levels have been reported recently following STN gene therapy for advanced PD (Feigin et al., 2007a; Kaplitt et al., 2007). As with more routine surgical interventions for PD, clinical outcome in individual subjects undergoing this novel intervention correlated with the degree of PDRP modulation that was achieved, not with operative changes in global values.
Closing Comments
It is uncertain whether robust conclusions regarding the biology of brain disease can be made based upon idealized simulations of data from healthy subjects. It is important to note that the current study by Borghammer and colleagues involved the analysis of real and simulated [15O]-PET images, which have lower signal-to-noise than those of [18F]-PET tracers. Inferences regarding statistical power derived from such exercises may therefore not be strictly applicable to FDG PET studies. Indeed, this difference is reflected in the use of a large filter width (14mm) to suppress the excessive noise inherent in the CBF PET images. Over-smoothing PET images to such a degree worsens effective image resolution, and because of partial volume effects, limits the reliable detection of functional changes in small subcortical regions. Moreover, the presumed tight coupling between CBF and CMR in PD may not be valid for subjects scanned while on dopaminergic treatment, or in whom medication washout is incomplete (Hirano et al., 2008).
In summary, systematic imaging research in PD and related disorders has revealed consistent patterns of altered brain function at both the regional and network levels. These abnormalities have been found to be independent of the global measures used in image normalization. Apart from the PDRP, distinct quantifiable spatial covariance patterns have been identified in a variety of neurodegenerative conditions (e.g., Habeck et al., 2008; Feigin et al., 2007b). Particularly relevant are disease-related metabolic patterns associated with atypical parkinsonian syndromes like multiple systems atrophy (MSA) and progressive supranuclear palsy (PSP), which can clinically resemble classical PD (Eckert et al., 2008). In these conditions, subcortical contributions to the respective networks are not hypermetabolic as in PD. Indeed, the regional metabolic changes that characterize MSA and PSP are distinctive enough to be used as biomarkers in an automated network-based diagnostic algorithm (Spetsieris et al., 2006). Indeed, like the PDRP, these disease-related metabolic patterns may ultimately serve as objective descriptors of disease severity in clinical trials of new treatment strategies (e.g., Feigin et al., 2007a; cf. Eckert and Eidelberg, 2005).
It is also worth noting that the topography of disease-related patterns can change in the course of the disease process. For instance, in a recent longitudinal FDG PET study of presymptomatic carriers of the Huntington’s disease (HD) mutation, we found that initially abnormal increases in thalamic glucose utilization gave way to metabolic reductions in the same region as clinical onset neared, without corresponding changes in GMR (Feigin et al., 2007b). Thus, systematic studies of patients, non-manifesting carriers of disease mutations, and healthy controls, ideally with longitudinal follow-up, are warranted to understand the full biological meaning of disease-related imaging signals. Simulations of disease states using scans from normal subjects are no substitute for such “real life” patient investigations.
Acknowledgments
This work was supported by NIH NINDS R01 35069, 047668, and P50 NS 38370 and by the General Clinical Research Center of The Feinstein Institute for Medical Research (M01 RR018535). We thank Ms. Toni Flanagan for valuable editorial assistance.
Footnotes
Publisher's Disclaimer: This is a PDF file of an unedited manuscript that has been accepted for publication. As a service to our customers we are providing this early version of the manuscript. The manuscript will undergo copyediting, typesetting, and review of the resulting proof before it is published in its final citable form. Please note that during the production process errors may be discovered which could affect the content, and all legal disclaimers that apply to the journal pertain.
References
- Alexander GE, Mentis MJ, Van Horn JD, Grady CL, Berman KF, Furey ML, Pietrini P, Rapoport SI, Schapiro MB, Moeller JR. Individual differences in PET activation of object perception and attention systems predict face matching accuracy. Neuroreport. 1999;10:1965–1971. doi: 10.1097/00001756-199906230-00032. [DOI] [PubMed] [Google Scholar]
- Alexander GE, Moeller JR. Application of the scaled subprofile model to functional imaging in neuropsychiatric disorders: A principal component approach to modeling brain function in disease. Hum Brain Mapp. 1994;2:1–16. [Google Scholar]
- Asanuma K, Tang C, Ma Y, Dhawan V, Mattis P, Edwards C, Kaplitt MG, Feigin A, Eidelberg D. Network modulation in the treatment of Parkinson’s disease. Brain. 2006;129:2667–2678. doi: 10.1093/brain/awl162. [DOI] [PMC free article] [PubMed] [Google Scholar]
- Black KJ, Koller JM, Snyder AZ, Perlmutter JS. Template images for nonhuman primate neuroimaging: 2. Macaque NeuroImage. 2001;14:744–748. doi: 10.1006/nimg.2001.0871. [DOI] [PubMed] [Google Scholar]
- Bland JM, Altman DG. Calculating correlation coefficients with repeated observations: Part 1--Correlation within subjects. BMJ. 1995;310:446. doi: 10.1136/bmj.310.6977.446. [DOI] [PMC free article] [PubMed] [Google Scholar]
- Borghammer P, Cumming P, Aanerud J, Gjedde A. Artefactual subcortical hyperperfusion in PET studies normalized to global mean: Lessons from Parkinson’s disease. Neuroimage. 2008a doi: 10.1016/j.neuroimage.2008.07.042. [DOI] [PubMed] [Google Scholar]
- Borghammer P, Jonsdottir KY, Cumming P, Ostergaard K, Vang K, Ashkanian M, Vafaee M, Iversen P, Gjedde A. Normalization in PET group comparison studies--the importance of a valid reference region. NeuroImage. 2008b;40:529–540. doi: 10.1016/j.neuroimage.2007.12.057. [DOI] [PubMed] [Google Scholar]
- Braak H, Del Tredici K, Rub U, de Vos RA, Jansen Steur EN, Braak E. Staging of brain pathology related to sporadic Parkinson’s disease. Neurobiol Aging. 2003;24:197–211. doi: 10.1016/s0197-4580(02)00065-9. [DOI] [PubMed] [Google Scholar]
- Carbon M, Edwards C, Eidelberg D. Functional brain imaging in Parkinson’s disease. Adv Neurol. 2003a;91:175–181. [PubMed] [Google Scholar]
- Carbon M, Ghilardi MF, Feigin A, Fukuda M, Silvestri G, Mentis MJ, Ghez C, Moeller JR, Eidelberg D. Learning networks in health and Parkinson’s disease: reproducibility and treatment effects. Hum Brain Mapp. 2003b;19:197–211. doi: 10.1002/hbm.10115. [DOI] [PMC free article] [PubMed] [Google Scholar]
- Carlson JD, Pearlstein RD, Buchholz J, Iacono RP, Maeda G. Regional metabolic changes in the pedunculopontine nucleus of unilateral 6-hydroxydopamine Parkinson’s model rats. Brain Res. 1999;828:12–19. doi: 10.1016/s0006-8993(99)01268-8. [DOI] [PubMed] [Google Scholar]
- Doudet DJ, Cornfeldt ML, Honey CR, Schweikert AW, Allen RC. PET imaging of implanted human retinal pigment epithelial cells in the MPTP-induced primate model of Parkinson’s disease. Exp Neurol. 2004;189:361–368. doi: 10.1016/j.expneurol.2004.06.009. [DOI] [PubMed] [Google Scholar]
- Eckert T, Eidelberg D. Neuroimaging and Therapeutics in Movement Disorders. Neurorx. 2005;2:361–371. doi: 10.1602/neurorx.2.2.361. [DOI] [PMC free article] [PubMed] [Google Scholar]
- Eckert T, Tang C, Eidelberg D. Assessment of the progression of Parkinson’s disease: a metabolic network approach. Lancet Neurol. 2007;6:926–932. doi: 10.1016/S1474-4422(07)70245-4. [DOI] [PMC free article] [PubMed] [Google Scholar]
- Eckert T, Tang C, Ma Y, Brown N, Lin T, Frucht S, Feigin A, Eidelberg D. Abnormal metabolic networks in atypical parkinsonism. Movement Disorders. 2008;23:727–733. doi: 10.1002/mds.21933. [DOI] [PubMed] [Google Scholar]
- Eidelberg D, Moeller JR, Dhawan V, Spetsieris P, Takikawa S, Ishikawa T, Chaly T, Robeson W, Margouleff D, Przedborski S, et al. The metabolic topography of parkinsonism. J Cereb Blood Flow Metab. 1994;14:783–801. doi: 10.1038/jcbfm.1994.99. [DOI] [PubMed] [Google Scholar]
- Eidelberg D, Moeller JR, Ishikawa T, Dhawan V, Spetsieris P, Chaly T, Robeson W, Dahl JR, Margouleff D. Assessment of disease severity in parkinsonism with fluorine-18-fluorodeoxyglucose and PET. J Nucl Med. 1995;36:378–383. [PubMed] [Google Scholar]
- Eidelberg D, Moeller JR, Kazumata K, Antonini A, Sterio D, Dhawan V, Spetsieris P, Alterman R, Kelly PJ, Dogali M, Fazzini E, Beric A. Metabolic correlates of pallidal neuronal activity in Parkinson’s disease. Brain. 1997;120 (Pt 8):1315–1324. doi: 10.1093/brain/120.8.1315. [DOI] [PubMed] [Google Scholar]
- Emborg ME, Carbon M, Holden JE, During MJ, Ma Y, Tang C, Moirano J, Fitzsimons H, Roitberg BZ, Tuccar E, Roberts A, Kaplitt MG, Eidelberg D. Subthalamic glutamic acid decarboxylase gene therapy: changes in motor function and cortical metabolism. J Cereb Blood Flow Metab. 2007;27:501–509. doi: 10.1038/sj.jcbfm.9600364. [DOI] [PubMed] [Google Scholar]
- Feigin A, Kaplitt MG, Tang C, Lin T, Mattis P, Dhawan V, During MJ, Eidelberg D. Modulation of metabolic brain networks after subthalamic gene therapy for Parkinson’s disease. Proc Natl Acad Sci U S A. 2007a;104:19559–19564. doi: 10.1073/pnas.0706006104. [DOI] [PMC free article] [PubMed] [Google Scholar]
- Feigin A, Tang C, Ma Y, Mattis P, Zgaljardic D, Guttman M, Paulsen JS, Dhawan V, Eidelberg D. Thalamic metabolism and symptom onset in preclinical Huntington’s disease. Brain. 2007b;130:2858–2867. doi: 10.1093/brain/awm217. [DOI] [PMC free article] [PubMed] [Google Scholar]
- Ford I. Confounded correlations: statistical limitations in the analysis of interregional relationships of cerebral metabolic activity. J Cereb Blood Flow Metab. 1986;6:385–388. doi: 10.1038/jcbfm.1986.63. [DOI] [PubMed] [Google Scholar]
- Friston K, Chu C, Mourao-Miranda J, Hulme O, Rees G, Penny W, Ashburner J. Bayesian decoding of brain images. Neuroimage. 2008;39:181–205. doi: 10.1016/j.neuroimage.2007.08.013. [DOI] [PubMed] [Google Scholar]
- Fukuda M, Mentis MJ, Ma Y, Dhawan V, Antonini A, Lang AE, Lozano AM, Hammerstad J, Lyons K, Koller WC, Moeller JR, Eidelberg D. Networks mediating the clinical effects of pallidal brain stimulation for Parkinson’s disease: A PET study of resting state glucose metabolism. Brain. 2001;124:1601–1609. doi: 10.1093/brain/124.8.1601. [DOI] [PubMed] [Google Scholar]
- Guigoni C, Dovero S, Aubert I, Li Q, Bioulac BH, Bloch B, Gurevich EV, Gross CE, Bezard E. Levodopa-induced dyskinesia in MPTP-treated macaques is not dependent on the extent and pattern of nigrostrial lesioning. Eur J Neurosci. 2005;22:283–287. doi: 10.1111/j.1460-9568.2005.04196.x. [DOI] [PubMed] [Google Scholar]
- Habeck C, Foster NL, Perneczky R, Kurz A, Alexopoulos P, Koeppe RA, Drzezga A, Stern Y. Multivariate and univariate neuroimaging biomarkers of Alzheimer’s disease. NeuroImage. 2008;40:1503–1515. doi: 10.1016/j.neuroimage.2008.01.056. [DOI] [PMC free article] [PubMed] [Google Scholar]
- Habeck C, Krakauer JW, Ghez C, Sackeim HA, Eidelberg D, Stern Y, Moeller JR. A new approach to spatial covariance modeling of functional brain imaging data: ordinal trend analysis. Neural Comput. 2005;17:1602–1645. doi: 10.1162/0899766053723023. [DOI] [PubMed] [Google Scholar]
- Hirano S, Asanuma K, Ma Y, Tang C, Feigin A, Dhawan V, Carbon M, Eidelberg D. Dissociation of metabolic and neurovascular responses to levodopa in the treatment of Parkinson’s disease. J Neurosci. 2008;28:4201–4209. doi: 10.1523/JNEUROSCI.0582-08.2008. [DOI] [PMC free article] [PubMed] [Google Scholar]
- Huang C, Mattis P, Tang C, Perrine K, Carbon M, Eidelberg D. Metabolic brain networks associated with cognitive function in Parkinson’s disease. NeuroImage. 2007a;34:714–723. doi: 10.1016/j.neuroimage.2006.09.003. [DOI] [PMC free article] [PubMed] [Google Scholar]
- Huang C, Tang C, Feigin A, Lesser M, Ma Y, Pourfar M, Dhawan V, Eidelberg D. Changes in network activity with the progression of Parkinson’s disease. Brain. 2007b;130:1834–1846. doi: 10.1093/brain/awm086. [DOI] [PMC free article] [PubMed] [Google Scholar]
- Kaplitt MG, Feigin A, Tang C, Fitzsimons HL, Mattis P, Lawlor PA, Bland RJ, Young D, Strybing K, Eidelberg D, During MJ. Safety and tolerability of gene therapy with an adeno-associated virus (AAV) borne GAD gene for Parkinson’s disease: an open label, phase I trial. Lancet. 2007;369:2097–2105. doi: 10.1016/S0140-6736(07)60982-9. [DOI] [PubMed] [Google Scholar]
- Lin TP, Carbon M, Tang C, Mogilner AY, Sterio D, Beric A, Dhawan V, Eidelberg D. Metabolic correlates of subthalamic nucleus activity in Parkinson’s disease. Brain. 2008;131:1373–1380. doi: 10.1093/brain/awn031. [DOI] [PubMed] [Google Scholar]
- Lozza C, Marie RM, Baron JC. The metabolic substrates of bradykinesia and tremor in uncomplicated Parkinson’s disease. Neuroimage. 2002;17:688–699. [PubMed] [Google Scholar]
- Ma Y, Tang C, Spetsieris PG, Dhawan V, Eidelberg D. Abnormal metabolic network activity in Parkinson’s disease: test-retest reproducibility. J Cereb Blood Flow Metab. 2007;27:597–605. doi: 10.1038/sj.jcbfm.9600358. [DOI] [PMC free article] [PubMed] [Google Scholar]
- Moeller JR, Eidelberg D. Divergent expression of regional metabolic topographies in Parkinson’s disease and normal ageing. Brain. 1997;120:2197–2206. doi: 10.1093/brain/120.12.2197. [DOI] [PubMed] [Google Scholar]
- Moeller JR, Habeck CG. Reciprocal benefits of mass-univariate and multivariate modeling in brain mapping: applications to event-related functional MRI, H215O-, and FDG-PET. Int J Biomed Imag. 2006;2006:1–13. doi: 10.1155/IJBI/2006/79862. [DOI] [PMC free article] [PubMed] [Google Scholar]
- Moeller JR, Ishikawa T, Dhawan V, Spetsieris P, Mandel F, Alexander GE, Grady C, Pietrini P, Eidelberg D. The metabolic topography of normal aging. J Cereb Blood Flow Metab. 1996;16:385–398. doi: 10.1097/00004647-199605000-00005. [DOI] [PubMed] [Google Scholar]
- Moeller JR, Nakamura T, Mentis MJ, Dhawan V, Spetsieres P, Antonini A, Missimer J, Leenders KL, Eidelberg D. Reproducibility of regional metabolic covariance patterns: comparison of four populations. J Nucl Med. 1999;40:1264–1269. [PubMed] [Google Scholar]
- Moeller JR, Strother SC. A regional covariance approach to the analysis of functional patterns in positron emission tomographic data. J Cereb Blood Flow Metab. 1991;11:A121–135. doi: 10.1038/jcbfm.1991.47. [DOI] [PubMed] [Google Scholar]
- Moeller JR, Strother SC, Sidtis JJ, Rottenberg DA. Scaled subprofile model: a statistical approach to the analysis of functional patterns in positron emission tomographic data. J Cereb Blood Flow Metab. 1987;7:649–658. doi: 10.1038/jcbfm.1987.118. [DOI] [PubMed] [Google Scholar]
- Nakamura T, Ghilardi MF, Mentis M, Dhawan V, Fukuda M, Hacking A, Moeller JR, Ghez C, Eidelberg D. Functional networks in motor sequence learning: abnormal topographies in Parkinson’s disease. Hum Brain Mapp. 2001;12:42–60. doi: 10.1002/1097-0193(200101)12:1<42::AID-HBM40>3.0.CO;2-D. [DOI] [PMC free article] [PubMed] [Google Scholar]
- Peng S, Ma Y, Flores J, Eidelberg D, Doudet DJ. Mapping abnormal metabolic brain networks in parkinsonian macaques: a FDG PET study. J Nucl Med. 2008;49(Suppl 1):6P. [abstract] [Google Scholar]
- Petersson KM, Nichols TE, Poline JB, Holmes AP. Statistical limitations in functional neuroimaging. I. Non-inferential methods and statistical models. Philos Trans R Soc Lond B Biol Sci. 1999;354:1239–1260. doi: 10.1098/rstb.1999.0477. [DOI] [PMC free article] [PubMed] [Google Scholar]
- Schmahmann JD, Doyon J, Toga AW, Petrides M, Evans AC. MRI atlas of the human cerebellum. Academic Press; San Diego: 2000. [DOI] [PubMed] [Google Scholar]
- Spetsieris P, Ma Y, Dhawan V, Moeller JR, Eidelberg D. Highly automated computer-aided diagnosis of neurological disorders using functional brain imaging. Proc SPIE: Medical Imaging. 2006;6144:61445M61441–61412. [Google Scholar]
- Strother SC, Anderson JR, Schaper KA, Sidtis JJ, Liow JS, Woods RP, Rottenberg DA. Principal component analysis and the scaled subprofile model compared to intersubject averaging and statistical parametric mapping: I. “Functional connectivity” of the human motor system studied with [15O]water PET. J Cereb Blood Flow Metab. 1995;15:738–753. doi: 10.1038/jcbfm.1995.94. [DOI] [PubMed] [Google Scholar]
- Tang C, Eckert T, Dhawan V, Eidelberg D. Parkinson’s disease: evidence for a short metabolic preclinical period. Neurology. 2008;70:A436. [abstract] [Google Scholar]
- Trošt M, Su S, Su P, Yen RF, Tseng HM, Barnes A, Ma Y, Eidelberg D. Network modulation by the subthalamic nucleus in the treatment of Parkinson’s disease. NeuroImage. 2006;31:301–307. doi: 10.1016/j.neuroimage.2005.12.024. [DOI] [PMC free article] [PubMed] [Google Scholar]
- Wichmann T, DeLong MR. Functional neuroanatomy of the basal ganglia in Parkinson’s disease. Adv Neurol. 2003;91:9–18. [PubMed] [Google Scholar]