Abstract
Intermediate conductance, calcium-activated potassium channels are gated by the binding of intracellular Ca2+ to calmodulin, a Ca2+-binding protein that is constitutively associated with the C terminus of the channel. Although previous studies indicated that the pore-lining residues along the C-terminal portion of S6 contribute to the activation mechanism, little is known about whether the nonluminal face of S6 contributes to this process. Here we demonstrate that the sulfhydral reagent, parachloromercuribenze sulfonate (PCMBS), modifies an endogenous cysteine residue predicted to have a nonluminal orientation (Cys276) along the sixth transmembrane segment (S6). Modification of Cys276 manipulates the steady-state and kinetic behavior of the channel by shifting the gating equilibrium toward the open state, resulting in a left shift in apparent Ca2+ affinity and a slowing in the deactivation process. Using a six-state gating scheme, our analysis shows that PCMBS slows the transition between the open state back to the third closed state. Interpreting this result in the context of the steady-state and kinetic data suggests that PCMBS functions to shift the gating equilibrium toward the open state by disrupting channel closing. In an attempt to understand whether the nonluminal face of S6 participates in the activation mechanism, we conducted a partial tryptophan scan of this region. Substituting a tryptophan for Leu281 recapitulated the effect on the steady-state and kinetic behavior observed with PCMBS. Considering the predicted nonluminal orientation of Cys276 and Leu281, a simple physical interpretation of these results is that the nonluminal face of S6 forms a critical interaction surface mediating the transition into the closed conformation, suggesting the nonluminal C-terminal portion of S6 is allosterically coupled to the activation gate.
INTRODUCTION
Proteins are inherently dynamic structures. Regulating the transition between conformational states is critical for proper function and, on a larger scale, maintaining control of a multitude of physiological processes. Ion channels are one class of protein that exemplifies this connection between structure and function, since switching between open and closed states controls a whole host of physiological responses. In this study, we probe the nature of these transitions and how they are controlled by external factors in the Ca2+-activated potassium channel (KCa3.1) (Ishii et al., 1997; Joiner et al., 1997). KCa3.1 is composed of four subunits, each having six transmembrane domains (S1–S6) with a pore domain located between S5 and S6. Channel activation is mediated through a Ca2+-dependent gating mechanism, which is dependent on the coassembly of channel α-subunit with calmodulin (CaM) (Xia et al., 1998). CaM, a Ca2+-binding protein, is constitutively bound to the channel’s CaM-binding domain (CaMBD) located in the C terminus, just distal to S6. Upon binding of Ca2+ to CaM, the CaM/CaMBD undergoes a conformational change, which is coupled to the pore, enabling the channel to transition from a nonconducting to a conducting configuration (Keen et al., 1999; Li et al., 2009). This association allows CaM to behave as an intracellular Ca2+ sensor, coupling changes in intracellular Ca2+ concentration to the regulation of channel activity. The unique association with CaM allows this channel to regulate the molecular signaling mechanisms underlying the control of vascular tone (Fleming, 2006). In vascular endothelium, cell stimulation initiates an increase in intracellular Ca2+ (Ca2+i). Increasing Ca2+i activates KCa3.1, resulting in endothelial cell hyperpolarization, a requirement for the initiation of the endothelial derived hyperpolarizing factor (EDHF) response (Bolton et al., 1984). The activation of this EDHF pathway ultimately results in the hyperpolarization of adjacent vascular smooth muscle cells, which enables subsequent arteriolar dilation and decrease in vascular tone (Feletou, 2009; Feletou and Vanhoutte, 2009).
Activation of the EDHF pathway and subsequent regulation of vascular tone is dependent on tight regulation of KCa3.1 channel activity. Although little is understood regarding the coupling mechanism in these channels, the C-terminal portion of S6 is thought to transform the activation energy from the CaM/CaMBD into a mechanical force to alter the conformational state of the pore (Schumacher et al., 2001, 2004; Simoes et al., 2002; Klein et al., 2007; Garneau et al., 2009). The first investigation examining the pore architecture of KCa3.1 used the substituted cysteine accessibility method to identify a region within S6 that is expected to contribute to the lumen (V275-V282) and a second region expected to participate in the activation mechanism (A283-A286) (Simoes et al., 2002). Additionally, it has been suggested that in the closed conformation, the cytoplasmic ends of S6 do not function as a barrier to the movement of K+ ions (Klein et al., 2007) as it does in KcsA (Doyle et al., 1998). Rather, the activation gate is suggested to be located at or near the selectivity filter, with the C-terminal portion of S6 (V282-A286) participating in the activation mechanism (Simoes et al., 2002; Klein et al., 2007; Garneau et al., 2009). However, in contrast to the previous investigations, which determined the role of cysteines engineered along the luminal face of S6, we observe that the nonluminal face of S6 also participates in the activation mechanism. Cys276 and Leu281 are predicted to have a nonluminal orientation, and our results suggest that perturbations at these positions, using either parachloromercuribenze sulfonate (PCMBS) (Cys276) or tryptophan substitution (Trp281), shifts the gating equilibrium toward the open conformation. Activation and deactivation kinetics, as measured by Ca2+ jump experiments, are markedly slowed, suggesting that perturbing these positions disrupts a transition that is allosterically coupled to the activation gate. Therefore, our results indicate the transition of KCa3.1 to the closed conformation is dependent on the interaction surface formed by the nonluminal face of S6, specifically the C-terminal portion of the helix. Results from our kinetic analysis indicate that PCMBS and L281W disrupt channel behavior through a common mechanism by manipulating the transition from the open state back to the third and final closed state. Our results, together with previous investigations, lead us conclude that the luminal and nonluminal faces of the C-terminal portion of S6 actively function to couple the conformational changes in the CaM/CaMBD to the pore, thus permitting the channel to transition from a nonconducting to a conducting conformation.
MATERIALS AND METHODS
Molecular biology
KCa3.1 (hIK1) cDNA was provided by J.P. Adelman (Oregon Health Sciences University, Portland, OR). The cDNA was subcloned into pcDNA3.1(+) (Invitrogen) using the EcoRI and XhoI restriction sites. All mutations were generated using the Agilent Technologies QuikChange site-directed mutagenesis strategy. The fidelity of all constructs used in this study were confirmed by sequencing (ABI PRISM 377 automated sequencer, University of Pittsburgh) and subsequent sequence alignment (National Center for Biotechnology Information BLAST) using GenBank/EMBL/DDBJ accession no. AF022150.
Cell culture
Human embryonic kidney (HEK293) cells were obtained from the American Type Culture Collection and cultured in Dulbecco’s modified Eagle’s medium (Invitrogen) supplemented with 10% fetal bovine serum and 1% penicillin-streptomycin in a humidified 5% CO2/95% O2 incubator at 37°C. Cells were transfected using LipofectAMINE 2000 (Invitrogen) according to the manufacturer’s instructions. Stable cell lines were generated for all constructs by subjecting cells to antibiotic selection (1 mg/ml G418). Note that clonal cell lines were not subsequently selected from this stable population to avoid clonal variation.
Electrophysiology
The effects of PCMBS on KCa3.1 were assessed with inside-out patch-clamp experiments as a functional assay. Currents were recorded using an Axopatch 200B amplifer (Axon Instruments, Inc.). During patch-clamp experiments, the bath solution contained 145 mM potassium-gluconate, 5 mM KCl, 1.3 mM MgCl2, 10 mM HEPES, 1 mM EGTA, and 300 µM ATP (pH adjusted to 7.2 with KOH). Sufficient CaCl2 was added to obtain the desired free Ca2+ concentration (program provided by D. Dawson, Oregon Health Sciences University) and applied to the intracellular surface of the patch through a rapid solution exchanger (RSC-160; Biological). To obtain a Ca2+-free bath solution, EGTA (1 mM) was added without CaCl2 (estimated free Ca2+ <10 nM). Electrodes were fabricated from thin-walled borosilicate glass (World Precision Instruments), pulled on a vertical puller (Narishige), fire polished, and had a resistance of 1–5 MΩ. The pipette solution was 140 mM potassium-gluconate, 5 mM KCl, 1 mM MgCl2, 10 mM HEPES, and 1 mM CaCl2 (pH adjusted to 7.2 with KOH). All experiments were performed at room temperature. All patches were held at a holding potential of −100 mV. The voltage is referenced to the extracellular compartment, as is the standard method for membrane potentials. Inward currents are defined as the movement of positive charge from the extracellular compartment to the intracellular compartment and are presented as downward deflections from the baseline in all recordings. Ionic currents were low-pass filtered at 2 kHz by using an AxoPatch 200B amplifier and digitized at 5 kHz using a Digidata 1322A interfaced with a PC computer running pCLAMP 9.2 software (all instruments including software; Axon Instruments, Inc.). Currents were analyzed using Clampfit 9.2 (Axon Instruments, Inc.) and Biopatch software (version 3.3, Bio-logic).
Variance analysis
Macroscopic membrane patches were excised into 10 µM Ca2+, after which a complete Ca2+ concentration response experiment was performed (see Fig. 2 A for specific details). At the end of the Ca2+ concentration response experiment, PCMBS (500 µM) was added to the 10 µM Ca2+ concentration, and the experiment continued until the current reached a second steady-state PCMBS-mediated maximum current level. The total current record, to be used for variance analysis, was divided into 250 episodes, and mean current 〈I〉 and variance (σ2) were calculated for each episode using Channelab Software (Synaptosoft Inc.). The increase in channel open probability (Po), mediated through PCMBS, was estimated by determining the difference between the Po(max) value in the presence and absence of PCMBS. Furthermore, the number of channels (N) in the patch and single channel amplitude (i) are obtained by fitting the σ2 against 〈I〉 distribution to Eq. 1:
| (1) |
The Po(max) can then be calculated using Eq. 2:
| (2) |
where Imax is the maximum current observed and i and N are the mean values for single channel amplitude and number of channels calculated from Eq. 1. The product of i and N would give the theoretical current at Po = 1, hence, channel Po can be calculated at any given current as a proportion of Po(max) (Sigworth, 1980).
Figure 2.
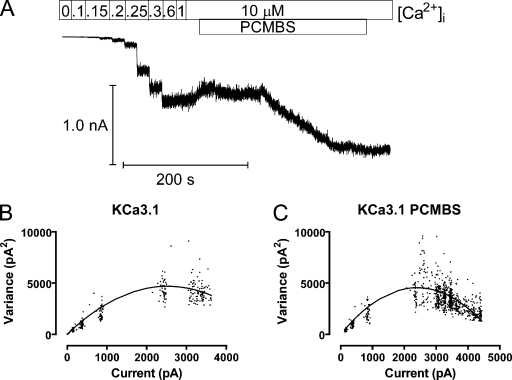
PCMBS increases steady-state Po(max). Variance analysis of KCa3.1 channel current was used to estimate Po(max), N, and i in the absence and presence of PCMBS. (A) Representative Ca2+ concentration response experiment recorded from inside-out macropatches expressing KCa3.1 channels. Patches were initially excised in 10 µM Ca2+i, followed by a series of Ca2+i concentrations (0, 0.1, 0.15, 0.2, 0.25, 0.3, 0.6, 1.0, and 10 µM) applied for 10-s intervals using a fast solution exchanger. After establishing steady-state current in 10 µM Ca2+i, PCMBS (500 µM) was added to the bath solution until reaching a second, steady-state, current level. (B) Variance analysis to determine Po(max), N, and i in the absence of PCMBS. Plot of variance (σ2), which was calculated from the portion of the record excluding the time when PCMBS was added, against mean current 〈I〉 as fit with Eq. 1 (solid line), and Po(max) was calculated using Eq. 2: Po(max) = 0.61, n = 1,071, and i = 3.5 pA. (C) Variance analysis to determine Po(max), N, and i in the presence of PCMBS. Plot of σ2, which was calculated from the entire record against 〈I〉 was fit with Eq. 1 (solid line), and Po(max) was calculated using Eq. 2: Po(max) = 0.91, n = 1,078, and i = 3.4 pA.
Ca2+ jump experiments
Macroscopic membrane patches expressing KCa3.1 were excised from HEK293 cells and intracellular solution was quickly switched using a rapid solution exchanger (RSC-160; Biological). To estimate the kinetics of activation and deactivation, the protocol requires that the internal solution be alternated between a Ca2+-free solution for 3 s and a series of Ca2+-containing solutions (concentrations reported in the results section) for 1.5 s with a 5-ms interval between switches. Activation and deactivation currents were recorded, superimposed, and averaged using Clampfit 9.2 (Axon Instruments, Inc.) software. Time constants describing channel activation and deactivation kinetics were determined by fitting the activation and deactivation current records with a standard single exponential function. The deactivation kinetics were well described using a single exponential. However, the activation kinetics were sigmodal in shape, due to the delay in channel activation, and not well described with a single exponential function. This delayed response in channel activation can be explained through two factors. The first factor is based upon the volume of solution that must be exchanged between the surface of the patch and the tip of the patch pipette. The larger the volume, the longer it takes for a complete solution exchange, thus increasing the duration of the delay in channel activation. Because this factor is dictated by the size and positioning of the membrane relative to the tip of the pipette, this will vary between patches and for these purposes is considered rate limiting. The second factor contributing to the delay in channel activation is the multiple (two or more) transitions the channel must pass through before entering the open state (Zagotta et al., 1994). Assuming the number of conformational transitions along the activation pathway is equal between channels, this factor can be considered constant across all experiments. Therefore, these two factors summed together manifest as the delay in channel activation. However, we failed to notice a correlation between the duration of delay in channel activation verses Ca2+ concentration and thus no further effort was made to analyze this component in the context of channel activation kinetics. Therefore, when fitting the current record to estimate activation kinetics, the delay in channel activation was disregarded, which left the remaining portion of the current recording that is well described by a single exponential function (Smith-Maxwell et al., 1998).
Modeling
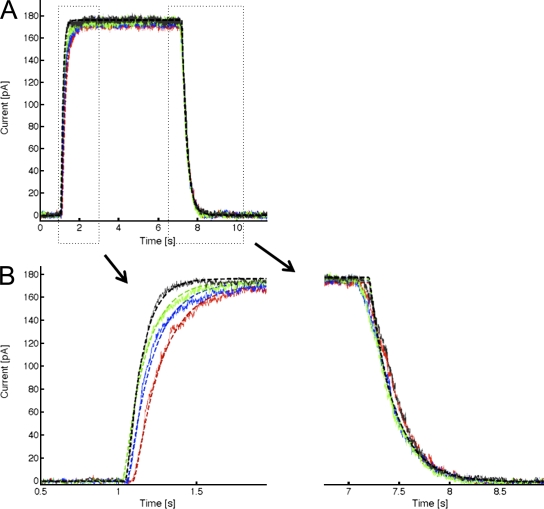
The six-state kinetic model illustrated in Fig. 10 A was solved numerically to quantify how PCMBS perturbs the gating of KCa3.1 and to understand the overall contribution of S6 to the Ca2+-dependent gating mechanism. Forward and reverse rate constants are labeled according to the channel state such that kij is the rate of going from state i to state j. Thus, the model has 10 rate constants k12, k23, k34, k35, and k46 are the forward rate constants, and k21, k32, k43, k53, and k64 are the reverse rate constants. The Ca2+-dependent transitions are represented by the forward rate constants k12, k23, and k34, and all other transitions are assumed to be Ca2+ independent. We explored two versions of the model with regard to the Ca2+ dependence of these rate constants. First, we constructed a model in which the rate of Ca2+ binding varied linearly with Ca2+ concentration, k = A · [Ca], where A is a constant as proposed for KCa2.3 (Hirschberg et al., 1998). Second, we constructed a model in which the rate of Ca2+ binding varied nonlinearly with Ca2+ concentration, k = A · [Ca]/(B + [Ca]), where A and B are constants. The second rate takes the form of a Michaelis-Menten equation in which the rate of binding saturates at high Ca2+i as further discussed in the results section. We used an 11th independent variable, N, to scale the single channel current resulting from the model to match macroscopic experimental currents. Thus, N represents the number of active channels in the patch. For a particular set of rate constants, we solved the system of equations corresponding to Fig. 10 A using a stiff solver routine in Matlab (7.6). We then calculated the root mean square difference between the simulated channel current and the experimentally recorded trace. Next, we used a Nelder-Mead search algorithm to search through parameter space in an attempt to minimize the root mean square difference (Press, 2007). A typical search involved solving the model 50,000 times for each Ca2+ concentration. Furthermore, the search algorithm was rerun on each dataset several times in an attempt to thoroughly explore parameter space for the best fit. This entire procedure was performed for datasets recorded in the absence or presence of PCMBS to identify the transitions modulated by this compound.
Figure 10.
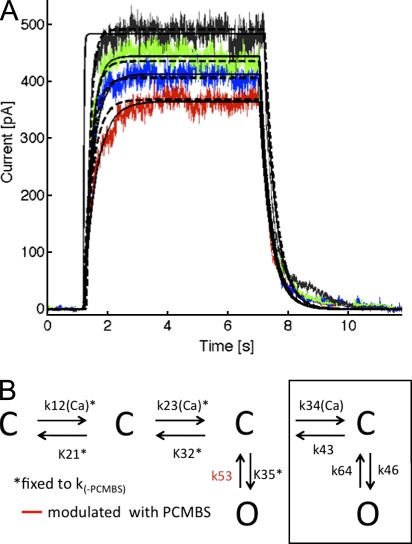
A four-state model can be used to fit the activation and deactivation kinetics for KCa3.1. (A) Gating scheme used to describe the activation and deactivation kinetics of KCa3.1. The six-state model is comprised of four closed states and two open states, with forward transitions between closed states being Ca2+ dependent and all other transitions being Ca2+ independent. The box outline represents the states that are not necessary to fit the activation and deactivation kinetics as determined through sensitivity analysis (Table S1). (B) Representative activation and deactivation records fit with two variations of the model shown in A. Activation and deactivation currents were recorded and fit according to the protocol described in the Materials and methods sections. The colors refer to the different Ca2+ concentrations, with red representing 0.5, blue 0.7, green 1.0, and black 10 µM Ca2+. The solid line represents the fit assuming Ca2+-dependent rate constants have a linear dependence on Ca2+ concentration, k = A · [Ca]. The dashed line represents the fit assuming Ca2+-dependent rate constants have a nonlinear dependence on Ca2+ concentration, k = A · [Ca]/(B + [Ca]). Rate constants derived from the fit are summarized in Table II. (C) The model can be used to predict the shift in apparent Ca2+ affinity with PCMBS. Plot of normalized 〈I〉 current against the corresponding Ca2+i for KCa3.1 and KCa3.1+PCMBS. The symbols represent the experimental data (KCa3.1, ◆, and KCa3.1+PCMBS, ■), which is plotted against the predicted apparent Ca2+ affinity (KCa3.1, solid line) and (KCa3.1+PCMBS, dashed line). Model prediction: KCa3.1, EC50 = 540 nM, and KCa3.1+PCMBS, EC50 = 280 nM. Experimental observation: KCa3.1, EC50 = 508 nM, and KCa3.1+PCMBS, EC50 = 235 nM.
The six-state scheme was also used to predict the apparent Ca2+ affinity and shift in apparent affinity observed with PCMBS. Channel Po was calculated from the model over the range of experimentally measured Ca2+ concentrations, and the corresponding EC50 was extracted from the resulting curve. We determined channel Po at each Ca2+i concentration by running the model to steady state and dividing the probability of being in the open state (states 5 and 6) by the total probability (sum of states 1 through 6).
Sensitivity analysis
To determine which parameters were most critical for fitting the data, we varied each rate constant by ±10%, reran the model, and calculated the percent change in the error. This analysis was only performed on the final set of parameter values that produced the best fit for any given condition.
Structural modeling
We constructed a homology model of the pore domain of KCa3.1 with Modeller 9v7 (Sali and Blundell, 1993) using Kv1.2 (PBD ID 2A79) and KcsA (PDB ID 1BL8) as a template structure.
Hill equation
Ca2+ concentration response experiments were plotted as normalized current (I/Imax) against the corresponding Ca2+ concentration p[Ca2+],M and were fit with the following version of the Hill equation: I = Imin + (Imax − Imin)/(1 + 10((LogEC50-X)*HillSlope)). Fitting was performed using Prizm (GraphPad Software, Inc.).
Chemicals
All chemicals were obtained from Sigma-Aldrich, unless otherwise stated. Adenosine-5′-triphosphate obtained from Roche and PCMBS from Toronto Research Chemicals Inc. were freshly made on the day of the experiment and added directly to the bath solution before the experiment.
Online supplemental material
The results from the sensitivity analysis are available online (Table S1) as an individual table for each dataset. Online supplemental material is available at http://www.jgp.org/cgi/content/full/jgp.201010430/DC1.
RESULTS
PCMBS can be used as a probe to modulate KCa3.1 gating
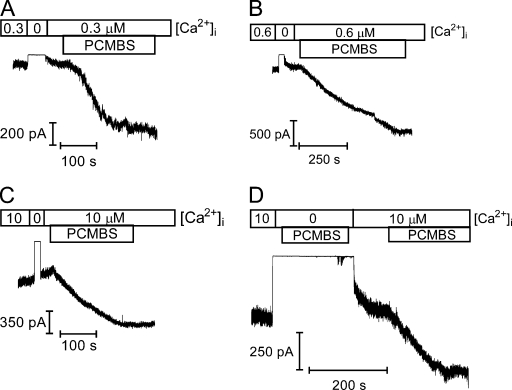
It was previously demonstrated that [2-(trimethylammonium)]methanethiosulfonate bromide only transiently inhibits WT-KCa3.1 steady-state behavior (Simoes et al., 2002). Therefore, we wanted to determine whether PCMBS could alter steady-state current in excised membrane patches expressing KCa3.1. As shown in Fig. 1 (A–C), addition of PCMBS (500 µM) to the membrane patch increased channel activity at 0.3 µM (A), 0.6 µM (B), and 10 µM (defined as saturating) Ca2+i concentrations. Furthermore, the effect of PCMBS could not be reversed upon washout, suggesting a covalent interaction between channel cysteine(s) and the sulfhydral-reactive compound. To address whether PCMBS could activate KCa3.1 in the absence of Ca2+i, experiments were performed in which PCMBS (500 µM) was added after the addition of a Ca2+-free bath solution. As shown in Fig. 1 D, PCMBS is unable to activate KCa3.1 in the absence of Ca2+i, demonstrating that the compound potentiates channel current rather than directly activating the channel. Only after the addition of Ca2+i can PCMBS increase steady-state current, suggesting the closed conformation prevents PCMBS from accessing the endogenous cysteine residue(s). Our results illustrate that PCMBS can covalently bind to endogenous cysteine residue(s), and these residue(s) must reside within a gating-sensitive region of the channel.
Figure 1.
PCMBS increases KCa3.1 steady-state current. Macroscopic current records from KCa3.1 channels heterologously expressed in HEK cells to determine sensitivity to PCMBS. PCMBS (500 µM) was added to inside-out patches excised in 0.3 (A), 0.6 (B), and 10 µM (C) Ca2+i after the establishment of steady-state current level. PCMBS washout lasted at least 1 min to ensure channel activation was due to covalent binding, rather than an indirect interaction between channel and compound. (D) KCa3.1 current record demonstrating that PCMBS cannot activate the channel in the absence of Ca2+i. PCMBS can only increase current when the channel is in the open state. The patch was initially excised in 10 µM Ca2+i, followed by the addition of a Ca2+i-free solution, and then a Ca2+i-free solution+PCMBS (500 µM) was added to the bath solution. PCMBS+Ca2+i-free solution was washed out with 10 µM Ca2+i to reactivate the channel. After reaching a steady-state current level, PCMBS (500 µM) was reapplied to the patch, resulting in channel activation.
Characterization of potentiation by PCMBS
To gain insight into the mechanism by which PCMBS activates KCa3.1, we determined whether PCMBS increases steady-state current through an increase in N, Po, or i using variance analysis, as described in the Materials and methods section. Fig. 2 A depicts a representative current record in which a series of Ca2+i concentrations were applied to the intracellular face of an inside-out patch expressing KCa3.1 channels, and after establishment of steady-state current in 10 µM Ca2+i, PCMBS (500 µM) was added to the bath. This current record was used to calculate σ2 both in the absence (portion of the record excluding PCMBS) and presence (entire record) of PCMBS. Plotting σ2 against 〈I〉 and fitting this relationship with Eq. 1 gave estimates of N, Po, and i (Fig. 2, B and C). Analysis of these data indicate that potentiation results from a 50% increase in Po(max) (from 0.61 to 0.91 in PCMBS) rather than changes to N (1071 versus 1078 in PCMBS) or i (3.5 pA versus 3.4 pA in PCMBS). Analysis of multiple experiments (n = 12) revealed that PCMBS increases Po(max) from 0.65 ± 0.03 to 0.93 ± 0.02 without an increase in N or i (3.3 ± 0.03 pA versus 3.3 ± 0.03 pA in PCMBS). Given the variability of N across patches, its average was not calculated. These data suggest that PCMBS acts through a Ca2+-independent pathway to increase steady-state current through an increase in Po(max).
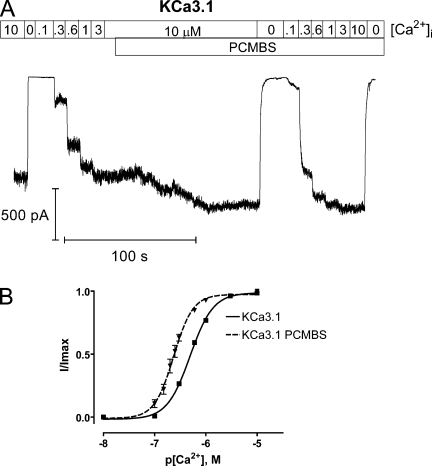
Importantly, the steady-state current increase observed in saturating Ca2+ would mask any increase in channel activation occurring through a Ca2+-dependent pathway. Therefore, to determine whether PCMBS also affects the Ca2+-dependent pathway, we measured the apparent Ca2+ affinity in the absence and presence of PCMBS as shown in Fig. 3 A. This figure illustrates that PCMBS induced a significant current potentiation between 0.1 and 0.3 µM Ca2+i compared with the equivalent current increase in the absence of the compound. These data were fit to a version of the Hill equation, Fig. 3 B, demonstrating a PCMBS-dependent shift in the EC50 from 508 ± 13 nM (n = 57) to 235 ± 17 nM (n = 6) without altering the Hill coefficient (2.0 ± 0.2 and 2.5 ± 0.2). These results indicate that PCMBS increases channel activation through both Ca2+-independent and -dependent pathways, reflected by an increase in Po(max) and a shift in apparent Ca2+ affinity, respectively.
Figure 3.
PCMBS shifts apparent Ca2+ affinity. Complete Ca2+ concentration response experiments were performed to estimate EC50 and the Hill coefficient (h) in the absence and presence of PCMBS. (A) Representative macroscopic current record from an inside-out patch–expressing KCa3.1 channels. The patch was excised in 10 µM Ca2+i followed by a series of Ca2+i concentrations beginning with 0, 0.1, 0.3, 0.6, 1.0, 3.0, and 10 µM Ca2+i , all applied in 10-s intervals using a rapid solution exchanger. After the current reached a steady-state level, PCMBS (500 µM) was added, and a second Ca2+i concentration response experiment was performed using the above Ca2+i concentrations in the presence of PCMBS. (B) Plot of normalized 〈I〉 current against the corresponding Ca2+i for KCa3.1 (■) and KCa3.1+PCMBS (▾) fit with a variation of the Hill equation (see Materials and methods). This analysis gave estimates for KCa3.1 (solid line, n = 57), EC50 = 508 ± 13 nM and h = 2.0 ± 0.2, and KCa3.1+PCMBS (dashed line, n = 6), EC50 = 235 ± 17 nM and h = 2.5 ± 0.2. All experiments were done in pairs, but an alternate set of Ca2+i concentrations (0.1, 0.15, 0.2, 0.25, 0.3, 0.6, 1.0, and 10 µM) were used when estimating EC50 and h for KCa3.1+PCMBS. Error bars represent SEM. The error bars for KCa3.1 are smaller than the symbols (■).
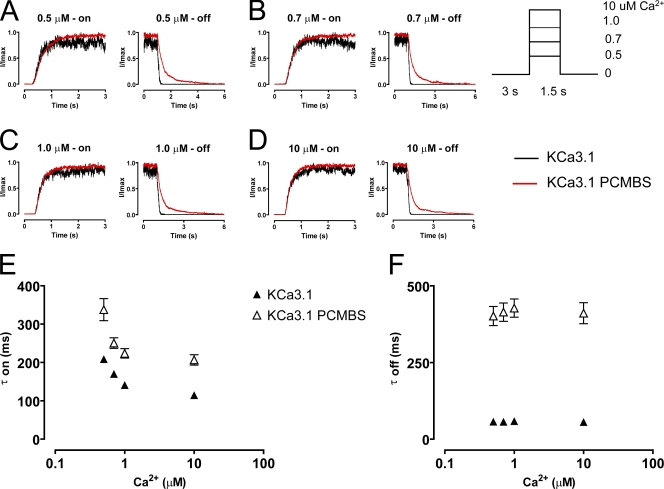
Our results suggest that PCMBS shifts the gating equilibrium toward the open state, which we expect to be manifested as a change in the activation or deactivation kinetics of the channel. To determine which of these kinetic steps is being modified, we measured the kinetics of channel activation and deactivation in the absence and presence of PCMBS. The patch was excised in 10 µM Ca2+i, after which Ca2+i was rapidly switched between a Ca2+-free solution and a Ca2+i solution, as depicted in the inset of Fig. 4. After 5–10 complete cycles (one cycle consists of taking measurements using 0.5 [A], 0.7 [B], 1.0 [C], and 10 [D] μM Ca2+i), PCMBS was added to the bath solution and the protocol was repeated. Because PCMBS increases current at all Ca2+ concentrations, current recordings were normalized to the maximum current level to compare channel kinetics in the absence and presence of PCMBS. Additionally, current records for each Ca2+i concentration were superimposed and averaged to produce the representative current records shown in Fig. 4 (A–D). Time constants (τ) for channel activation and deactivation were determined from fits of the data to a single exponential and reported in Fig. 4 (E and F), see also Table I. As shown, the data demonstrate that the activation kinetics are Ca2+ dependent, becoming faster with increased Ca2+i concentration, whereas the deactivation kinetics are Ca2+ independent, being insensitive to changes in Ca2+i concentration. The addition of PCMBS, Fig. 4 (A–D) results in a sixfold increase in the time constant for deactivation (Fig. 4 F) with only moderate effects on the time course for activation (Fig. 4 E, see also Table I).
Figure 4.
PCMBS modulates channel kinetics. Activation and deactivation kinetics were estimated with Ca2+ jump experiments in the absence and presence of PCMBS. A rapid solution exchanger was used to quickly alternate between a Ca2+i-free solution and one of four Ca2+i solutions: (A) 0.5, (B) 0.7, (C) 1.0, and (D) 10 µM Ca2+i according to the protocol illustrating one complete Ca2+ cycle shown in the inset of this figure. 5–10 complete Ca2+ cycles were recorded from a single patch in the absence and presence of PCMBS (500 µM). Activation and deactivation sweeps in the absence of PCMBS (black trace) were collected and averaged according to their respective Ca2+ concentration and superimposed against the corresponding PCMBS sweep (red trace). Current traces were normalized to the max current level, facilitating comparison of time courses between KCa3.1 and KCa3.1+PCMBS. Activation (E) and deactivation (F) rates were estimated by fitting activation and deactivation records with an exponential function and reported as a time constant (τ-on and τ-off) in the absence (▴) and presence (▵) of PCMBS, see also Table I.
Table I.
Exponential fits comparing the activation and deactivation kinetics of KCa3.1
| Channel | [Ca2+]i | On | Off | n | PCMBS | ||
| On | Off | n | |||||
| μM | ms | ms | ms | ms | |||
| KCa3.1 (paired) | 0.5 | 224 ± 22 | 61 ± 5 | 13 | 337 ± 29 | 402 ± 31 | 13 |
| 0.7 | 185 ± 11 | 60 ± 5 | 13 | 250 ± 14 | 414 ± 30 | 13 | |
| 1.0 | 147 ± 9 | 65 ± 4 | 13 | 224 ± 12 | 428 ± 30 | 13 | |
| 10 | 123 ± 11 | 59 ± 4 | 13 | 206 ± 13 | 411 ± 34 | 13 | |
| KCa3.1 C276A | 0.5 | 211 ± 20 | 48 ± 4 | 7 | 191 ± 12 | 60 ± 8 | 7 |
| 0.7 | 186 ± 15 | 46 ± 4 | 7 | 154 ± 13 | 57 ± 6 | 7 | |
| 1.0 | 142 ± 15 | 56 ± 3 | 7 | 134 ± 12 | 61 ± 6 | 7 | |
| 10 | 120 ± 11 | 43 ± 3 | 7 | 103 ± 6 | 59 ± 6 | 7 | |
| KCa3.1 C277A | 0.5 | 244 ± 10 | 54 ± 6 | 6 | 318 ± 20 | 377 ± 45 | 5 |
| 0.7 | 186 ± 9 | 59 ± 6 | 6 | 262 ± 18 | 336 ± 46 | 5 | |
| 1.0 | 152 ± 8 | 59 ± 5 | 6 | 223 ± 19 | 365 ± 44 | 5 | |
| 10 | 129 ± 12 | 59 ± 7 | 6 | 194 ± 14 | 332 ± 39 | 5 | |
| KCa3.1 | 0.5 | 209 ± 9 | 57 ± 2 | 51 | |||
| 0.7 | 170 ± 5 | 57 ± 2 | 51 | ||||
| 1.0 | 141 ± 5 | 59 ± 2 | 51 | ||||
| 10 | 114 ± 5 | 56 ± 2 | 51 | ||||
| KCa3.1 L281W | 0.5 | 149 ± 12 | 186 ± 11 | 23 | 175 ± 20 | 267 ± 20 | 8 |
| 0.7 | 130 ± 9 | 202 ± 11 | 23 | 142 ± 17 | 278 ± 24 | 8 | |
| 1.0 | 119 ± 10 | 198 ± 9 | 23 | 119 ± 13 | 293 ± 27 | 8 | |
| 10 | 92 ± 7 | 197 ± 9 | 23 | 100 ± 10 | 288 ± 27 | 8 | |
| KCa3.1 V282W | 0.5 | 161 ± 11 | 59 ± 3 | 13 | |||
| 0.7 | 131 ± 8 | 59 ± 2 | 13 | ||||
| 1.0 | 113 ± 8 | 59 ± 3 | 13 | ||||
| 10 | 84 ± 5 | 58 ± 3 | 13 | ||||
Time constants (τ) from single exponential fits to channel activation or deactivation records from the four [Ca2+]i concentrations examined.
Cysteine 276 confers PCMBS sensitivity to KCa3.1 potentiation
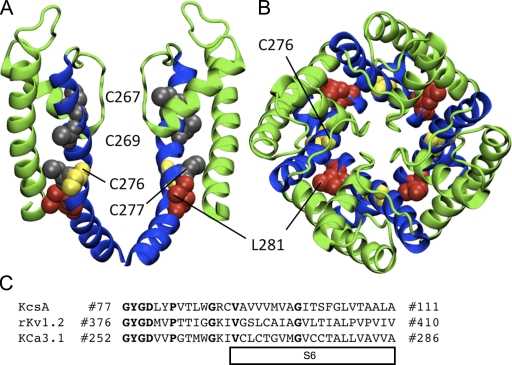
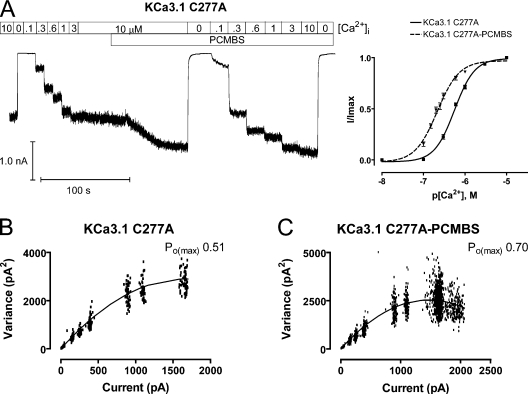
Potentiation by PCMBS is the result of cysteine modification, and KCa3.1 contains nine endogenous cysteines residues. Fig. 5 A illustrates a model of the pore region for the open state of KCa3.1 obtained by homology modeling using the rKv1.2 channel structure (Long et al., 2005). This model shows that the four endogenous cysteine residues (267, 269, 276, and 277) are located along S6, making these residues likely candidates for conferring PCMBS sensitivity. To isolate the residue(s) responsible for the PCMBS-mediated potentiation, each cysteine was mutated to an alanine and the effect of PCMBS determined. However, C267A and C269A failed to produce macroscopic currents, preventing their assessment in PCMBS-mediated channel potentiation. Therefore, we tested whether PCMBS (500 µM) could potentiate current in the C276A and C277A constructs. A representative Ca2+ concentration response experiment for C277A is shown in Fig. 6 A. PCMBS increases steady-state current in 10 µM Ca2+i (left), in addition to causing a left shift in apparent Ca2+ affinity (right). Furthermore, washout of PCMBS does not reverse the increase in current (unpublished data), demonstrating that PCMBS still covalently binds to the channel. We confirm through variance analysis (Fig. 6, B and C) that the steady-state current increase in saturating Ca2+i is the result of an increase in Po(max) (see figure legend for details). Additionally, the C277A mutation did not alter the apparent Ca2+ affinity or the Po(max) relative to the WT channel, suggesting the increase in C277A activation is due to the binding of PCMBS and not to the mutation having an indirect effect on channel gating. In total, these results demonstrate the PCMBS-mediated channel activation does not require Cys277.
Figure 5.
Homology model of the pore region for the open state of KCa3.1 using the rKv1.2 structure. (A) Representation of the S5-P-helix-S6 region viewed as a profile illustrating the predicted orientation of Cys267, Cys269, Cys277 (all in gray), Cys276 (yellow), and Leu281 (red). Only two of the four subunits are shown for clarity. (B) Representation of the S5-P-helix-S6 region from the extracellular entrance showing the predicted nonluminal orientation of Cys276 (yellow) and Leu281 (red). The S5 and P-helix are colored green and the S6 helix is colored blue. All residues are illustrated in VDW format. (C) Sequence alignment used for the homology model of KCa3.1 in the open state (rKv1.2) and the closed state (KcsA model illustrated in Fig. 15). Bold font represents homologous amino acids used as a guide to align sequences.
Figure 6.
PCMBS increases channel activation for KCa3.1 C277A. Ca2+ concentration response experiments and variance analysis were undertaken to determine whether PCMBS increases C277A channel activation in the same manner observed for the WT channel. (A, left) Representative macroscopic current record from an inside-out patch expressing KCa3.1 C277A channels. All experiments were performed using the Ca2+ concentraiton response protocol described in Fig. 3. (A, right) Plot of normalized 〈I〉 current against the corresponding [Ca2+]i for KCa3.1 C277A (■) and KCa3.1 C277A+PCMBS (▾). All analysis was performed according to the protocol described in Fig. 3 to give averages: KCa3.1 C277A (solid line, n = 15), EC50 = 566 ± 24 nM and h = 1.9 ± 0.1, and KCa3.1 C277A+PCMBS (dashed line, n = 7), EC50 = 220 ± 14 nM and h = 1.7 ± 0.2. Error bars represent SEM. (B) Variance analysis as described in Fig. 2 to determine Po(max), N, and i in the absence of PCMBS: Po(max) = 0.51, n = 954, and i = 3.5 pA. (C) Variance analysis as described in Fig. 2 to determine Po(max), N, and i in the presence of PCMBS Po(max) = 0.70, n = 849, and i = 3.5 pA. Analysis of multiple patches (n = 6) indicates that PCMBS increases Po(max) from 0.55 ± 0.02 to 0.84 ± 0.03 without increasing N or i (3.8 ± 0.1 pA versus 3.9 ± 0.1 in PCMBS).
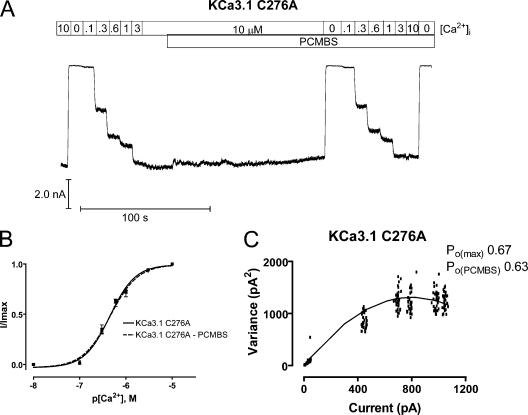
In contrast to the C277A mutation, C276A (Fig. 7 A) completely eliminated both the shift in apparent affinity (Fig. 7 B) and the increase of steady-state current in saturating Ca2+i (Fig. 7 C, see figure legend for details). Additionally, the C276A mutation did not alter the apparent Ca2+ affinity or the Po(max) relative to the WT channel, suggesting the absence of channel potentiation is due to removing Cys276, rather than the mutation having an indirect effect on channel gating. In total, these results indicate that channel potentiation is the result of PCMBS binding to Cys276.
Figure 7.
C276A prevents the PCMBS-mediated increase in channel activation. Ca2+ concentration response experiments and variance analysis were undertaken to determine whether PCMBS increases C276A channel activation in the same manner observed for the WT channel. (A) Representative macroscopic current record from an inside-out patch expressing KCa3.1 C276A channels. All experiments were performed using the Ca2+ concentraiton response protocol described in Fig. 3. (B) Plot of normalized 〈I〉 current against the corresponding Ca2+i for KCa3.1 C276A (■) and KCa3.1 C276A+PCMBS (▾). All analyses were performed according to the protocol described in Fig. 3 to give averages: KCa3.1 C276A (solid line, n = 18), EC50 = 460 ± 27 nM and h = 1.7 ± 0.04, and KCa3.1 C276A+PCMBS (dashed line, n = 9), EC50 = 485 ± 68 nM and h = 1.6 ± 0.04. Error bars represent SEM. (C) Variance analysis as described in Fig. 2 to determine Po(max), N, and i in the absence of PCMBS: Po(max) = 0.67, n = 488, and i = 3.3 pA. PCMBS did not increase steady-state current in KCa3.1 C276A; therefore, to obtain an estimate of Po(PCMBS), Po had to be extrapolated using the equation where Po = Po(max)(I/I(max)) and Po(PCMBS) = 0.63. Analysis of multiple patches (n = 6) indicates that PCMBS did not increase Po(max) (0.68 ± 0.05 in the absence of PCMBS and 0.59 ± 0.05 in PCMBS).
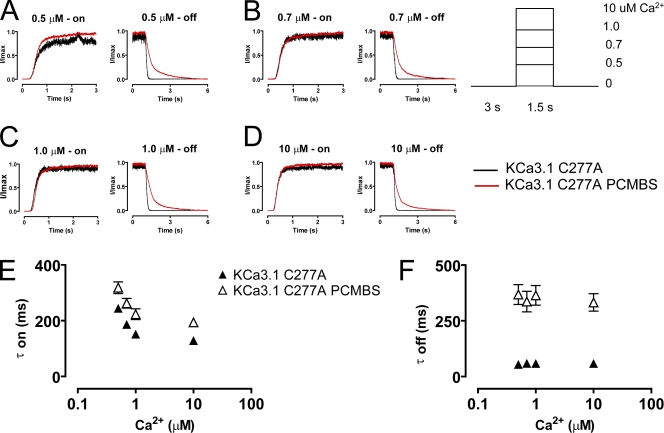
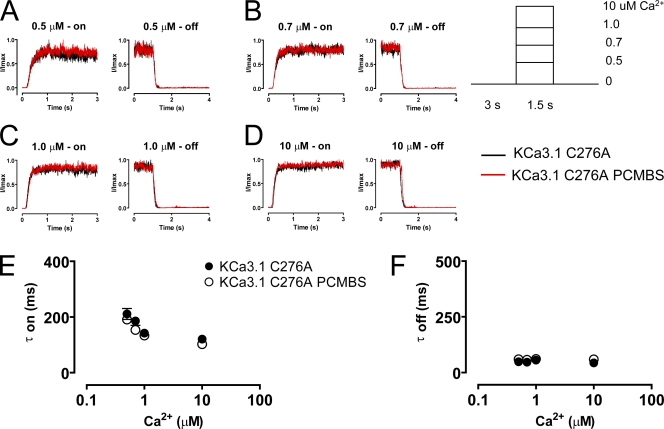
PCMBS modulated the kinetic as well as steady-state behavior of the WT channel. Therefore, we also determined whether Cys276 or Cys277 played a role in PCMBS-related changes to channel activation and deactivation. As depicted in Fig. 8 (A–D), C277A activation and deactivation records were similar to the WT channel, both in the absence and presence of PCMBS. The average activation and deactivation time constants (τ) are plotted in Fig. 8 (E and F, respectively), as well as being reported in Table I. These results further demonstrate that Cys277 does not mediate the PCMBS-dependent potentiation of KCa3.1. However, as expected, Cys276 eliminated the PCMBS-dependent changes in the kinetic behavior of the channel (Fig. 9, A–D). The elimination of the PCMBS effect on kinetic behavior cannot be explained through an indirect effect of the Cys276 mutation, because the time course of activation and deactivation kinetics (in the absence of PCMBS) closely describe the values observed in the WT channel (Table I). Therefore, these results suggest that modification of the kinetic behavior is the result of PCMBS binding to Cys276.
Figure 8.
PCMBS modulates C277A channel kinetics in a manner similar to the WT channel. Activation and deactivation kinetics were estimated with Ca2+ jump experiments using Ca2+i concentrations (A) 0.5, (B) 0.7, (C) 1.0, and (D) 10 µM in the absence (black trace) and presence (red trace) of PCMBS as described in Fig. 4. Activation (E) and deactivation (F) rates were estimated by fitting activation and deactivation records with an exponential function and reported as a time constant (τ-on and τ-off) in the absence (▴) and presence (▵) of PCMBS, see also Table I.
Figure 9.
C276A prevents the PCMBS-mediated modulation on channel kinetics. Activation and deactivation kinetics were estimated with Ca2+ jump experiments using Ca2+i concentrations 0.5, (A) 0.7, (B) 1.0, (C) and 10 µM (D) in the absence (black trace) and presence (red trace) of PCMBS as described in Fig. 4. Activation (E) and deactivation (F) rates were estimated by fitting activation and deactivation records with an exponential function and reported as a time constant (τ-on and τ-off) in the absence (•) and presence (○) of PCMBS, see also Table I.
Gating of KCa3.1 can be described with a four-state model
Our results demonstrate that PCMBS disrupts the steady-state and kinetic behavior of KCa3.1 by modifying Cys276. Addressing the mechanism behind PCMBS modification is necessary for understanding how the molecular interactions surrounding position 276 contribute to the gating mechanism. To this end, we developed a kinetic model, which would enable us to identify the transitions along the activation or deactivation pathway altered by PCMBS. A previous investigation established that the gating of KCa2.2 (SK2) can be described by a six-state gating scheme consisting of four closed states and two open states, with forward transitions between closed states being Ca2+ dependent (Hirschberg et al., 1998). Therefore, we determined if this model (Fig. 10 A) could be used to describe the activation and deactivation kinetics of the closely related channel, KCa3.1. Activation and deactivation current records were fit with the six-state model as described in the Materials and methods section. The solid lines in Fig. 10 B represent the fit to the activation and deactivation records assuming the Ca2+-dependent rate constants have a linear dependence on Ca2+ concentration, as proposed for KCa2.2 (Hirschberg et al., 1998). This model gave an accurate description of all datasets, except for the activation rate in saturating Ca2+i, where the model predicted activation rates that were faster than those observed experimentally. To obtain a more accurate description of the activation rate in saturating Ca2+i, we assumed that the Ca2+-dependent steps depended nonlinearly on the Ca2+ concentration. This modification allowed for the Ca2+-binding rate constants to saturate in high Ca2+i, giving a better description of the activation rates in 10 µM Ca2+i (Fig. 10 B, dashed lines), and therefore, was used for all further analysis. Sensitivity analysis was used to evaluate the importance of each parameter to the goodness of the fits for both variations of the model (Table S1). This analysis showed that the final C-C and C-O transitions (Fig. 10 A, box outline) were not required to fit the four sets of activation and deactivation records (Table II). Rather, these data were well described with a simpler four-state model comprised of three closed states and one open state, and the best fit is achieved when the Ca2+-dependent rate constants saturate in high Ca2+.
Table II.
Summary of the six-state model used to describe the kinetic behavior of KCa3.1 ± PCMBS
| KCa3.1 | KCa3.1 + PCMBS | Units | |||
| A n = 2 | A n = 1 | B n = 1 | C n = 1 | ||
| 12 | 27 ± 3 | 10 | 27 | 20 | μM−1 s−1 |
| 21 | 34 ± 8 | 76 | 34 | 34 | s−1 |
| 23 | 5425 ± 2725 | 2911 | 5425 | 2820 | μM−1 s−1 |
| 32 | 190 ± 40 | 2978 | 190 | 190 | s−1 |
| 34 | - | - | - | - | - |
| 43 | - | - | - | - | - |
| 35 | 34 ± 7 | 291 | 34 | 34 | s−1 |
| 53 | 20 ± 5 | 3 | 3 | 3 | s−1 |
| 46 | - | - | - | - | - |
| 64 | - | - | - | - | - |
| error | 38 | 45 | 42 | 43 | |
| KCa3.1 L281W | KCa3.1 L281W | ||||
| A n = 1 | B n = 1 | ||||
| 12 | 11 | 27 | μM−1 s−1 | ||
| 21 | 76 | 34 | s−1 | ||
| 23 | 12380 | 5425 | μM−1 s−1 | ||
| 32 | 192 | 190 | s−1 | ||
| 34 | - | - | - | ||
| 43 | - | - | - | ||
| 35 | 53 | 34 | s−1 | ||
| 53 | 5 | 4 | s−1 | ||
| 46 | - | - | - | ||
| 64 | - | - | - | ||
| error | 8 | 13 |
Rate constants derived from fitting the model to KCa3.1 activation and deactivation records. A, rates constants derived using the model with all free parameters: KCa3.1, KCa3.1+PCMBS, and KCa3.1 L281W; B, rates constants derived using the k53 model: KCa3.1+PCMBS and KCa3.1 L281W; C, rates constants derived using the k12 k23 and k53 model: KCa3.1+PCMBS. Bold, fixed to kKCa3.1(-PCMBS).
We went on to further validate our kinetic scheme by predicting the apparent Ca2+ affinity and the shift in apparent Ca2+ affinity mediated by PCMBS. Fig. 10 C illustrates the simulated Ca2+ concentration response curves in the absence (solid line) and presence (dashed line) of PCMBS plotted against the corresponding experimental data. The model accurately predicts the apparent Ca2+ affinity as well as the shift induced by PCMBS. The success of the model is not entirely unexpected, since it was initially fit to the kinetic data, which encompasses the steady-state response. Nonetheless, the consistency between the model and the experimental data are reassuring.
PCMBS slows the k53 transition
Previous studies on K+ channels have shown that mutations along S6 perturb a concerted transition that occurs late in the activation pathway before opening (Yifrach and MacKinnon, 2002). Because our data suggest that PCMBS binds to a S6 residue (Cys276), we determined whether the PCMBS-induced perturbation could also be traced to a late opening transition. To answer this, we analyzed activation and deactivation kinetics in the presence of 500 µM PCMBS, in terms of the scheme discussed above, and compared the rate constants with those obtained in the absence of the compound. Fig. 11 A (dashed line) shows the fit of the model to a representative Ca2+ jump experiment performed in the presence of PCMBS. As summarized in Table II, initial modeling showed that PCMBS has complex effects on channel kinetics by altering multiple transitions along the activation and deactivation pathway. The largest changes occur for the k32 (15-fold faster), k35 (8-fold faster), and k53 (7-fold slower) transitions, which made it difficult to interpret our results. However, due to the large parameter space in the kinetic model, it is impossible to prove that the fitted parameters are indeed the best fit. Additionally, it is impossible to know if there are different parameter sets with quantitatively similar goodness of fits. In an effort to account for this uncertainty, we started from the parameter values determined in the absence of PCMBS (k-PCMBS), and we only allowed a few parameters to be fit at a time while holding all other values constant. In doing this, we isolated one parameter that is critical for describing the kinetic changes to the channel upon the application of PCMBS, k53, the transition rate from the first open state back to the third closed state (Table II). Simply modifying k53 alone (solid line) results in a goodness of fit that is nearly identical to our first attempt (dashed line) indicating that an approximately sevenfold slowing of transition k53 can account for our experimental observations (see Fig. 10 A and Table II). After extensive parameter searches, we believe these results provide the most parsimonious description of how PCMBS affects the channel; however, more complex interactions involving multiple rates cannot be ruled out. Our results demonstrate that PCMBS slows the first transition along the deactivation pathway, rather than altering a concerted transition late in the activation pathway.
Figure 11.
PCMBS slows transition k53, as determined through the constrained version of the model. (A) Representative activation and deactivation records fit with two variations of the model. The dashed line represents the variation that allowed parameters k12, k21, k23, k32, k35, and k53 to be free, and the solid line represents the variation that held parameters k12, k21, k23, k32, and k35 to k(-PCMBS) values; k53 is the only free parameter, see Results for details. As noted in the previous figure, the Ca2+-dependent rate constants were assumed to have a nonlinear dependence on Ca2+ concentration, k = A · [Ca]/(B + [Ca]). The colors refer to the different Ca2+ concentrations, with red representing 0.5, blue 0.7, green 1.0, and black 10 μM Ca2+. (B) Gating scheme detailing that parameter k53 is modulated by PCMBS, as determined through the constrained version of the model.
L281W replicates the PCMBS phenotype
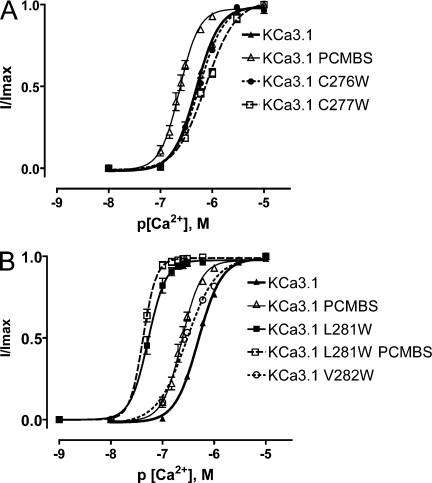
Our results suggest that Cys276 is located within a gating-sensitive region of the channel, as disrupting this site with PCMBS shifts the gating equilibrium toward the open state. As PCMBS converts cysteine into a mercuriphenyl-sulphonate conjugate (Wang et al., 1999), we attempted to mimic the influence of PCMBS by placing a bulky tryptophan residue at position 276. However, as illustrated in Fig. 12 A, the C276W mutation had no effect on apparent Ca2+ affinity, EC50 = 558 ± 50 nM and h = 1.8 ± 0.1 (n = 7), when compared with the WT channel EC50 = 508 ± 13 nM and h = 2.0 ± 0.1 (n = 57). This result demonstrates that Trp276 does not reproduce the shift in apparent Ca2+ affinity associated with the PCMBS-dependent channel potentiation. It should be noted that PCMBS is negatively charged at pH 7.2. However, experiments to determine whether PCMBS electrostatically disrupts channel structure could not be conducted because we were unable to record macroscopic current from the C276D mutation.
Figure 12.
Trp281 and Trp282 recapitulate the PCMBS-mediated shift in apparent Ca2+ affinity. Complete Ca2+ concentration response experiments were performed to estimate EC50 and Hill coefficients (h) for those constructs expressing macroscopic currents, as described in Fig. 3. (A) Plot of normalized 〈I〉 current against the corresponding Ca2+i for KCa3.1 C276W (•) and C277W (□). KCa3.1 (▴) and KCa3.1+PCMBS (▵) are included for comparison. KCa3.1 C276W (n = 7), EC50 = 558 ± 50 nM and h = 1.8 ± 0.1; KCa3.1 C277W (n = 6), EC50 = 748 ± 54 nM and h = 1.5 ± 0.1; KCa3.1 (n = 57), EC50 = 508 ± 13 nM and h = 2.0 ± 0.2; and KCa3.1+PCMBS (n = 6), EC50 = 235 ± 17 nM and h = 2.5 ± 0.2. (B) Plot of normalized 〈I〉 current against the corresponding [Ca2+]i for KCa3.1 L281W (■), KCa3.1 L281W+PCMBS (□), and KCa3.1 V282W (○). KCa3.1 (▴) and KCa3.1+PCMBS (▵) are included for comparison. KCa3.1 L281W (n = 12), EC50 = 54 ± 6.4 nM and h = 3.3 ± 0.2; KCa3.1 L281W+PCMBS (n = 3), EC50 = 43 ± 1.2 nM and h = 3.6 ± 0.5; KCa3.1 V282W (n = 12), EC50 = 296 ± 14 nM and h = 1.6 ± 0.1; KCa3.1 (n = 57), EC50 = 508 ± 13 nM and h = 2.0 ± 0.2; and KCa3.1+PCMBS (n = 6), EC50 = 235 ± 17 nM and h = 2.5 ± 0.2. Error bars represent standard SEM. Error bars smaller than the symbols are not visible in the graph.
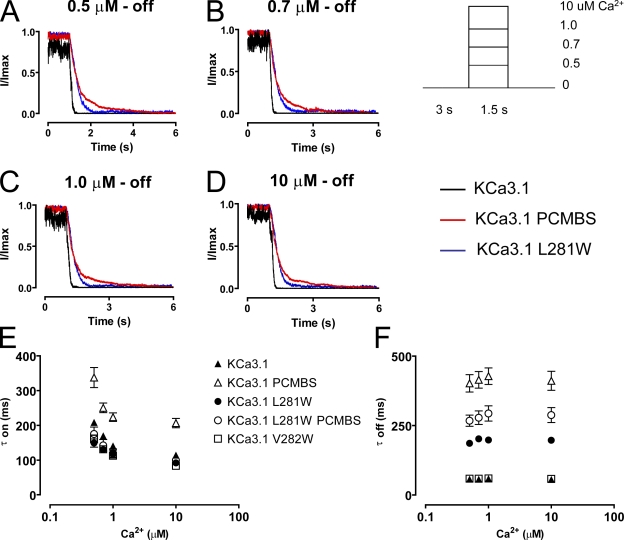
Whereas Trp276 does not manipulate apparent Ca2+ affinity, PCMBS is a larger molecule, and it may exert its influence at a position distant from the Cys276 anchoring point. To examine this possibility, we performed a partial tryptophan scan of S6, from Gly274 to Val282, and assessed whether these mutations recapitulated any characteristics of the PCMBS phenotype. Mutations G274W, V275W, T278W, A279W, and L280W all failed to produce macroscopic currents, thus preventing their assessment. As shown in Fig. 12 (A and B) C277W causes a right shift in apparent Ca2+ affinity, whereas both L281W and V282W produced left shifts similar to PCMBS. Remarkably, Trp281 mediates a large shift in apparent Ca2+ affinity, an ∼10-fold increase over the WT (−PCMBS) channel and an ∼4-fold increase over the WT (+PCMBS) channel. To determine whether Trp281 and Trp282 also recapitulate the changes in kinetic behavior, Ca2+ jump experiments were performed. As shown in Fig. 13, the Trp281 mutation mimics the deactivation process, resulting in an approximately threefold slowing relative to the WT channel. However, the mutation had no effect on the activation process. Furthermore, Trp282 had no effect on channel activation or deactivation (Fig. 13, E and F). Since Trp281 mimics the PCMBS phenotype, we wanted to assess whether the mutation prevented further modulation with PCMBS. PCMBS did not alter the apparent Ca2+ affinity (Fig. 12 B) or activation kinetics of the Trp281 mutation (Fig. 13, E and F). However, the addition of PCMBS to the mutant channel further slowed channel deactivation by roughly 40% over the four Ca2+i concentrations examined (Fig. 13, E and F), suggesting this compound can still bind Cys276, but does not potentiate channel behavior.
Figure 13.
Trp281 recapitulates the PCMBS-mediated modulation in deactivation kinetics. Activation and deactivation kinetics were estimated with Ca2+ jump experiments as described in Fig. 4 using Ca2+i concentrations (A) 0.5, (B) 0.7, (C) 1.0, and (D) 10 µM for L281W (blue trace) and KCa3.1 in the absence (black trace) and presence (red trace) of PCMBS, included for comparison. Activation (E) and deactivation (F) rates were estimated by fitting activation and deactivation records with an exponential function and reported as a time constant (τ-on and τ-off) for KCa3.1 (▴), KCa3.1 PCMBS (▵), L281W (•), L281W PCMBS (○), and V282W (□), see also Table I.
We also assessed whether the four-state model can accurately describe L281W activation and deactivation records from the Ca2+ jump experiments. As illustrated in Fig. 14 A, the four-state model accurately describes the four sets of activation and deactivation time courses. Fig. 14 B provides an enhanced depiction of the fit outlined by the dashed box in Fig. 14 A. The rate constants derived from the fit are presented in Table II. As shown in the table, the values for k12, k21, and k53 are very similar to those values obtained from the initial analysis of KCa3.1+PCMBS. This surprising result suggests that L281W has many kinetic characteristics in common with the PCMBS-modulated channel. Therefore, we asked whether the phenotype displayed by this construct could be explained by only modifying transition k53. As shown in Table II, the parameters from the KCa3.1 model (kKCa3.1-PCMBS) were adequate to describe L281W activation and deactivation time courses. This result indicates that slowing of the deactivation process can be explained by slowing of transition k53 for both the PCMBS-modulated channel and the L281W construct. As discussed with PCMBS, we cannot rule out that the phenotype present in L281W is the result of complex interactions involving multiple rates. However, it is interesting that parameters from the KCa3.1 data can reproduce the fits for both PCMBS and the L281W Ca2+ jump experiments. In total, these results indicate that sterically disrupting Cys276 is not adequate to recapitulate the PCMBS phenotype. The results from the tryptophan scan suggest that Leu281and Val282 are located within a mechanically sensitive region of the channel. More importantly, L281W disrupts steady-state and kinetic behavior in a manner that is similar to PCMBS, suggesting that L281W and PCMBS may disrupt gating through a common mechanism.
Figure 14.
A four-state model can be used to fit the activation and deactivation kinetics for KCa3.1 L281W. (A) Representative activation and deactivation records fit with the model shown in Fig. 10 A. Activation and deactivation currents were recorded and fit according to the protocol described in the Materials and methods sections. The colors refer to the different Ca2+ concentrations, with red representing 0.5, blue 0.7, green 1.0, and black 10 µM Ca2+. The dashed line represents the fit assuming Ca2+-dependent rate constants have a nonlinear dependence on Ca2+ concentration, k = A · [Ca]/(B + [Ca]). Rate constants derived from the fit are summarized in Table II. (B) Enhanced depiction of the fit outlined by the box in A.
DISCUSSION
Ligand-gated ion channels undergo a series of conformational changes in response to ligand binding, enabling the pore to transition from a nonconducting to a conducting configuration (Hille, 2001). A chemo-mechanical gating model has been proposed to explain the Ca2+-dependent gating mechanism of KCa channels (Schumacher et al., 2001, 2004). This model states that the binding of Ca2+i to CaM initiates a cascade of conformational changes within CaM/CaMBD. These conformational changes are then coupled, via the S6 transmembrane helix, to the pore, enabling the channel to gate (Xia et al., 1998; Keen et al., 1999; Schumacher et al., 2001, 2004). Here we showed that PCMBS potentiates channel activation by manipulating steady-state and kinetic behavior through modification of Cys276. A tryptophan scan of S6 revealed that L281W mimics modification by PCMBS, suggesting that both may act through a common mechanism. Perturbations at each of these sites disrupt channel closing, supporting the notion that the nonluminal surface of this portion of S6 is allosterically coupled to the activation gate. Therefore, the Ca2+-dependent activation mechanism utilizes the nonluminal surface along S6 to transition into the closed conformation.
Difference in chemistries of the compounds may explain discrepancy regarding the effect on the WT channel
It is interesting that MTSET fails to modulate WT channel gating (Simoes et al., 2002; Klein et al., 2007), despite our results showing that PCMBS can modulate gating. There are several possible explanations for this difference, but the simplest is related to the chemical difference between PCMBS and MTSET. This conclusion is consistent with previous investigations showing that PCMBS, with a peripherally located cysteine reactive moiety, could access cysteines not accessible to MTSET’s more centrally located moiety (Yusaf et al., 1996; Wang et al., 1999; Milligan and Wray, 2000). Additionally, the larger size of PCMBS conjugated to cysteine was more likely to irreversibly modify behavior rather than transiently affect behavior as observed using MTSET (Yusaf et al., 1996; Wang et al., 1999; Milligan and Wray, 2000). Thus, the unique chemistry of PCMBS enables this compound to potentiate the WT channel by modifying Cys276.
As Cys276 is located within a region of the channel (V275-V282) inhibited by MTSET, why does PCMBS not inhibit the channel? The discrepancy in modulation can be explained by the orientation of Cys276 relative to the lumen of the pore. Val275 is known to line the pore from studies localizing the binding site of clotrimazole and arachidonic acid (Wulff et al., 2001; Hamilton et al., 2003). Results from a substituted cysteine accessibility method analysis confirmed the orientation of this residue, and indicated a similar orientation for Thr278 and Val282 (Simoes et al., 2002). These results are in agreement with sequence alignments (Table S1) that indicate Val275, Thr278, and Val282 correspond to residues that are known to line the pore in KcsA (Doyle et al., 1998; Gross et al., 1999) and Shaker (Liu et al., 1997). The luminal location of Val275, Thr278, and Val282 indirectly argues for Cys276 and Leu281 to be oriented away from the pore. Thus, the nonluminal orientation of Cys276 prevents PCMBS from modification-induced channel block.
PCMBS potentiates channel activation by shifting the gating equilibrium toward the open conformation
PCMBS cannot activate the channel in the absence of Ca2+i, (Fig. 1 D) suggesting the compound potentiates activation, rather than directly opening the gate. Cys276 is only accessible in the open conformation (Fig. 1 D), suggesting that the closed conformation either blocks PCMBS from accessing Cys276, or the orientation of Cys276 may be inaccessible. A previous investigation indicated that once in the closed state, a constriction develops at the level of Thr278-Ala282 (Klein et al., 2007). It is possible that this constriction blocks PCMBS from gaining access to Cys276.
PCMBS influences both steady-state and kinetic behavior of the channel. The changes to the steady-state behavior occur in subsaturating Ca2+i as well as saturating Ca2+i concentrations. These changes could occur independently through two separate pathways: a Ca2+-dependent pathway that shifts the apparent Ca2+ affinity and Ca2+-independent pathway that increases Po(max). Thus, the shift in apparent affinity can be explained by either a change in the initial binding of Ca2+ to CaM or modification of a conformational change subsequent to Ca2+ binding. However, we observed that PCMBS increases Po(max), suggesting that modulation along the Ca2+-dependent pathway cannot simply be explained by stabilizing the Ca2+/CaM interaction. Rather, it suggests that PCMBS functions to shift the gating equilibrium toward the open conformation. Shifting the gating equilibrium toward the open conformation would explain both the increase in Po(max) and, through a mass action effect, the shift in apparent affinity. Therefore, the changes in steady-state behavior cannot occur through two independent pathways, but are related and a consequence of shifting the equilibrium toward the open conformation. These results are similar to a previous investigation, which characterized potentiation by Ni2+ on cyclic nucleotide-activated channels from rod photoreceptors (Gordon and Zagotta, 1995).
We know from the change in steady-state behavior that PCMBS alters the energy difference between the closed and open conformations to favor channel opening. What we cannot infer from these experiments is whether the energetics of activation, deactivation, or a combination of the two is altered. Based on channel kinetics, PCMBS slows both channel activation and deactivation (Table I). Although the slowing of channel activation is not congruent with our steady-state data, slowing of channel deactivation is the predominant effect and corresponds well with our steady-state results. Therefore, the primary manner in which PCMBS shifts the gating equilibrium toward the open conformation is by disrupting the energetics of channel deactivation.
We demonstrated that a four-state gating scheme describes the activation and deactivation records of KCa3.1. However, the rates describing the Ca2+-dependent transitions must have a nonlinear rather than a linear dependence to fit the activation record in saturating Ca2+i. This need for nonlinear coefficients is not an artifact of the experimental system, as we were able to describe the full range of kinetic behavior for the closely related channel KCa2.3 (unpublished data). The discrepancy may be related to channel behavior in saturating Ca2+i, as elevated Ca2+i has been reported to block the channel (Ledoux et al., 2008).
As illustrated in Table II, k23 is substantially higher than the other rate constants, particularly k12. As the analysis from Hirschberg et al. reported k12 ≈ k23 we tested the model where k12 = k23 to ensure that our results were not biased by k23. However, forcing k12 = k23 results in the model predicting faster activation time courses compared with the rates observed experimentally (unpublished data). Therefore, this analysis suggests k23 must be higher than the other rates constants to accurately describe the activation time courses from the four sets of Ca2+ concentrations. The discrepancy may exist because we simultaneously fit activation and deactivation records from four sets of Ca2+ concentrations, whereas the other investigation fit a single concentration.
Modeling the Ca2+-dependent gating of KCa3.1
The results from the initial kinetic analysis showed that good fits to the data can be obtained by modulating all transition rates in the presence of PCMBS. However, more careful reanalysis revealed that only one rate constant, k53, had to be changed to explain the influence of PCMBS (Table II). Reducing k53 approximately sevenfold gives excellent fits to the activation and deactivation records, and further substantiates that PCMBS shifts the gating equilibrium toward the open conformation by disrupting channel closing. Assuming k53 is the only transition affected by PCMBS may be an over simplification. As depicted in Table II, PCMBS affects both channel activation and deactivation. Therefore, to address this question we reanalyzed the data, allowing transitions k12, k23, and k53 to change. Our subsequent analysis showed a slowing of the rate constants k12 and k23, which correlates well with the observed slowing of channel activation (Table II). However, there was no improvement in the fit when compared with the k53 model (Table II). Therefore, the modest effect of PCMBS on channel activation does not require a substantial change in k12 or k23. The predominant effect on kinetic behavior is completely accounted for by the change in transition k53, which accurately describes the slowing in channel deactivation.
In contrast to the WT channel, the L281W mutation affects channel deactivation without affecting channel activation. Therefore, this made for an ideal model to confirm whether the change in the deactivation process can be completely explained by the change in transition k53. The initial kinetic analysis showed that the change in channel deactivation can be explained by an approximately fourfold slowing of transition k53, which corresponds well with the observed change in τ-off (Table I). As predicted, we were able to reproduce the fit from the initial kinetic analysis by modifying only transition k53 (Table II). This result argues that the slowing of channel deactivation observed with PCMBS and L281W can be explained by slowing of transition k53. The results from the kinetic analysis correspond well with the observed phenotype for both the PCMBS-modulated channel and the L281W mutation. This correspondence would suggest that PCMBS and the L281W mutation disrupt channel behavior through a common mechanism, which will be discussed further in the following section. Although our data are consistent with PCMBS and L281W stabilizing the open conformation, based upon our analysis of macroscopic currents, we cannot eliminate the possibility that the observed effects are the result of destabilizing the closed conformation (Yifrach and MacKinnon, 2002). Therefore, a physical interpretation of the manipulation by PCMBS and L281W is that both perturbations disrupt channel closing, suggesting that Cys276 and Leu281 are located in a region of S6 that is allosterically coupled to the activation gate.
Potential mechanism of PCMBS
Our results are consistent with PCMBS binding to Cys276; however, we cannot recreate this effect by sterically perturbing position 276 with a tryptophan substitution. Furthermore, mutation to Gly276, Phe276, Tyr276, and the aforementioned Ala276 and Asp276 (no expression) also failed to alter the apparent Ca2+ affinity (unpublished data). Although many scenarios may account for this result, the simplest explanation is that Cys276 is not coupled to the activation gate. Furthermore, mutation of the adjacent amino acid, C277W, had only modest effects on apparent Ca2+ affinity, also suggesting that Cys277 is not coupled to the activation gate. These results are in agreement with a previous investigation, which predicted that the channel cavity extends from Val272 to Thr278 (Simoes et al., 2002; Klein et al., 2007). Modeling of the open (computer-derived structure) and closed state using the KcsA structure, indicates that the major conformational change occurs along S6 between Thr278 and Val282 (Simoes et al., 2002). Gating-sensitive residues are found in regions of the channel where amino acid packing rearranges as the channel transitions from one conformational state to another (Yifrach and MacKinnon, 2002). Therefore, interpreting our results in the context of previous investigations suggest that mutations at Cys276 and Cys277 do not modulate gating because this region is predicted to undergo little movement, whereas Leu281 and Val282 are thought to modulate gating because these positions are predicted to undergo major conformational change (Simoes et al., 2002).
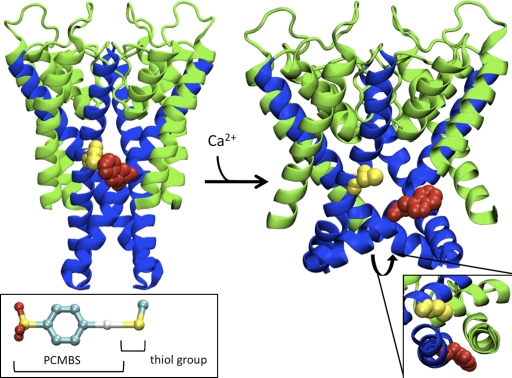
Mutating Leu281 or Val282 to tryptophan shifts the gating equilibrium toward the open state, demonstrating that this region rearranges as the channel transitions between conformational states. More importantly, the Trp281 mutation has the additional effect of slowing the deactivation process. The similarity between modification by PCMBS and L281W supports the notion that these two perturbations are disrupting the channel through a common mechanism. Thus, PCMBS and L281W may function to shift the gating equilibrium toward the open conformation by either stabilizing the open state or destabilizing the closed state (Yifrach and MacKinnon, 2002). Our data cannot eliminate either of these possibilities. Therefore, we propose two hypotheses to describe how PCMBS and the L281W mutation disrupt the gating of KCa3.1. To attempt to visualize rearrangements that occur in this region during gating, we constructed a closed-state model of KCa3.1 based on the KcsA x-ray structure and an open-state model based on Kv1.2 (Fig. 15). The open state model predicts that Leu281 is oriented toward S5 (Fig. 15, inset). Our kinetic modeling predicts that PCMBS and L281W slow transition k53. Therefore, our first hypothesis is that these perturbations hinder the possible rotational movement of S6 that was shown to accompany the closed to open transition in the KcsA K+ channel (Perozo et al., 1999). The increase in side-chain volume with the L281W mutation could sterically hinder the rotation of S6 by disrupting a potential S5/S6 interaction. Additionally, Ackerman et al. (2002) characterized the binding mechanism of PCMBS to Charcot-Leyden crystal protein and determined that PCMBS binds to Cys57 but results in downstream perturbation at the Arg60 side chain. Therefore, PCMBS may interact with neighboring residues in the open state to disrupt the conformational change in S6. This model supports our data well because these interactions could energetically stabilize the open conformation. However, we cannot rule out the possibility that PCMBS and L281W shift the gating equilibrium toward the open conformation by destabilizing the closed conformation of the channel. Along these lines, the open- and closed-state models of KCa3.1 predict that Cys276 and Leu281 sterically clash in the closed state but not in the open state. Therefore, an alternate hypothesis is that when PCMBS is conjugated to Cys276, it disrupts the closing transition by sterically clashing with Leu281. The L281W mutation would work through a similar mechanism, except this mutation would disrupt the closing transition by sterically clashing with Cys276. Although there is an agreement between the length of PCMBS and the distance between the β carbons of the corresponding residues from KcsA and KirBac1.1 (Fig. 15), the steric clash predicted by this model could lead to an energetic destabilization of the closed state. This conclusion is inconsistent with our kinetic modeling. Furthermore, the KcsA structure cannot account for the closed conformation of KCa3.1, as the region in KCa3.1, corresponding to the bundle crossing in KcsA, does not function as an activation gate (Klein et al., 2007; Garneau et al., 2009). Thus, while this is an interesting model that predicts an intersubunit interaction, it is an unlikely representation for the molecular function of PCMBS.
Figure 15.
Homology model of the pore region for the open and closed state of KCa3.1. (Left) Representation of the S5-P-helix-S6 region viewed as a profile illustrating the predicted orientation of Cys276 (yellow) and the L281W mutation (red) in the closed state using the KcsA structure. (Inset) Structure of PCMBS adapted from the crystal structure of PCMBS in complex with the Charcot-Leyden crystal protein (Ackerman et al., 2002). PCMBS is 6.5 Å in length and 9.0 Å in length when the thiol group is included. The color red represents oxygen molecules, yellow (sulfur), cyan (carbon), and white (mercury). (Right) Representation of the S5-P-helix-S6 region viewed as a profile illustrating the predicted orientation of Cys276 (yellow) and the L281W mutation (red) in the open state based upon the structure of rKv1.2. Sequence alignments used for homology modeling can be found in Fig. 5 C. (Inset) Representation of S5 and S6 viewed from the intercellular aspect of the pore to illustrate that Leu281 (L281W) is oriented toward S5. Cys276 and L281W from the adjacent subunit are the only residues illustrated to compare the predicted orientation in the closed and open state. The S5 and P-helix are colored green and the S6 helix is colored blue. All residues are illustrated in VDW format. The C-terminal portion of the S5 helix was removed to prevent obscuring the view of L281W.
Activation mechanism: implications from PCMBS modulation and the L281W mutation
Ligand-gated ion channels are composed of a pore-domain, a ligand-binding domain, and a coupling mechanism, which links the ligand binding sites within the ligand-binding domain to the activation gate in the pore domain (Horrigan and Aldrich, 2002). Although, various hypotheses exist to explain the coupling mechanism, the interacting surfaces between transmembrane domains have been proposed as a coupling mechanism for activation of Kv channels (Horn, 2000; Larsson, 2002). Movement of one transmembrane domain can influence the conformation of an adjacent transmembrane domain through side-chain contact points radiating from adjacent helices. We presented arguments for both Cys276 and Leu281 adopting a nonluminal orientation, and disrupting these sites alters the steady-state and kinetic behavior of the channel. Our results correspond well with previous investigations, which proposed that the activation gate for this family of ion channels is located at or near the selectivity filter (Bruening-Wright et al., 2002; Bruening-Wright et al., 2007; Klein et al., 2007), suggesting that the region between the gate and CaMBD must be incorporated into the coupling mechanism. Therefore, our results would suggest that the nonluminal face of S6, specifically the C-terminal region, is allosterically coupled to the activation gate. This idea corresponds well with prior investigations that isolated a gating-sensitive region (Ala283, Val285, and Ala286) in the C-terminal portion of S6 (Simoes et al., 2002; Klein et al., 2007), in addition to a position (Val282) required for transitioning into the closed conformation (Garneau et al., 2009). However, unlike the previous investigations, which proposed a mechanism for pore-lining residues participating in the activation mechanism, we provide evidence that the nonluminal face of S6 also actively participates in the activation mechanism, functioning as a key interaction surface required for transitioning into the closed state.
Acknowledgments
We thank Dr. Peter Drain for many stimulating discussions and Dr. Gordon MacGregor for the initial help with variance analysis.
This work was supported by National Institutes of Health grants HL083060 and HL092157 to D.C. Devor and by a grant to M. Grabe from the Myrtle Forsha Memorial Trust and the Lloyd Foundation through the PNC Charitable Trust Grant Review Committee.
Edward N. Pugh Jr. served as editor.
Footnotes
Abbreviations used in this paper:
- Ca2+i
- intracellular Ca2+
- CaM
- calmodulin
- EDHF
- endothelial derived hyperpolarizing factor
- HEK
- human embryonic kidney
- KCa3.1
- calcium-activated potassium channel
- PCMBS
- parachloromercuribenze sulfonate
References
- Ackerman S.J., Liu L., Kwatia M.A., Savage M.P., Leonidas D.D., Swaminathan G.J., Acharya K.R. 2002. Charcot-Leyden crystal protein (galectin-10) is not a dual function galectin with lysophospholipase activity but binds a lysophospholipase inhibitor in a novel structural fashion. J. Biol. Chem. 277:14859–14868 10.1074/jbc.M200221200 [DOI] [PubMed] [Google Scholar]
- Bolton T.B., Lang R.J., Takewaki T. 1984. Mechanisms of action of noradrenaline and carbachol on smooth muscle of guinea-pig anterior mesenteric artery. J. Physiol. 351:549–572 [DOI] [PMC free article] [PubMed] [Google Scholar]
- Bruening-Wright A., Schumacher M.A., Adelman J.P., Maylie J. 2002. Localization of the activation gate for small conductance Ca2+-activated K+ channels. J. Neurosci. 22:6499–6506 [DOI] [PMC free article] [PubMed] [Google Scholar]
- Bruening-Wright A., Lee W.S., Adelman J.P., Maylie J. 2007. Evidence for a deep pore activation gate in small conductance Ca2+-activated K+ channels. J. Gen. Physiol. 130:601–610 10.1085/jgp.200709828 [DOI] [PMC free article] [PubMed] [Google Scholar]
- Doyle D.A., Morais Cabral J., Pfuetzner R.A., Kuo A., Gulbis J.M., Cohen S.L., Chait B.T., MacKinnon R. 1998. The structure of the potassium channel: molecular basis of K+ conduction and selectivity. Science. 280:69–77 10.1126/science.280.5360.69 [DOI] [PubMed] [Google Scholar]
- Feletou M. 2009. Calcium-activated potassium channels and endothelial dysfunction: therapeutic options? Br. J. Pharmacol. 156:545–562 10.1111/j.1476-5381.2009.00052.x [DOI] [PMC free article] [PubMed] [Google Scholar]
- Feletou M., Vanhoutte P.M. 2009. EDHF: an update. Clin. Sci. (Lond.). 117:139–155 10.1042/CS20090096 [DOI] [PubMed] [Google Scholar]
- Fleming I. 2006. Realizing its potential: the intermediate conductance Ca2+-activated K+ channel (KCa3.1) and the regulation of blood pressure. Circ. Res. 99:462–464 10.1161/01.RES.0000241059.19853.39 [DOI] [PubMed] [Google Scholar]
- Garneau L., Klein H., Banderali U., Longpre-Lauzon A., Parent L., Sauve R. 2009. Hydrophobic interactions as key determinants to the KCa3.1 channel closed configuration. An analysis of KCa3.1 mutants constitutively active in zero Ca2+. J. Biol. Chem. 284:389–403 10.1074/jbc.M805700200 [DOI] [PubMed] [Google Scholar]
- Gordon S.E., Zagotta W.N. 1995. A histidine residue associated with the gate of the cyclic nucleotide-activated channels in rod photoreceptors. Neuron. 14:177–183 10.1016/0896-6273(95)90252-X [DOI] [PubMed] [Google Scholar]
- Gross A., Columbus L., Hideg K., Altenbach C., Hubbell W.L. 1999. Structure of the KcsA potassium channel from Streptomyces lividans: a site-directed spin labeling study of the second transmembrane segment. Biochemistry. 38:10324–10335 10.1021/bi990856k [DOI] [PubMed] [Google Scholar]
- Hamilton K.L., Syme C.A., Devor D.C. 2003. Molecular localization of the inhibitory arachidonic acid binding site to the pore of hIK1. J. Biol. Chem. 278:16690–16697 10.1074/jbc.M212959200 [DOI] [PubMed] [Google Scholar]
- Hille B. 2001. Ion Channels of Excitable Membranes. Third ed Sinauer, Sunderland, MA: 814 [Google Scholar]
- Hirschberg B., Maylie J., Adelman J.P., Marrion N.V. 1998. Gating of recombinant small-conductance Ca-activated K+ channels by calcium. J. Gen. Physiol. 111:565–581 10.1085/jgp.111.4.565 [DOI] [PMC free article] [PubMed] [Google Scholar]
- Horn R. 2000. Conversation between voltage sensors and gates of ion channels. Biochemistry. 39:15653–15658 10.1021/bi0020473 [DOI] [PubMed] [Google Scholar]
- Horrigan F.T., Aldrich R.W. 2002. Coupling between voltage sensor activation, Ca2+ binding and channel opening in large conductance (BK) potassium channels. J. Gen. Physiol. 120:267–305 10.1085/jgp.20028605 [DOI] [PMC free article] [PubMed] [Google Scholar]
- Ishii T.M., Silvia C., Hirschberg B., Bond C.T., Adelman J.P., Maylie J. 1997. A human intermediate conductance calcium-activated potassium channel. Proc. Natl. Acad. Sci. USA. 94:11651–11656 10.1073/pnas.94.21.11651 [DOI] [PMC free article] [PubMed] [Google Scholar]
- Joiner W.J., Wang L.Y., Tang M.D., Kaczmarek L.K. 1997. hSK4, a member of a novel subfamily of calcium-activated potassium channels. Proc. Natl. Acad. Sci. USA. 94:11013–11018 10.1073/pnas.94.20.11013 [DOI] [PMC free article] [PubMed] [Google Scholar]
- Keen J.E., Khawaled R., Farrens D.L., Neelands T., Rivard A., Bond C.T., Janowsky A., Fakler B., Adelman J.P., Maylie J. 1999. Domains responsible for constitutive and Ca(2+)-dependent interactions between calmodulin and small conductance Ca(2+)-activated potassium channels. J. Neurosci. 19:8830–8838 [DOI] [PMC free article] [PubMed] [Google Scholar]
- Klein H., Garneau L., Banderali U., Simoes M., Parent L., Sauve R. 2007. Structural determinants of the closed KCa3.1 channel pore in relation to channel gating: results from a substituted cysteine accessibility analysis. J. Gen. Physiol. 129:299–315 10.1085/jgp.200609726 [DOI] [PMC free article] [PubMed] [Google Scholar]
- Larsson H.P. 2002. The search is on for the voltage sensor-to-gate coupling. J. Gen. Physiol. 120:475–481 10.1085/jgp.20028657 [DOI] [PMC free article] [PubMed] [Google Scholar]
- Ledoux J., Bonev A.D., Nelson M.T. 2008. Ca2+-activated K+ channels in murine endothelial cells: block by intracellular calcium and magnesium. J. Gen. Physiol. 131:125–135 10.1085/jgp.200709875 [DOI] [PMC free article] [PubMed] [Google Scholar]
- Li W., Halling D.B., Hall A.W., Aldrich R.W. 2009. EF hands at the N-lobe of calmodulin are required for both SK channel gating and stable SK-calmodulin interaction. J. Gen. Physiol. 134:281–293 10.1085/jgp.200910295 [DOI] [PMC free article] [PubMed] [Google Scholar]
- Liu Y., Holmgren M., Jurman M.E., Yellen G. 1997. Gated access to the pore of a voltage-dependent K+ channel. Neuron. 19:175–184 10.1016/S0896-6273(00)80357-8 [DOI] [PubMed] [Google Scholar]
- Long S.B., Campbell E.B., Mackinnon R. 2005. Crystal structure of a mammalian voltage-dependent Shaker family K+ channel. Science. 309:897–903 10.1126/science.1116269 [DOI] [PubMed] [Google Scholar]
- Milligan C.J., Wray D. 2000. Local movement in the S2 region of the voltage-gated potassium channel hKv2.1 studied using cysteine mutagenesis. Biophys. J. 78:1852–1861 10.1016/S0006-3495(00)76734-8 [DOI] [PMC free article] [PubMed] [Google Scholar]
- Perozo E., Cortes D.M., Cuello L.G. 1999. Structural rearrangements underlying K+-channel activation gating. Science. 285:73–78 10.1126/science.285.5424.73 [DOI] [PubMed] [Google Scholar]
- Press W.H. 2007. Numerical Recipes: The Art of Scientific Computing. Third ed. Cambridge University Press, Cambridge, UK: 1235 pp. [Google Scholar]
- Sali A., Blundell T.L. 1993. Comparative protein modelling by satisfaction of spatial restraints. J. Mol. Biol. 234:779–815 10.1006/jmbi.1993.1626 [DOI] [PubMed] [Google Scholar]
- Schumacher M.A., Rivard A.F., Bachinger H.P., Adelman J.P. 2001. Structure of the gating domain of a Ca2+-activated K+ channel complexed with Ca2+/calmodulin. Nature. 410:1120–1124 10.1038/35074145 [DOI] [PubMed] [Google Scholar]
- Schumacher M.A., Crum M., Miller M.C. 2004. Crystal structures of apocalmodulin and an apocalmodulin/SK potassium channel gating domain complex. Structure. 12:849–860 10.1016/j.str.2004.03.017 [DOI] [PubMed] [Google Scholar]
- Sigworth F.J. 1980. The variance of sodium current fluctuations at the node of Ranvier. J. Physiol. 307:97–129 [DOI] [PMC free article] [PubMed] [Google Scholar]
- Simoes M., Garneau L., Klein H., Banderali U., Hobeila F., Roux B., Parent L., Sauve R. 2002. Cysteine mutagenesis and computer modeling of the S6 region of an intermediate conductance IKCa channel. J. Gen. Physiol. 120:99–116 10.1085/jgp.20028586 [DOI] [PMC free article] [PubMed] [Google Scholar]
- Smith-Maxwell C.J., Ledwell J.L., Aldrich R.W. 1998. Role of the S4 in cooperativity of voltage-dependent potassium channel activation. J. Gen. Physiol. 111:399–420 10.1085/jgp.111.3.399 [DOI] [PMC free article] [PubMed] [Google Scholar]
- Wang M.H., Yusaf S.P., Elliott D.J., Wray D., Sivaprasadarao A. 1999. Effect of cysteine substitutions on the topology of the S4 segment of the Shaker potassium channel: implications for molecular models of gating. J. Physiol. 521:315–326 10.1111/j.1469-7793.1999.00315.x [DOI] [PMC free article] [PubMed] [Google Scholar]
- Wulff H., Gutman G.A., Cahalan M.D., Chandy K.G. 2001. Delineation of the clotrimazole/TRAM-34 binding site on the intermediate conductance calcium-activated potassium channel, IKCa1. J. Biol. Chem. 276:32040–32045 10.1074/jbc.M105231200 [DOI] [PubMed] [Google Scholar]
- Xia X.M., Fakler B., Rivard A., Wayman G., Johnson-Pais T., Keen J.E., Ishii T., Hirschberg B., Bond C.T., Lutsenko S., et al. 1998. Mechanism of calcium gating in small-conductance calcium-activated potassium channels. Nature. 395:503–507 10.1038/26758 [DOI] [PubMed] [Google Scholar]
- Yifrach O., MacKinnon R. 2002. Energetics of pore opening in a voltage-gated K(+) channel. Cell. 111:231–239 10.1016/S0092-8674(02)01013-9 [DOI] [PubMed] [Google Scholar]
- Yusaf S.P., Wray D., Sivaprasadarao A. 1996. Measurement of the movement of the S4 segment during the activation of a voltage-gated potassium channel. Pflugers Arch. 433:91–97 10.1007/s004240050253 [DOI] [PubMed] [Google Scholar]
- Zagotta W.N., Hoshi T., Dittman J., Aldrich R.W. 1994. Shaker potassium channel gating. II: Transitions in the activation pathway. J. Gen. Physiol. 103:279–319 10.1085/jgp.103.2.279 [DOI] [PMC free article] [PubMed] [Google Scholar]


