

Abstract
The chloride ion channel cystic fibrosis transmembrane conductance regulator (CFTR) displays a typical adenosine trisphosphate (ATP)-binding cassette (ABC) protein architecture comprising two transmembrane domains, two intracellular nucleotide-binding domains (NBDs), and a unique intracellular regulatory domain. Once phosphorylated in the regulatory domain, CFTR channels can open and close when supplied with cytosolic ATP. Despite the general agreement that formation of a head-to-tail NBD dimer drives the opening of the chloride ion pore, little is known about how ATP binding to individual NBDs promotes subsequent formation of this stable dimer. Structural studies on isolated NBDs suggest that ATP binding induces an intra-domain conformational change termed “induced fit,” which is required for subsequent dimerization. We investigated the allosteric interaction between three residues within NBD2 of CFTR, F1296, N1303, and R1358, because statistical coupling analysis suggests coevolution of these positions, and because in crystal structures of ABC domains, interactions between these positions appear to be modulated by ATP binding. We expressed wild-type as well as F1296S, N1303Q, and R1358A mutant CFTR in Xenopus oocytes and studied these channels using macroscopic inside-out patch recordings. Thermodynamic mutant cycles were built on several kinetic parameters that characterize individual steps in the gating cycle, such as apparent affinities for ATP, open probabilities in the absence of ATP, open probabilities in saturating ATP in a mutant background (K1250R), which precludes ATP hydrolysis, as well as the rates of nonhydrolytic closure. Our results suggest state-dependent changes in coupling between two of the three positions (1296 and 1303) and are consistent with a model that assumes a toggle switch–like interaction pattern during the intra-NBD2 induced fit in response to ATP binding. Stabilizing interactions of F1296 and N1303 present before ATP binding are replaced by a single F1296-N1303 contact in ATP-bound states, with similar interaction partner toggling occurring during the much rarer ATP-independent spontaneous openings.
INTRODUCTION
The ATP-binding cassette (ABC) protein CFTR is the product of the gene mutated in patients suffering from cystic fibrosis, the most frequent lethal genetic disorder in the Caucasian population. CFTR is unique among ABC proteins, which mostly function as transporters, in that it is an ion channel (Riordan et al., 1989). All ABC proteins are built from two homologous halves, each containing a transmembrane domain (TMD) and a nucleotide-binding domain (NBD). In CFTR, the TMDs form the pore of a chloride ion channel, while the NBDs regulate opening and closure (gating) of this pore through a cycle of ATP binding and hydrolysis (for review see Gadsby et al., 2006). In addition to the canonical ABC modules, CFTR also contains a cytosolic regulatory (R) domain that connects the two halves and is phosphorylated by PKA and other kinases (Tabcharani et al., 1991; Picciotto et al., 1992; Hallows et al., 2000; Kongsuphol et al., 2009).
The NBDs of ABC proteins are structurally conserved and consist of two subdomains. The β subdomain (or “head”) contains an F1-type ATPase core with conserved Walker A and B motifs for interaction with the phosphates of ATP and catalytic Mg2+ (Walker et al., 1982), complemented by an antiparallel β sheet that contacts the base and ribose of the bound nucleotide. The α-helical subdomain (or “tail”) is unique to ABC proteins and contains the ABC signature sequence (consensus: LSGGQ). The two subdomains are linked by the Q loop, named after a conserved glutamine (Q1291 in CFTR NBD2), which interacts with the γ phosphate of bound ATP (e.g., Hung et al., 1998; Hopfner et al., 2000; Karpowich et al., 2001). Comparison of crystal structures of ATP-free and ATP-bound NBDs have revealed an “induced-fit” conformational change upon ATP binding that involves an ∼15° rigid body rotation of the α-helical subdomain toward the β subdomain; a process in which the interaction of the Q-loop glutamine with the γ phosphate of ATP plays a key role (Hung et al., 1998; Gaudet and Wiley, 2001; Karpowich et al., 2001; Yuan et al., 2001; Procko et al., 2006).
In several crystal structures, two NBDs form tight head-to-tail homodimers with two molecules of ATP sandwiched at the interface (e.g., Hopfner et al., 2000; Smith et al., 2002; Chen et al., 2003) in composite ATP-binding sites formed by the “head” of one NBD and the “tail” of the other. In CFTR, and in other members of the C subfamily of ABC proteins, sequence similarity between the two NBDs is low. As a consequence, the composite binding site formed by the Walker motifs of the NBD2 head and the signature sequence of the NBD1 tail subdomain is a canonical functional site (NBD2 composite site) that actively hydrolyzes ATP (Ramjeesingh et al., 1999), whereas the composite site formed by the NBD1 head and the NBD2 tail subdomains (NBD1 composite site) contains substitutions at several key residues and is catalytically inactive (Aleksandrov et al., 2002).
Just as the transport cycle of ABC transporters, which alternate between inward- and outward-facing TMD conformations, is linked to formation/disruption of their NBD dimers (Hollenstein et al., 2007), gating of the CFTR ion pore is also coupled to this process. In CFTR, which retains ATP stably bound at the NBD1 composite site (Basso et al., 2003), it is the binding of ATP to the NBD2 head subdomain that initiates formation of the NBD1/NBD2 heterodimer (Vergani et al., 2003); and disruption of this tight dimer is normally prompted by ATP hydrolysis at the NBD2 composite site (Vergani et al., 2005; Csanády et al., 2010). Opening of the channel pore to a burst is tightly linked to formation (Vergani et al., 2005), and termination of a burst to disruption (Csanády et al., 2010), of the tight NBD dimer.
The conserved architecture of ABC proteins suggests conservation of basic mechanisms. It is therefore of general interest to identify the “functional skeleton” of these proteins, i.e., the network of residues that mediate allosteric interactions involved in major, conserved conformational changes. Such residues are expected to show a pattern of coevolution. Statistical coupling analysis has proven a useful tool for identifying pairs of coevolving positions within proteins (Lockless and Ranganathan, 1999), and has been successfully applied to identify a pair of residues at the CFTR NBD dimer interface shown to interact in a gating state–dependent manner (Vergani et al., 2005). Because the intra-NBD induced-fit rearrangement upon ATP binding is a prerequisite of the formation of a stable NBD dimer, we applied statistical coupling analysis to identify potential intra-NBD interactions involved in this process. Our scan identified a triad of coevolving positions corresponding to F1296 (in the Q loop), N1303 (a cystic fibrosis locus), and R1358 in NBD2 of CFTR. Interestingly, based on crystal structures of homologous proteins, interactions within the corresponding triad undergo a rearrangement upon ATP binding (e.g., Hung et al., 1998; Gaudet and Wiley, 2001; Karpowich et al., 2001; Procko et al., 2006), and in CFTR, substitutions of N1303 have been found to affect channel gating (Berger et al., 2002). We tested functional interactions within this predicted network using site-directed mutagenesis. Thermodynamic mutant cycles revealed changes in interactions between F1296 and N1303, but not between N1303 and R1358, during various steps in the gating cycle. Our results suggest that a toggle switch–like interaction pattern between F1296 and N1303 is involved in the intra-NBD2 induced-fit conformational change elicited by the binding of ATP.
MATERIALS AND METHODS
Molecular biology
CFTR mutants were constructed by using either pGEMHE-WT (Chan et al., 2000) or pGEMHE-K1250R (Vergani et al., 2005) as template. Mutations were introduced using the Quikchange mutagenesis kit (Agilent Technologies) and verified by full-length insert sequencing (LGC Genomics). NheI-linearized, purified DNA was transcribed in vitro using the mMessage T7 kit (Applied Biosystems).
Isolation and injection of Xenopus oocytes
Xenopus laevis oocytes were collagenase digested and isolated as described previously (Chan et al., 2000) and injected with 10 ng cRNA for macroscopic current recordings. After injection, oocytes were kept for 2–3 d at 18°C in OR2 solution (in mM: 82 NaCl, 2 KCl, 1 MgCl2, and 5 HEPES, pH 7.5 with NaOH) supplemented with 1.8 mM CaCl2 and 50 µg/ml gentamycin.
Electrophysiology
Macroscopic current recordings were performed in the inside-out excised patch configuration. Borosilicate pipettes were fire-polished to tip resistances of 2–5 MΩ. Pipette solution contained (in mM): 138 NMDG, 2 MgCl2, and 5 HEPES, pH 7.4 with HCl. Bath solution contained (in mM): 138 NMDG, 2 MgCl2, 5 HEPES, and 0.5 EGTA, pH 7.1 with HCl. Chloride-free bath solution occasionally used for baseline identification (see Fig. S2) contained (in mM): 140 Na-gluconate, 2 Mg-gluconate2, 10 HEPES, and 1 EGTA, pH 7.1 with NaOH. The continuously flowing bath solution was exchanged using electronic valves (HEKA). Solution exchange was essentially complete within ∼1 s, as reported by the rate of decay of endogenous Ca2+-activated Cl− currents upon washing out 2 mM CaCl2. CFTR channels were activated in inside-out patches by superfusion with 300 nM of catalytic subunit of bovine PKA (Sigma-Aldrich) in the presence of 2 mM Mg-ATP (Sigma-Aldrich). Lyophilized PKA was dissolved at 1 µg/µl in ddH2O containing 100 µM DTT. This stock solution was kept at 4°C for 1–2 wk. Mg-ATP was diluted from a 400-mM aqueous stock solution (pH 7.1 with NMDG). Inward macroscopic currents were recorded at room temperature (∼25°C) at a membrane potential of −80 mV (Axopatch 200B), digitized at 1 kHz (Digidata 1320A), and Gaussian-filtered at 50 Hz (pClamp8.2; MDS Analytical Technologies). Large macroscopic currents were occasionally measured at −20 or −40 mV, which did not influence our analysis because CFTR gating is mostly voltage independent (Cai et al., 2003).
Estimation of maximal open probability
Increasing [ATP] from 2 to 10 mM did not increase currents for any of the constructs studied here. Maximum open probability (Po;max) in saturating (2 mM) ATP was estimated by stationary noise analysis of macroscopic currents, as described previously (Sakmann and Neher, 1995). In brief, Po was calculated from the slope of plots of the variance (σ2; divided by the unitary current amplitude [i]) as a function of the mean (I) of the steady-state current, using the linear relationship:
| (1) |
To give equal weight to each recording, Po values computed for each individual record were averaged to obtain final Po;max estimates. The variance of baseline noise, measured in segments without channel openings in the same record, was subtracted from the variance of each test segment. To sample the true variance of the current fluctuations, recordings must be substantially longer than the intrinsic cycle time of single-channel gating. Therefore, noise analysis of segments that are too short yields overestimated Po values; simulations show that, regardless of the number of channels in the patch, stationary recordings longer than approximately two times the cycle time are necessary to obtain reasonable Po estimates (Fig. S1). In this study, the average durations of stationary segments of record used for estimating Po;max were 40–50 s for the wild-type (WT), F1296S, N1303Q, and F1296S/N1303Q constructs (estimated single-channel cycle times ∼1.25 s in saturating ATP; Fig. 8 A), but 100–130 s for K1250R, F1296S/K1250R, and N1303Q/K1250R, and ∼220 s for F1296S/N1303Q/K1250R (estimated single-channel cycle times ∼13 s in saturating ATP; Fig. 8 A).
Figure 8.

The intra-NBD2 induced fit upon ATP binding is associated with a toggle switch rearrangement of interactions between sites 1 and 2. (A) Cartoon representation of Scheme 2 with an example set of rates suitable to explain the gating of WT CFTR (black rates on arrows). Green, NBD1; blue, NBD2; cyan, TMD; yellow, ATP. Positions 1 and 2 within NBD2 are denoted by yellow letters, and stabilizing interactions among these and unidentified positions X and Y are represented by yellow connecting lines. The two rates assumed to be changed by the F1296S/N1303Q double mutation, and by the K1250R mutation, are shown in red and magenta, respectively, below the WT rates. (B) Table summarizing parameters Po;bas and KPo predicted by Scheme 2 for WT (using the rates in black in A) and F1296S/N1303Q (using the two rates in red in A), as well as Po;max and τrelax for K1250R and F1296S/N1303Q/K1250R (using the rates printed in magenta for steps C4→O2 and O2→C1). Predicted parameters were calculated using standard Q-matrix techniques. For comparison, the corresponding measured parameters are printed underneath in parentheses.
Estimation of basal open probability
Basal, ATP-independent open probability (Po;bas) was determined from multichannel records. Segments in which individual channel gating events in the absence of ATP could be clearly resolved (see Fig. 3 A and the top three traces in Fig. 4 A) were idealized using half-amplitude threshold crossing, and NPo;bas was calculated from the resulting event lists using the cycle-time method:
| (2) |
where N is the number of channels in the patch, lk and tk are the conductance level and duration of the kth event, and . For segments in zero ATP in which individual gating events could not be resolved (see bottom trace in Fig. 4 A), the baseline current was determined by replacing bath Cl− with the bulky anion gluconate, which does not permeate through CFTR. Because at our recording voltage of −80 mV no current flows through CFTR channels under such conditions, such zero chloride segments were used to establish the baseline current (Fig. S2). After baseline subtraction, i(NPo;bas) was estimated by cursor measurement as the mean macroscopic current in zero ATP (Ibas).
Figure 3.

A stabilizing interaction between sites 1 and 2 facilitates channel opening in the absence of ATP. (A) Representative traces of WT, F1296S, N1303Q, and F1296S/N1303Q currents illustrating segments in 0 mM ATP and bracketing segments in 2 mM ATP. Dotted lines show zero current level. (B) Estimation of Po;max for WT (black), F1296S (red), N1303Q (blue), and F1296S/N1303Q (green) by stationary noise analysis. Each symbol plots the variance of macroscopic current fluctuations divided by the unitary current amplitude for a steady segment of recording in 2 mM ATP, as a function of the mean current. Open probabilities calculated for each individual segment were averaged to obtain final Po;max estimates (refer to Materials and methods) for each construct. (C) Po values in 0 mM ATP (Po;bas), computed as the product of Po;bas/Po;max ratios (refer to Materials and methods) and Po;max values (from B). (D) Thermodynamic mutant cycle built on Po;bas/(1−Po;bas) values; each corner is represented by the side chains at sites 1 and 2, respectively. ΔΔG0 values (mean ± SEM) on arrows show mutation-induced changes in the stability of the open state with respect to the closed state in the absence of ATP, and were used to calculate (refer to Materials and methods) the coupling energy for the site-1–site-2 interaction (ΔΔGint(open–closed in 0 mM ATP)).
Figure 4.

The stabilizing site-1–site-2 interaction that facilitates channel opening in the absence of ATP is preserved in the ATP hydrolysis–deficient K1250R mutant. (A) Representative traces of K1250R, F1296S/K1250R, N1303Q/K1250R, and F1296S/N1303Q/K1250R currents illustrating segments in 0 mM ATP and bracketing segments in 2 mM ATP. Dotted lines show zero current level (determined for the triple mutant similarly to that in Fig. S2). (B) Estimation of Po;max for K1250R (black), F1296S/K1250R (red), N1303Q/K1250R (blue), and F1296S/N1303Q/K1250R (green) by stationary noise analysis. (C) Po values in 0 mM ATP (Po;bas), computed as in Fig. 3 C. (D) Thermodynamic mutant cycle built on Po;bas/(1−Po;bas) values; notation as in Fig. 3 D.
Because in the same patch the mean current in bracketing segments in saturating ATP (Imax) is given by Imax = iNPo;max (with N identical to that in the zero ATP segment), the ratio i(NPo;bas)/Imax is equal to the ratio Po;bas/Po;max. Thus, Po;bas was obtained as the product
| (3) |
where Po;max was determined by stationary noise analysis; see above.
Estimation of apparent affinities for ATP
Mean macroscopic currents were calculated by cursor measurements after manual baseline correction using pClamp8.2. To construct ATP dose–response curves, we applied the protocol 0 mM ATP→2 mM ATP→test [ATP]→2 mM ATP→0 mM ATP. The ATP-dependent fraction of the current was calculated for each test [ATP] as (I−I0)/(Imax−I0), where I is the current in the presence of the test [ATP], I0 is the mean of the basal currents in 0 mM ATP before and after the test, and Imax is the mean of the currents in the bracketing 2-mM ATP segments. Dose–response curves were fitted by the Michaelis-Menten equation to obtain apparent affinities for open probability (KPo).
Because [ATP] mostly affects the rate of opening to a burst (rCO), the apparent affinity of ATP for affecting this opening rate (KrCO) can be estimated from KPo as follows.
Suppose that
where rCO;bas is the spontaneous opening rate, and rCO;max is the maximal opening rate at saturating [ATP], while the rate of closing from a burst (rOC) is constant. Because
it is easy to show that
where
Finally, because for all our constructs rCO;bas << rOC, we could use the approximate equation
| (4) |
to calculate KrCO from the measured KPo and Po;max values (compare Csanády et al., 2000). Because ATP binding to closed channels is likely at rapid equilibrium relative to the rate of channel opening, KrCO approximates the equilibrium dissociation constant (Kd) of ATP from closed channels.
Estimation of relaxation time constants
Macroscopic current decay time constants were obtained by fitting the decay time courses (pClamp 8.2) with single-exponential functions.
Mutant cycle analysis
For a mutant cycle built on the equilibrium constant (Keq) of a conformational transition from state A to state B of the protein, energetic coupling (ΔΔGint) between two studied positions was calculated as described previously (Vergani et al., 2005). The energetic stability of state B relative to state A is given by
where R = 8.31 J/(mol°K), and T is absolute temperature. Energetic coupling between positions 1 and 2 is defined as the difference between changes in the stability of state B relative to state A along parallel sides of the mutant cycle, i.e.,
| (5) |
where the superscripts refer to the four constructs in the mutant cycle (M1, site-1 single mutant; M2, site-2 single mutant; M1M2, double mutant). In this study, we used equilibrium constants between closed and open states in the absence of ATP (Keq = Po;bas/(1−Po;bas)), between closed and open states in saturating ATP for ATP hydrolysis–deficient mutants (Keq = Po;max/(1−Po;max)), and between ATP-bound and ATP-free closed states (Keq ≈ KrCO).
Analogously, mutant cycles can also be built on transition rates, e.g., by substituting parameters
into Eq. 5 (rAB is the transition rate from state A to state B). ΔΔGint from such a mutant cycle is conventionally interpreted to reflect the change in the strength of the interaction between the two target residues upon transiting from the stable (“ground”) state A to the transition state (T‡), which leads to ground state B. Such a mutant cycle is shown in Fig. 5 (C and D).
Figure 5.

Energetic coupling between sites 1 and 2 changes between ATP-bound open and ATP-free closed states, but not between ATP-bound closed and open states. (A) Summary of Po;max values for K1250R (black), F1296S/K1250R (red), N1303Q/K1250R (blue), and F1296S/N1303Q/K1250R (green) obtained from the data presented in Fig. 4 B. (B) Thermodynamic mutant cycle built on Po;max/(1−Po;max) values showing changes (mean ± SEM) in the stability of the open state with respect to the closed state in saturating ATP. (C) Time courses of macroscopic current decay upon sudden washout of 2 mM ATP (gray traces), and mono-exponential fit lines (color-coded as in A; the red and black fit lines overlap). The trace for WT (labeled), shown as a comparison, is fitted with a single exponential (magenta) with a time constant of 459 ms. (Inset) Mean (±SEM) closing time constants (τrelax) obtained from 7–22 similar experiments for each construct. (D) Thermodynamic mutant cycle built on macroscopic relaxation rates (1/τrelax).
Statistics
All data are presented as mean ± SEM. Statistical significance was assessed by one or two sample unpaired Student’s t tests; differences are reported as significant for P < 0.05.
Online supplemental material
Fig. S1 demonstrates how the accuracy of Po estimation by noise analysis depends on the duration of the record. Fig. S2 illustrates the protocol to determine the baseline current for mutants with high ATP-independent basal activity. Figs. S3 and S4 show verification of Po;max estimates in single-channel patches for WT, F1296S, N1303Q, and F1296S/N1303Q (Fig. S3), as well as for K1250R, F1296S/K1250R, N1303Q/K1250R, and F1296S/N1303Q/K1250R (Fig. S4). Fig. S5 investigates the site-1–site-2 interaction in the absence of ATP by using an F-to-A substitution at site 1. Fig. S6 illustrates apparent affinities for ATP in the K1250R background. Fig. S7 shows example macroscopic current traces to illustrate the apparent affinities of R1358A and R1358A/N1303Q for ATP. Fig. S8 depicts predicted Po time courses in response to the addition/removal of ATP for WT, F1296S/N1303Q, K1250R, and F1296S/N1303Q/K1250R, calculated using Scheme 2. The online supplemental material is available at http://www.jgp.org/cgi/content/full/jgp.201010434/DC1.
RESULTS
Target site identification and selection of mutations
Statistical coupling analysis of more than 10,000 ABC protein NBD sequences (Lockless and Ranganathan, 1999) indicates evolutionary coupling between a triad of residues corresponding to positions 1296 (site 1), 1303 (site 2), and 1358 (site 3) in NBD2 of CFTR. Out of the three positions, site 1 is the least conserved (e.g., a phenylalanine in NBD2, but a methionine in NBD1, of CFTR), whereas asparagine at site 2 and arginine at site 3 are highly conserved (see histograms for total alignments in Fig. 1, A and B).
Figure 1.

Statistical coupling analysis predicts coevolution of the triad F1296-N1303-R1358. (A, a and b) Amino acid frequency distributions of sites 1 and 2 (corresponding to positions 1296 and 1303 in CFTR) in a multiple sequence alignment (MSA) of >10,000 ABC NBD sequences (http://pfam.sanger.ac.uk/family?PF00005). Phenylalanine and asparagine are the most frequent amino acids at sites 1 and 2, respectively. (c) Within the subset of sequences (n = 1,023) that contain glutamine at site 2, serine and alanine are prevalent at site 1. (d) In the subset (n = 1,364) that contains serine at site 1, glutamine is the most frequent residue at site 2. (B) Amino acid frequency distributions of site 3 (corresponding to position 1358 in CFTR), calculated for the total sequence alignment (a; arginine is found in 60% of sequences), and for the subsets that contain a glutamine at site 2 (b) or a serine at site 1 (c). (C) Ribbon diagram of model structure encompassing the entire α and part of the β subdomain of CFTRs NBD2 (residues 1250–1371; from Mornon et al., 2008). To illustrate their relative spatial positioning, conserved residues of the Walker A and B motif and the conserved glutamine in the Q loop are shown in blue stick representation, and residues of the triad studied here are highlighted in navy blue. Bound ADP is shown in magenta. (D and E) Ribbon diagrams of the segment of TAP1 corresponding to segment 1296–1358 of CFTR from the crystal structures of TAP1 solved in complex with MgADP (D; Gaudet and Wiley, 2001) and ATP (E; Procko et al., 2006). Residues corresponding to F1296, N1303, and R1358 in CFTR NBD2 are shown in stick representation (navy blue) and labeled site 1, 2, and 3, respectively. Dotted magenta lines are H bonds computed by Swiss Pdb Viewer v.3.7.
These positions map to the interface between the α and β subdomains of the NBDs (Fig. 1 C). In ADP- and ATP-bound crystal structures of the NBD domain of the homologous ABC protein TAP1, which contains side chains identical to those found in NBD2 of CFTR at all three corresponding positions, interactions among these residues are seen to change upon ATP binding (Fig. 1, D and E). Whereas in the ADP-bound structure (Gaudet and Wiley, 2001) the site-2 asparagine side chain forms a hydrogen bond with the arginine side chain at site 3 (Fig. 1 D), in the ATP-bound structure (Procko et al., 2006) it binds instead to the backbone carbonyl oxygen of the site-1 phenylalanine (Fig. 1 E).
To quantify any energetic coupling between the corresponding residues in NBD2 of CFTR, we first designed mutants for double mutant cycle analysis of the site-1/site-2 pair. By elongating the side chain at site 2, the substitution N1303Q might interfere with potential H bonds linking residue 1303 to either 1296 or 1358. Indeed, introducing a “perturbation” at site 2 in the alignment, by considering only the subset of sequences that contain a glutamine at this position (Lockless and Ranganathan, 1999), results in a markedly altered side-chain frequency distribution at site 1 (Fig. 1 A, dark red), with serine becoming the most frequent residue. Similarly, filtering the alignment to a subset containing serine at site 1 results in a clear rearrangement of the frequency distribution at site 2 (Fig. 1 A, blue), with glutamine becoming most prevalent. Thus, analysis of existing sequences suggests that mutations at these sites have not occurred independently, with a change to serine at site 1 most frequently accompanied by a change to glutamine at site 2. This pattern of coevolution between sites 1 and 2 suggests that possible functional interactions between the two residues, perturbed by single mutations F1296S and N1303Q, might be restored in a double mutant F1296S/N1303Q.
Because the side-chain frequency distribution at site 3 (Fig. 1 B, gray) is more profoundly altered by our site-2 than by our site-1 perturbation (Fig. 1 B, compare dark red vs. blue), we chose to study the interaction between sites 2 and 3 in a second mutant cycle. To perturb site 3, we chose mutation R1358A, which is likely to prevent a possible hydrogen-bonding interaction between the R1358 and N1303 side chains.
Phosphorylation dependence of channel activity is largely unchanged for F1296S, N1303Q, and F1296S/N1303Q CFTR mutants, whereas the double mutant displays significantly increased ATP-independent activity
Similarly to WT CFTR (Fig. 2 A), in patches excised from resting oocytes expressing F1296S (Fig. 2 B), N1303Q (Fig. 2 C), or double mutant F1296S/N1303Q (Fig. 2 D) CFTR channels, we observed very low channel activity upon the application of 2 mM ATP, but robust macroscopic currents could be activated for all three constructs by the subsequent addition of 300 nM PKA to the bath solution. Thus, these mutations in NBD2 largely preserve phosphorylation dependence of channel activity. Upon washout of PKA in the continued presence of ATP, the rapid partial decline in current reported previously for WT (Csanády et al., 2000) was also observed, although to variable degrees, for the mutant channels (compare Fig. 2, A–D). Importantly, although ATP removal rapidly abolished currents for both single mutants just as for WT (Fig. 2, A–C), in the case of the double mutant, a constitutive basal activity persisted even after ATP removal (Fig. 2 D, magnified in inset) and did not vanish even over the time course of several minutes.
Figure 2.

Phosphorylation dependence is little affected by site-1 and site-2 mutations. (A–D) Inward chloride currents recorded in patches excised from resting oocytes expressing WT (A), F1296S (B), N1303Q (C), and F1296S/N1303Q (D) CFTR. In each case, the application of 2 mM ATP (bars) elicits only small currents relative to those activated by subsequent exposure to 300 nM PKA plus 2 mM ATP (bars). Note the rapid partial deactivation after the removal of PKA in A–D and the persistent channel activity after the removal of ATP in D (magnified in inset). Membrane potential was −80 mV in A–C, but −20 mV in D.
Energetic coupling between sites 1 and 2 changes during ATP-independent opening
To quantify for each construct the spontaneous, ATP-independent open probability (Po;bas) of channels that had been prephosphorylated by PKA, we recorded currents in macropatches in the absence of ATP, bracketed by exposures to saturating 2 mM ATP (Fig. 3 A). By comparing channel activities in the ATP-free segments with those in the bracketing segments in saturating 2 mM ATP, we could estimate the ratio Po;bas/Po;max (refer to Materials and methods; Po;max is the maximal open probability in saturating ATP). In addition, we could determine Po;max for each construct by stationary noise analysis of steady segments of record in saturating ATP (Fig. 3 B; refer to Materials and methods), which allowed us to estimate the absolute value of Po;bas (Fig. 3 C). Although maximal open probabilities were little changed in all three mutant constructs (0.22 ± 0.02, 0.32 ± 0.04, and 0.33 ± 0.03, respectively, for F1296S, N1303Q, and F1296S/N1303Q) compared with WT (0.35 ± 0.03) (Fig. 3 B), open probability in zero ATP was ∼10-fold higher for the F1296S/N1303Q double mutant than for WT or the two single mutants (Fig. 3 C). Because the effect of introducing a mutation at one site highly depended on the residue at the other site, free energy changes along parallel sides of the mutant cycle built on the closed–open equilibrium constant Po;bas/(1−Po;bas) were strikingly different and yielded a negative interaction-free energy of ΔΔGint = −2.21 ± 0.84 kT, which is significantly different from zero (P < 0.05) (Fig. 3 D).
Because openings in the absence of ATP must necessarily be nonhydrolytic, the NBD2 Walker A mutation K1250R, known to abolish ATP hydrolysis in ABC proteins (Lerner-Marmarosh et al., 1999; Payen et al., 2005), is not expected to affect this spontaneous gating. To test this idea, we studied the same mutant cycle also in a K1250R background (Fig. 4). Indeed, although K1250R, F1296S/K1250R, and N1303Q/K1250R constructs showed hardly detectable basal activity, a markedly elevated spontaneous activity was observed for the F1296S/N1303Q/K1250R triple mutant (Fig. 4 A), persisting even minutes after ATP washout. Using the same methodology of combining Po;bas/Po;max ratios with estimates of Po;max obtained from noise analysis (Fig. 4 B), we could quantify Po;bas for all constructs (Fig. 4 C). Similarly to their hydrolytic counterparts, Po;bas was ∼10-fold higher in F1296S/N1303Q/K1250R compared with the other three constructs, and the mutant cycle built on the closed–open equilibrium constant Po;bas/(1−Po;bas) yielded a ΔΔGint of −2.36 ± 0.58 kT (Fig. 4 D)—again, significantly different from zero (P < 0.01).
Because of variable expression levels, the Po;max values of the various constructs were not necessarily obtained from patches containing comparable numbers of channels (see Figs. 3 B and 4 B). To verify that this condition does not bias our analysis, we also verified Po;max values in patches containing only one or a few active channels, in which the total number of channels could be estimated with confidence (Csanády et al., 2000). Conventional dwell-time analysis of such records yielded Po;max values similar to those obtained by noise analysis both for the WT, F1296S, N1303Q, and F1296S/N1303Q constructs (Fig. S3, A and B), and for the analogous constructs in the K1250R background (Fig. S4, A and B).
Finally, to verify that the high basal activity is not a unique property of constructs comprising the serine–glutamine pair at sites 1 and 2, we also replaced F1296 with an alanine, the second most frequent site-1 residue in the 1303Q subset (see Fig. 1 A, dark red bar chart). Again, Po;bas of the double mutant F1296A/N1303Q was ∼10-fold larger than that of WT or the single mutants F1296A and N1303Q (Fig. S5, A–C), producing a negative ΔΔGint for the mutant cycle built on Po;bas/(1−Po;bas) values (Fig. S5 D), even though in this case the overall free energy change (−1.18 ± 0.84 kT) could not be claimed significantly different from zero because of the smaller Po;bas values obtained for WT in this set of experiments (Fig. S5 C, black).
Collectively, the negative ΔΔGint for all three cycles built on free energy differences between open and closed ground states in the absence of ATP indicates that energetic coupling between sites 1 and 2 changes upon ATP-independent opening. One possible interpretation is that a stabilizing interaction between these residues is formed in the open conformation; however, other interpretations cannot be ruled out (e.g., a destabilizing interaction that is present in the closed state is lost upon channel opening).
In a nonhydrolytic background, interaction between sites 1 and 2 is similar for ATP-bound closed and open states, but changes after ATP removal
Because the interaction between sites 1 and 2 changes during ATP-independent spontaneous openings (Figs. 3 D and 4 D), we wondered whether the same interaction also plays a role in normal, ATP-dependent channel opening. However, because the ATP-driven gating of WT CFTR is not an equilibrium process (Csanády et al., 2010), the ratio Po;max/(1−Po;max) obtained in the presence of saturating ATP cannot be interpreted in terms of a free energy difference between the ATP-bound closed and open states (Csanády, 2009). Evaluation of this ratio is only meaningful for channel constructs in which gating is reduced to a reversible equilibrium process, e.g., by catalytic site mutations that abolish ATP hydrolysis. Thus, to test for a possible change in interaction between sites 1 and 2 during ATP-driven reversible opening and closure, we repeated the mutant cycle analysis in the nonhydrolytic K1250R background, comparing Po;max values for K1250R, F1296S/K1250R, N1303Q/K1250R, and F1296S/N1303Q/K1250R (Fig. 5 A), obtained by noise analysis (Fig. 4 B). Interestingly, Po;max of K1250R (0.68 ± 0.06; n = 6) was only slightly affected by the substitutions at sites 1 and 2, and even these small changes were mostly additive (Fig. 5 A; compare Fig. S4 B), such that a mutant cycle built on Po;max/(1−Po;max) yielded a ΔΔGint of zero (−0.03 ± 0.14 kT; Fig. 5 B; compare Fig. S4 C). Thus, in channels in which ATP hydrolysis is prevented, the site-1–site-2 interaction is similar in the ATP-bound closed state and the ATP-bound open state.
Intriguingly, we observed large differences in the rates of macroscopic current relaxation upon sudden removal of ATP for these nonhydrolytic mutants (Fig. 5 C), despite them having similar steady-state Po in saturating ATP. The K1250R mutation itself is known to prolong open-channel burst durations by 20–30-fold (Vergani et al., 2005; Csanády et al., 2006) due to the slow rate of dissociation of the ATP-bound NBD dimer in the absence of ATP hydrolysis. Consistent with those reports, upon the sudden removal of ATP, we saw macroscopic K1250R currents decline with a time constant of ∼8 s (Fig. 5 C, black single-exponential fit line and black bar in inset), in contrast to currents of WT CFTR that declined abruptly, with a time constant of <1 s (Fig. 5 C, magenta fit line). Although neither the F1296S nor the N1303Q mutation, when introduced one at a time, affected the time constant of current relaxation of K1250R upon ATP removal (Fig. 5 C, red and blue fit lines and bars), this relaxation time constant (τrelax) was prolonged by approximately fourfold, to 31 ± 5 s (n = 10), in the triple mutant F1296S/N1303Q/K1250R (Fig. 5 C, green fit line and bar). As a consequence, a mutant cycle built on these relaxation rates yielded a positive ΔΔGint of +1.25 ± 0.19 kT (Fig. 5 D), which is significantly (P < 0.0001) different from zero. Thus, although the interaction between sites 1 and 2 was not seen to change between ATP-bound open and closed ground states (Fig. 5 B), the relaxation data (Fig. 5, C and D) imply that there is a significant change in this interaction somewhere along the pathway from the ATP-bound open conformation to the inactive, ATP-free closed conformation.
Right-shift in ATP dependence of opening rate for F1296S/N1303Q indicates a change in interaction between sites 1 and 2 upon ATP binding to closed channels
To test whether the site-1–site-2 interaction was affected by ATP binding, we evaluated the apparent affinity for ATP to open WT, F1296S, N1303Q, and F1296S/N1303Q channels. To this end, macroscopic currents of channels prephosphorylated by 300 nM PKA were recorded in test concentrations of 10, 50, and 200 µM ATP, using an [ATP] protocol of 0 mM→2 mM→test→2 mM→0 mM (Fig. 6 A). We first obtained the apparent affinity for open probability (KPo) by plotting [ATP] dependence of the ATP-sensitive fraction of the current (Itest−I0)/(Imax−I0), where I0, Itest, and Imax are I in 0 mM, test, and 2 mM ATP (Fig. 6 B, solid symbols), followed by fitting of the resulting dose–response curves by the Michaelis-Menten equation (Fig. 6 B, solid lines). The resulting KPo values (Fig. 6 B, inset) were then used to calculate apparent affinities for channel opening rate (KrCO), obtained as KrCO = KPo/(1−Po;max) (refer to Materials and methods; Po;max values were taken from Fig. 3 B). Just as for KPo, the resulting KrCO values were slightly lower for F1296S and N1303Q than for WT, but approximately twofold increased for the double mutant F1296S/N1303Q (Fig. 6 C). A thermodynamic mutant cycle based on KrCO yielded an interaction-free energy of ΔΔGint = −1.24 ± 0.21 kT (Fig. 6 D), which, although small, is significantly different from zero (P < 0.0001), suggesting that the interaction between sites 1 and 2 is indeed altered by ATP binding. Unexpectedly, however, the negative sign of this interaction energy implies either that a stabilizing interaction between the two residues is lost upon ATP binding, or that the KrCO value we measure is a complex parameter that reflects the equilibrium distribution of the channels between more than two closed states (see Discussion). This subtle effect could not be detected in a nonhydrolytic background, likely due to the much larger effect on ATP affinity of the Walker A lysine mutation (compare Vergani et al., 2003). Thus, in the K1250R background, apparent ATP affinities were three- to fourfold decreased (Fig. S6, A and B), corresponding to six- to ninefold increased values of KrCO (Fig. S6 C), but a mutant cycle built on the latter values yielded a ΔΔGint not significantly different from zero (Fig. S6 D).
Figure 6.

ATP binding affects energetic coupling between sites 1 and 2 in closed channels. (A) [ATP] dependence of macroscopic currents was assayed for WT (top left), F1296S (top right), N1303Q (bottom left), and F1296S/N1303Q (bottom right) channels by exposure to various test [ATP] bracketed by exposures to 2 mM ATP. (B) ATP-dependent current fractions (I−I0)/(Imax−I0) plotted as a function of [ATP] for WT (black), F1296S (red), N1303Q (blue), and F1296S/N1303Q (green). Each plot was fitted by the Michaelis-Menten equation (solid lines); predicted midpoints (KPo) are shown in the inset. (C) Estimates of KrCO for each construct, calculated (refer to Materials and methods) using KPo from B and Po;max from Fig. 3 B. (D) Thermodynamic mutant cycle built on KrCO values.
Truncation of the site-3 arginine side chain promotes spontaneous, ATP-independent opening regardless of the side chain at site 2
To determine the functional importance of site 3 within our triad of target residues (Fig. 1), we investigated functional coupling between sites 2 (position 1303) and 3 (position 1358) by comparing the effects of removal of the R1358 side chain (R1358A) in either a WT or an N1303Q background. Interestingly, after prephosphorylation by 300 nM PKA, both R1358A and R1358A/N1303Q channels retained substantial basal activity after ATP removal (Fig. 7 A; traces for WT and N1303Q are illustrated in Fig. 3 A). Combining Po;bas/Po;max, obtained from current segments in 0 mM and bracketing periods in 2 mM ATP with Po;max estimated for the 2-mM ATP segments using stationary noise analysis (Fig. 7 B), provided Po;bas estimates (Fig. 7 C) that were higher in both R1358A and R1358A/N1303Q compared with WT or N1303Q. Therefore, shortening the arginine side chain at site 3 caused a similar, ∼1.5-kT, stabilization of the ATP-free open state on parallel sides of the mutant cycle (Fig. 7 D; ΔΔGint = −0.26 ± 0.91 kT; not significantly different from zero). This suggests that there is no change in coupling between sites 2 and 3 upon channel opening in the absence of nucleotide, and that the stabilization of the ATP-free open state probably reflects the loss of an interaction between the R1358 side chain and a residue(s) other than N1303.
Figure 7.

Removal of the arginine side chain at site 3 affects channel gating regardless of the residue at site 2. (A) Representative traces of R1358A and R1358A/N1303Q currents illustrating segments in 0 mM ATP and bracketing segments in 2 mM ATP. Dotted lines show zero current level. (B) Estimation of Po;max for WT (black), R1358A (red), N1303Q (blue), and R1358A/N1303Q (green) by stationary noise analysis. Estimated Po;max was 0.62 ± 0.05 for R1358A and 0.36 ± 0.04 for R1358A/N1303Q. (C) Po values in 0 mM ATP (Po;bas), computed as in Fig. 3 C. (D) Thermodynamic mutant cycle built on Po;bas/(1−Po;bas) values; notation as in Fig. 3 D. (E) ATP-dependent current fractions (I−I0)/(Imax−I0) plotted as a function of [ATP] for WT (black), R1358A (red), N1303Q (blue), and R1358A/N1303Q (green). Each plot was fitted by the Michaelis-Menten equation (solid lines); predicted midpoints (KPo) are shown in the inset. (F) Estimates of KrCO for each construct, calculated (refer to Materials and methods) using KPo from E and Po;max from B. (G) Thermodynamic mutant cycle built on KrCO values.
We also investigated a possible change in coupling between sites 2 and 3 upon ATP binding by studying [ATP] dependence of macroscopic currents (sample current traces for R1358A and R1358A/N1303Q are shown in Fig. S7, A and B). Fitting the [ATP] dose–response curve of the ATP-sensitive current fractions (Fig. 7 E) yielded a slightly increased KPo value for R1358A/N1303Q (inset), but for the calculated KrCO values (Fig. 7 F), a similar trend was apparent even for R1358A. Therefore, a mutant cycle based on KrCO values yielded a ΔΔGint of −0.45 ± 0.28 kT, which is not significantly different from zero.
DISCUSSION
Side-chain interactions within coevolved triad might be involved in intra-NBD conformational change induced by ATP binding
We have identified a triad of positions (sites 1, 2, and 3) within the NBD modules of ABC transporters, which show a pattern of coevolution based on analysis of multiple sequence alignments (Fig. 1). Site 1, corresponding to F1296 in NBD2 of CFTR, is located on the Q loop, which links the α-helical subdomain to the core β subdomain and is believed to play a key role in coupling the binding of ATP to a rigid-body rotation of the α-helical subdomain toward the core domain—a conformational change we will refer to as “induced fit” (Karpowich et al., 2001; Yuan et al., 2001; Smith et al., 2002). The idea that interactions within the coevolved triad might be involved in this induced-fit motion is supported by comparison of ABC crystal structures obtained in the absence and presence of ATP. For instance, in TAP1, the site-1 phenylalanine backbone forms an H bond with the asparagine at site 2 (corresponding to N1303 in CFTR’s NBD2) when ATP is bound to the protein (Procko et al., 2006), whereas in the ADP-bound form (Gaudet and Wiley, 2001), site 2 forms an H bond with the arginine at site 3 (corresponding to R1358 in NBD2 of CFTR). In addition, the triad is located at the “transmission interface” between the NBDs where ATP binds and is hydrolyzed and the TMDs, which form the ion permeation pore (or substrate translocation pathway for transporters) (Urbatsch et al., 2000; Hollenstein et al., 2007). Detailed studies on the dynamics of this interface are a first step toward a better understanding of the coupling mechanism.
Phenotypic pattern of single and double mutants at site 1 and 2 suggests toggle switch mechanism
Using mutants F1296S, N1303Q, and F1296S/N1303Q, we studied the interaction between sites 1 and 2 in the form of mutant cycles built on (a) ATP-independent spontaneous activity (i.e., Po;bas/(1−Po;bas)) both in hydrolysis-competent (Fig. 3 D) and (b) in catalytically inactive (Fig. 4 D) background; (c) ATP-dependent maximal activity (i.e., Po;max/(1−Po;max)) (Fig. 5 B) and (d) deactivation rate upon ATP removal (Fig. 5 D) of catalytically incompetent constructs; and (e) apparent affinity for ATP to open the channels (Fig. 6 D). Interestingly, although four of the above five mutant cycles (Figs. 3 D, 4 D, 5 D, and 6 D) yielded ΔΔGint significantly different from zero, in each case this was due to a significantly altered phenotype in the double mutant F1296S/N1303Q, whereas the single mutations F1296S and N1303Q did not measurably affect gating (Figs. 3–6). Such a phenomenon would be expected if the residues at sites 1 and 2 participated in a switch mechanism, such that stabilizing interactions of both residues with some other positions, formed in conformational state A, would be replaced by a stabilizing interaction between residues 1 and 2 in a different conformation B. Compensatory losses of interactions would then equivalently destabilize both conformational states in the single mutants, leaving kinetic parameters of the A→B transition unaffected, whereas in the double mutant, state A would be destabilized more than state B, producing a kinetically observable effect. We therefore considered the possibility that the site-1–site-2 interaction functions as a switch, toggling between a state in which stabilizing F–X and N–Y interactions are formed, and a state in which these two interactions are replaced by one stabilizing F–N interaction.
A kinetic interpretation of state-dependent side-chain interactions between site 1 and site 2
What does a thermodynamic mutant cycle tell us about the energetics of the interaction between two positions in a protein? In principle, a mutant cycle built on the equilibrium constant for a conformational transition from state A to state B of the protein reports the change in the strength of the interaction between the two target residues upon transition A→B (Vergani et al., 2005); for example, a negative interaction-free energy (ΔΔGint) could result from formation of a stabilizing interaction in state B (or breaking of a destabilizing interaction present in state A). However, several complicating factors occur in real proteins that hinder simple interpretations. For instance, the ΔΔGint can be used as a quantitative estimate for interaction energy between the two target sites only if the mutations abolish the native interaction between the two target positions. Further, the apparent equilibrium constant upon which the mutant cycle is built might in reality reflect the equilibrium distribution between more than two conformational states, in which case the interpretation of the size and sign of ΔΔGint is not so straightforward. Bearing these limitations in mind, can we build a kinetic scheme, detailing changes in energetic coupling within the triad, consistent with our results and current knowledge on ABC protein structure?
Previous work has established that CFTR channel opening in saturating ATP is rate limited by a slow step that follows ATP binding (Venglarik et al., 1994; Winter et al., 1994; Zeltwanger et al., 1999; Csanády et al., 2000) to NBD2 (Vergani et al., 2003) and reflects formation of the NBD1–NBD2 heterodimer (Vergani et al., 2005). The occurrence of infrequent ATP-independent openings, observable even for WT channels (Fig. 3, A and C; compare Bompadre et al., 2005), suggests the presence of an additional open state in which the NBD2 composite site remains unliganded (O in Scheme 1).
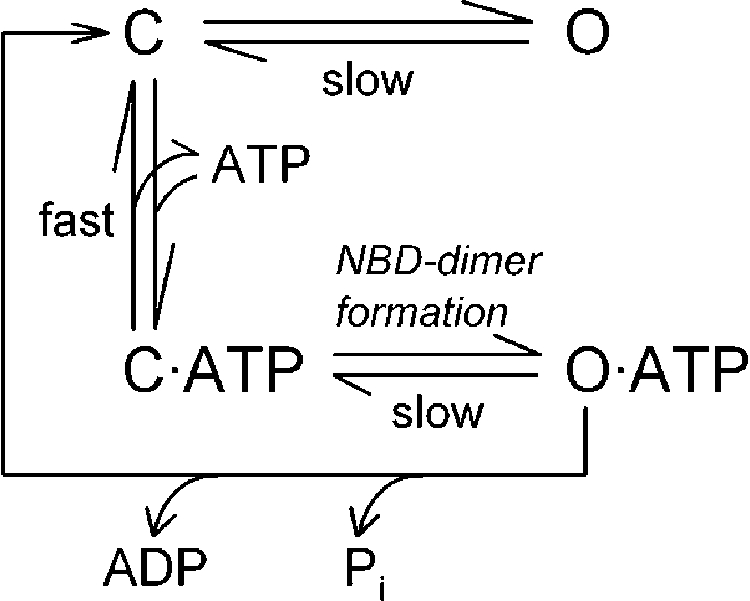 |
(SCHEME 1) |
Based on this simple scheme, the equilibrium constant between states C and O is given by Po;bas/(1−Po;bas), and that between states C·ATP and C is approximated by the parameter KrCO. Because for WT channels ATP-driven openings (to state O·ATP) are preferentially terminated by ATP hydrolysis (directly back to state C), the equilibrium constant between states C·ATP and O·ATP can be obtained only for ATP hydrolysis–deficient mutants (as Po;max/(1−Po;max)). For such nonhydrolytic mutants, the rate of macroscopic current relaxation after the sudden removal of ATP from patches containing many channels has been used to estimate the slow rate O·ATP→C·ATP, on the assumption that the rate C·ATP→C is much faster than the slow rate of opening (of ∼1 s−1), which implies that channels that have closed in the absence of ATP will mostly lose ATP before having a chance to reopen.
Although Scheme 1 can be easily equipped with rate constants that describe the gating of WT or mutant CFTR channels (e.g., Zeltwanger et al., 1999; Csanády et al., 2000), the set of results we obtained for the interaction between sites 1 and 2 is not easily accommodated into this simple model. For example, the negative ΔΔGint for the mutant cycles built on Po;bas/(1−Po;bas) (Figs. 3 D and 4 D) suggests a stabilizing site-1–site-2 interaction in state O, not present in state C. At the same time, the negative ΔΔGint for the cycle built on KrCO (Fig. 6 D) suggests a stabilizing interaction in state C, not present in state C·ATP. Although these two observations could in principle be reconciled by assuming a stabilizing interaction in O, no interaction in C, and a destabilizing one in C·ATP, such an interpretation is hardly compatible with existing structural information, which suggests a hydrogen bond between sites 1 and 2 in the ATP-bound state (Procko et al., 2006; compare Fig. 1 E), but not in the absence of ATP (Gaudet and Wiley, 2001; compare Fig. 1 D). Further, the vanishing ΔΔGint for the cycle built on Po;max/(1−Po;max) in a nonhydrolytic background (Fig. 5 B) suggests no change in site-1–site-2 interaction between states C·ATP and O·ATP, whereas the positive ΔΔGint for the cycle built on nonhydrolytic closing rates (Fig. 5 D) would have to be interpreted as a destabilization of the site-1–site-2 interaction in the transition state for opening/nonhydrolytic closure (T‡·ATP), relative to the ground states C·ATP and O·ATP—an impossible assumption when combined with the previous set of conclusions! (I.e., to accommodate all the results into Scheme 1, the site-1–site-2 interaction would have to be characterized by four distinct energy levels during various stages of the gating cycle: ΔG(O)<ΔG(C)<ΔG(C·ATP) = ΔG(O·ATP)< ΔG(T‡·ATP).)
Because of the potential involvement of site 1 and site 2 in the induced fit upon ATP binding, we refined Scheme 1 by separating the ATP-binding step C→C·ATP into two kinetically distinct steps: diffusion-limited binding of the nucleotide, followed by the induced fit within the NBD2 domain (Scheme 2).
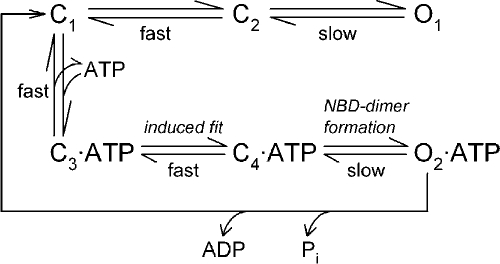 |
(SCHEME 2) |
In Scheme 2, the rate-limiting step for ATP-driven channel opening (C4→O2) is preceded by two fast steps (C1→C3 and C3→C4), whereas spontaneous ATP-independent openings reflect the infrequent occurrence in the absence of ATP of an intra-NBD2 conformational change (C1→C2) analogous to the induced fit, followed by the slow formation of an NBD dimer containing a vacant NBD2 composite site (C2→O1). Although Scheme 2 is a relatively simple generalization of Scheme 1, it provides a surprisingly simple, unifying interpretation of our results for all five mutant cycles between sites 1 and 2 (Figs. 3 D, 4 D, 5, B and D, and 6 D). Two distinguishing features make this possible.
First, in Scheme 2, gating in the absence of ATP reflects the equilibrium between three states (C1, C2, and O1). Therefore, a stabilizing interaction present in C2 (and retained in O1), but not present in C1, would increase Po;bas and result in a negative ΔΔGint for the mutant cycle built on Po;bas/(1−Po;bas), as observed (Figs. 3 D and 4 D). At the same time, this stabilization of the C2 state would also affect the equilibrium distribution between closed states in the presence of subsaturating concentrations of ATP, such that a larger fraction of total closed time would be spent in ATP-free states. As a result, a negative ΔΔGint for the cycle built on KrCO would be expected, again in agreement with our data (Fig. 6 D).
Second, although relative to the very slow opening step (C4→O2) the induced fit upon ATP binding (C3→C4) is assumed to be fast, the reversal of this step (C4→C3) is likely much slower, as ATP binding is a thermodynamically highly favorable process (Pretz et al., 2006). This fact requires reconsideration of how the rate of macroscopic current relaxation, observed in nonhydrolytic mutants upon ATP removal, is interpreted. If rate C4→C3 is not much faster than the opening rate C4→O2, then channels that have just closed will have a non-negligible chance to reopen, and the macroscopic relaxation time constant might become longer than the steady-state mean burst duration. Although for WT CFTR and for the nonhydrolytic mutant D1370N these two parameters are in rough agreement (Csanády et al., 2010), such comparisons have not yet been done for several other NBD2 mutants defective in ATP hydrolysis (e.g., K1250R, K1250A, E1371S, and E1371Q). Interestingly, the macroscopic relaxation rates of the latter mutants scatter over several orders of magnitude (e.g., Bompadre et al., 2005; Vergani et al., 2005; Csanády et al., 2010), a phenomenon that has remained a puzzle. Suppose that, analogously to the situation between C1 and C2, a stabilizing interaction exists in C4 (retained in O2), but not in C3. By slowing rate C4→C3, such an interaction would have the potential to slow, in a nonhydrolytic background, the rate of macroscopic current relaxation upon ATP removal and produce a positive ΔΔGint for the cycle built on nonhydrolytic relaxation rates (compare Fig. 5 D). At the same time, this interaction would not affect the steady-state mean burst durations, and opening rate in saturating ATP would still remain rate limited by step C4→O2, such that the interaction would not affect Po;max (compare Fig. 5, A and B).
A quantitative model consistent with energetic coupling changes between sites 1 and 2
With the help of specific rate constants, Fig. 8 A provides an example illustration of how all of our results in Figs. 1–6 can be quantitatively explained using Scheme 2. It must be emphasized that many of the 11 rates plotted in Fig. 8 A are far from being well-defined by our, or others’, data. In particular, most of the fast rates can be freely altered, without much affecting the predictions of the model, as long as the reverse rate is simultaneously changed to maintain the equilibrium constant. Thus, the values in Fig. 8 A should be considered a suitable example, not a definitively determined set, of rates. Rate O2→C1 (4 s−1) was chosen to yield a closing rate representative of WT CFTR (Csanády et al., 2010), and rate C4→O2 (1 s−1) adjusted to approximately match Po;max values measured in this study (e.g., Fig. 3 B). Rate O1→C2 (6 s−1) reflects the inverse of the mean burst durations we obtained for segments of record in the absence of ATP (168 ± 32 ms; n = 11; compare Fig. 3 A). A left-shifted equilibrium was assumed for step C1–C2 (ΔGC2–C1 = +2.3 kT), and rate C2→O1 was adjusted to reproduce Po;bas = 0.005 for WT CFTR (Fig. 3 C, black). In contrast, we assumed a right-shifted equilibrium for step C3–C4 (ΔGC4–C3 = −4.0 kT), consistent with the exergonic nature of ATP binding (Pretz et al., 2006). Finally, using standard Q-matrix techniques (Colquhoun and Sigworth, 1995), the rates for the C1–C3 equilibrium were chosen to yield a KPo of 59 µM (compare Fig. 6 B, black). Similarly, rate O2→C4 was adjusted to yield, under conditions when rate O2→C1 is set to zero, a relaxation time constant upon sudden removal of saturating ATP (τrelax), which matches that observed for our nonhydrolytic mutant K1250R (Fig. 5 C, black). The Po;max values of ∼0.6 measured for the long-burst nonhydrolytic mutants (Fig. 5 A) suggest that the K1250R mutation, in addition to abrogating ATP hydrolysis, also slows maximal opening rate. We therefore modeled the effect of the K1250R mutation by simultaneously setting rate O2→C1 to zero and rate C4→O2 to 0.2 s−1 (Fig. 8 A, magenta). (In fact, the rate of 1 s−1 for step C4→O2 in WT was chosen to match the relatively high Po;max values [>0.2] we have obtained for all of our constructs using nonstationary noise analysis [e.g., Fig. 3 B]. The maximal opening rates and open probabilities we have previously reported for WT CFTR using single-channel analysis are typically approximately twofold lower [e.g., Csanády et al., 2010].)
Parameters Po;bas and KPo calculated for Scheme 2 using the rates plotted in black in Fig. 8 A, as well as Po;max and τrelax calculated using the two rates adjusted for K1250R (Fig. 8 A, magenta), are in good agreement with the measured values (Fig. 8 B, left column, measured values are shown in parentheses below each calculated parameter).
The model in Fig. 8 A provides an excellent basis for understanding the rearrangement of interactions between sites 1 and 2 during the induced fit within NBD2 caused by the binding of ATP. The lack of phenotype in the single mutants N1303Q and F1296S can be accounted for by assuming stabilizing F–X and N–Y interactions in states C1 and C3 replaced by a stabilizing F–N interaction in states C2 and C4 (retained in O1 and O2) in WT CFTR (illustrated in the cartoon in Fig. 8 A). Both single mutations remove one stabilizing interaction in all six channel states, leaving rate constants unchanged (at a first approximation). In contrast, the double mutation F1296S/N1303Q removes two stabilizing interactions (F–X and N–Y) in states C1 and C3, but only one such interaction (F–N) in states C2, C4, O1, and O2. At a first approximation this effect can be modeled as a right shift in the C1–C2 and C3–C4 equilibria, e.g., by decreasing rates C2→C1 and C4→C3. Indeed, a 160-fold decrease in rate C2→C1 (Fig. 8 A, red) increases Po;bas by 10-fold (Fig. 8 B) to the level we have observed for F1296S/N1303Q (Fig. 3 C). A comparable (∼100-fold) decrease in rate C4→C3 (Fig. 8 A, red) reproduces the approximately fourfold prolonged τrelax (Fig. 8 B) we have observed for F1296S/N1303Q/K1250R (Fig. 5 C). Intriguingly, these changes in the above two rates (C2→C1 and C4→C3) at the same time produce a right shift in the ATP dose dependence of open probability (KPo = 105 µM; Fig. 8 B), which also exactly matches that observed for the double mutant (Fig. 6 B)! Moreover, the reduction in rate C4→C3 has no impact on maximal opening rate, and hence on Po;max, consistent with our observation for the double mutant F1296S/N1303Q (Fig. 3 B). Finally, in a nonhydrolytic background, although τrelax increases to 31 s (Fig. 8 B), the predicted steady-state mean burst duration remains unaffected (7.87 s), resulting in an unchanged Po;max (Fig. 8 B), just as we have observed for F1296S/N1303Q/K1250R (Fig. 5 A). Notably, although in the present study our relatively slow solution exchange (time constant of ∼500 ms) precluded fitting of macroscopic current time courses in response to the addition/removal of ATP for our hydrolytic constructs, Scheme 2 with the rates shown in Fig. 8 is consistent with such time courses reported for WT CFTR in previous studies (e.g., Weinreich et al., 1999; Tsai et al., 2009; Csanády et al., 2010). Such predicted time courses are summarized in Fig. S8 for WT, F1296S/N1303Q, K1250R, and F1296S/N1303Q/K1250R.
Thus, this alteration of only two analogous rates in the double mutant F1296S/N1303Q is sufficient to account for all of our data on site-1–site-2 interactions (Figs. 1–6). Because S–Q (and A–Q) pairings are also quite frequent alternatives of the most typical F–N pairing at these two sites (Fig. 1 A), it is conceivable that the site-1–site-2 interaction postulated for states C2, C4, O1, and O2 in WT can also be formed to some extent in F1296S/N1303Q. Such an S–Q interaction could also contribute to our concluded substantial right shift in the C1–C2 and C3–C4 equilibria, which corresponds to an ∼5-kT stabilization of the C2 and C4 states relative to C1 and C3, respectively.
Interactions between site 2 and site 3
The toggle switch mechanism described above for site-1–site-2 interactions requires alternative interaction partners for each site. In our case, site 3 (R1358) could be such an alternative interaction partner for site 2, as suggested by the TAP1 structures; indeed, in TAP1-ADP a site-2–site-3 interaction replaces the site-1–site-2 interaction seen in TAP1-ATP. However, in the case of CFTR, the functional consequences of the site-3 perturbation (Fig. 7) do not support the above picture, as we could not demonstrate any changes in energetic coupling between sites 2 and 3 either upon channel opening in the absence of ATP (Fig. 7, C and D) or upon ATP binding to closed channels (Fig. 7, F and G). The observed facilitation of spontaneous channel openings by the R1358A mutation (Fig. 7 C) therefore likely reflects loss of a stabilizing interaction in the C1 state between R1358 and a residue other than N1303.
In conclusion, this work suggests a role for the site-1–site-2 pair in the intra-NBD2 induced-fit conformational change elicited by ATP binding, and outlines a strategy for exploring allosteric networks within an ABC protein.
Acknowledgments
We thank David Gadsby, Daniella Muallem, and Attila Gulyás-Kovács for helpful discussions; Beáta Töröcsik for molecular biology support; and Dorottya Mayer for oocyte isolation and injection.
This work was supported by Wellcome Trust grant 081298/Z/06/Z.
Christopher Miller served as editor.
Note added in proof. While this paper was under review, a structure of a fusion protein of CFTR NBD2 fused to the regulatory domain of MalK was deposited into the Protein Databank (accession no. 3GD7). In this structure NBD2 is complexed with N6-phenylethyl-ATP, and two H bonds are observed between sites 1 and 2; this is consistent with our model—one or both of those bonds might be involved in the switch mechanism we propose here.
Footnotes
Abbreviations used in this paper:
- ABC
- ATP-binding cassette
- NBD
- nucleotide-binding domain
- TMD
- transmembrane domain
- WT
- wild type
References
- Aleksandrov L., Aleksandrov A.A., Chang X.B., Riordan J.R. 2002. The first nucleotide binding domain of cystic fibrosis transmembrane conductance regulator is a site of stable nucleotide interaction, whereas the second is a site of rapid turnover. J. Biol. Chem. 277:15419–15425 10.1074/jbc.M111713200 [DOI] [PubMed] [Google Scholar]
- Basso C., Vergani P., Nairn A.C., Gadsby D.C. 2003. Prolonged nonhydrolytic interaction of nucleotide with CFTR’s NH2-terminal nucleotide binding domain and its role in channel gating. J. Gen. Physiol. 122:333–348 10.1085/jgp.200308798 [DOI] [PMC free article] [PubMed] [Google Scholar]
- Berger A.L., Ikuma M., Hunt J.F., Thomas P.J., Welsh M.J. 2002. Mutations that change the position of the putative gamma-phosphate linker in the nucleotide binding domains of CFTR alter channel gating. J. Biol. Chem. 277:2125–2131 [DOI] [PubMed] [Google Scholar]
- Bompadre S.G., Cho J.H., Wang X., Zou X., Sohma Y., Li M., Hwang T.C. 2005. CFTR gating II: effects of nucleotide binding on the stability of open states. J. Gen. Physiol. 125:377–394 10.1085/jgp.200409228 [DOI] [PMC free article] [PubMed] [Google Scholar]
- Cai Z., Scott-Ward T.S., Sheppard D.N. 2003. Voltage-dependent gating of the cystic fibrosis transmembrane conductance regulator Cl− channel. J. Gen. Physiol. 122:605–620 10.1085/jgp.200308921 [DOI] [PMC free article] [PubMed] [Google Scholar]
- Chan K.W., Csanády L., Seto-Young D., Nairn A.C., Gadsby D.C. 2000. Severed molecules functionally define the boundaries of the cystic fibrosis transmembrane conductance regulator’s NH2-terminal nucleotide binding domain. J. Gen. Physiol. 116:163–180 10.1085/jgp.116.2.163 [DOI] [PMC free article] [PubMed] [Google Scholar]
- Chen J., Lu G., Lin J., Davidson A.L., Quiocho F.A. 2003. A tweezers-like motion of the ATP-binding cassette dimer in an ABC transport cycle. Mol. Cell. 12:651–661 10.1016/j.molcel.2003.08.004 [DOI] [PubMed] [Google Scholar]
- Colquhoun D., Sigworth F.J. 1995. Fitting and statistical analysis of single-channel records. Single channel recording. Sakmann B., Neher E., Plenum Press, New York: 483–587 [Google Scholar]
- Csanády L. 2009. Application of rate-equilibrium free energy relationship analysis to nonequilibrium ion channel gating mechanisms. J. Gen. Physiol. 134:129–136 10.1085/jgp.200910268 [DOI] [PMC free article] [PubMed] [Google Scholar]
- Csanády L., Chan K.W., Seto-Young D., Kopsco D.C., Nairn A.C., Gadsby D.C. 2000. Severed channels probe regulation of gating of cystic fibrosis transmembrane conductance regulator by its cytoplasmic domains. J. Gen. Physiol. 116:477–500 10.1085/jgp.116.3.477 [DOI] [PMC free article] [PubMed] [Google Scholar]
- Csanády L., Nairn A.C., Gadsby D.C. 2006. Thermodynamics of CFTR channel gating: a spreading conformational change initiates an irreversible gating cycle. J. Gen. Physiol. 128:523–533 10.1085/jgp.200609558 [DOI] [PMC free article] [PubMed] [Google Scholar]
- Csanády L., Vergani P., Gadsby D.C. 2010. Strict coupling between CFTR’s catalytic cycle and gating of its Cl− ion pore revealed by distributions of open channel burst durations. Proc. Natl. Acad. Sci. USA. 107:1241–1246 10.1073/pnas.0911061107 [DOI] [PMC free article] [PubMed] [Google Scholar]
- Gadsby D.C., Vergani P., Csanády L. 2006. The ABC protein turned chloride channel whose failure causes cystic fibrosis. Nature. 440:477–483 10.1038/nature04712 [DOI] [PMC free article] [PubMed] [Google Scholar]
- Gaudet R., Wiley D.C. 2001. Structure of the ABC ATPase domain of human TAP1, the transporter associated with antigen processing. EMBO J. 20:4964–4972 10.1093/emboj/20.17.4964 [DOI] [PMC free article] [PubMed] [Google Scholar]
- Hallows K.R., Raghuram V., Kemp B.E., Witters L.A., Foskett J.K. 2000. Inhibition of cystic fibrosis transmembrane conductance regulator by novel interaction with the metabolic sensor AMP-activated protein kinase. J. Clin. Invest. 105:1711–1721 10.1172/JCI9622 [DOI] [PMC free article] [PubMed] [Google Scholar]
- Hollenstein K., Dawson R.J., Locher K.P. 2007. Structure and mechanism of ABC transporter proteins. Curr. Opin. Struct. Biol. 17:412–418 10.1016/j.sbi.2007.07.003 [DOI] [PubMed] [Google Scholar]
- Hopfner K.P., Karcher A., Shin D.S., Craig L., Arthur L.M., Carney J.P., Tainer J.A. 2000. Structural biology of Rad50 ATPase: ATP-driven conformational control in DNA double-strand break repair and the ABC-ATPase superfamily. Cell. 101:789–800 10.1016/S0092-8674(00)80890-9 [DOI] [PubMed] [Google Scholar]
- Hung L.W., Wang I.X., Nikaido K., Liu P.Q., Ames G.F., Kim S.H. 1998. Crystal structure of the ATP-binding subunit of an ABC transporter. Nature. 396:703–707 10.1038/25393 [DOI] [PubMed] [Google Scholar]
- Karpowich N., Martsinkevich O., Millen L., Yuan Y.R., Dai P.L., MacVey K., Thomas P.J., Hunt J.F. 2001. Crystal structures of the MJ1267 ATP binding cassette reveal an induced-fit effect at the ATPase active site of an ABC transporter. Structure. 9:571–586 10.1016/S0969-2126(01)00617-7 [DOI] [PubMed] [Google Scholar]
- Kongsuphol P., Cassidy D., Hieke B., Treharne K.J., Schreiber R., Mehta A., Kunzelmann K. 2009. Mechanistic insight into control of CFTR by AMPK. J. Biol. Chem. 284:5645–5653 10.1074/jbc.M806780200 [DOI] [PMC free article] [PubMed] [Google Scholar]
- Lerner-Marmarosh N., Gimi K., Urbatsch I.L., Gros P., Senior A.E. 1999. Large scale purification of detergent-soluble P-glycoprotein from Pichia pastoris cells and characterization of nucleotide binding properties of wild-type, Walker A, and Walker B mutant proteins. J. Biol. Chem. 274:34711–34718 10.1074/jbc.274.49.34711 [DOI] [PubMed] [Google Scholar]
- Lockless S.W., Ranganathan R. 1999. Evolutionarily conserved pathways of energetic connectivity in protein families. Science. 286:295–299 10.1126/science.286.5438.295 [DOI] [PubMed] [Google Scholar]
- Mornon J.P., Lehn P., Callebaut I. 2008. Atomic model of human cystic fibrosis transmembrane conductance regulator: membrane-spanning domains and coupling interfaces. Cell. Mol. Life Sci. 65:2594–2612 10.1007/s00018-008-8249-1 [DOI] [PMC free article] [PubMed] [Google Scholar]
- Payen L., Gao M., Westlake C., Theis A., Cole S.P.C., Deeley R.G. 2005. Functional interactions between nucleotide binding domains and leukotriene C4 binding sites of multidrug resistance protein 1 (ABCC1). Mol. Pharmacol. 67:1944–1953 10.1124/mol.104.007708 [DOI] [PubMed] [Google Scholar]
- Picciotto M.R., Cohn J.A., Bertuzzi G., Greengard P., Nairn A.C. 1992. Phosphorylation of the cystic fibrosis transmembrane conductance regulator. J. Biol. Chem. 267:12742–12752 [PubMed] [Google Scholar]
- Pretz M.G., Albers S.V., Schuurman-Wolters G., Tampé R., Driessen A.J., van der Does C. 2006. Thermodynamics of the ATPase cycle of GlcV, the nucleotide-binding domain of the glucose ABC transporter of sulfolobus solfataricus. Biochemistry. 45:15056–15067 10.1021/bi061230e [DOI] [PubMed] [Google Scholar]
- Procko E., Ferrin-O’Connell I., Ng S.L., Gaudet R. 2006. Distinct structural and functional properties of the ATPase sites in an asymmetric ABC transporter. Mol. Cell. 24:51–62 10.1016/j.molcel.2006.07.034 [DOI] [PubMed] [Google Scholar]
- Ramjeesingh M., Li C., Garami E., Huan L.J., Galley K., Wang Y., Bear C.E. 1999. Walker mutations reveal loose relationship between catalytic and channel-gating activities of purified CFTR (cystic fibrosis transmembrane conductance regulator). Biochemistry. 38:1463–1468 10.1021/bi982243y [DOI] [PubMed] [Google Scholar]
- Riordan J.R., Rommens J.M., Kerem B., Alon N., Rozmahel R., Grzelczak Z., Zielenski J., Lok S., Plavsic N., Chou J.L., et al. 1989. Identification of the cystic fibrosis gene: cloning and characterization of complementary DNA. Science. 245:1066–1073 10.1126/science.2475911 [DOI] [PubMed] [Google Scholar]
- Sakmann B., Neher E. 1995. Single Channel Recording. Second Edition Plenum Press, New York: 700 [Google Scholar]
- Smith P.C., Karpowich N., Millen L., Moody J.E., Rosen J., Thomas P.J., Hunt J.F. 2002. ATP binding to the motor domain from an ABC transporter drives formation of a nucleotide sandwich dimer. Mol. Cell. 10:139–149 10.1016/S1097-2765(02)00576-2 [DOI] [PMC free article] [PubMed] [Google Scholar]
- Tabcharani J.A., Chang X.B., Riordan J.R., Hanrahan J.W. 1991. Phosphorylation-regulated Cl− channel in CHO cells stably expressing the cystic fibrosis gene. Nature. 352:628–631 10.1038/352628a0 [DOI] [PubMed] [Google Scholar]
- Tsai M.F., Shimizu H., Sohma Y., Li M., Hwang T.C. 2009. State-dependent modulation of CFTR gating by pyrophosphate. J. Gen. Physiol. 133:405–419 10.1085/jgp.200810186 [DOI] [PMC free article] [PubMed] [Google Scholar]
- Urbatsch I.L., Gimi K., Wilke-Mounts S., Senior A.E. 2000. Investigation of the role of glutamine-471 and glutamine-1114 in the two catalytic sites of P-glycoprotein. Biochemistry. 39:11921–11927 10.1021/bi001220s [DOI] [PubMed] [Google Scholar]
- Venglarik C.J., Schultz B.D., Frizzell R.A., Bridges R.J. 1994. ATP alters current fluctuations of cystic fibrosis transmembrane conductance regulator: evidence for a three-state activation mechanism. J. Gen. Physiol. 104:123–146 10.1085/jgp.104.1.123 [DOI] [PMC free article] [PubMed] [Google Scholar]
- Vergani P., Nairn A.C., Gadsby D.C. 2003. On the mechanism of MgATP-dependent gating of CFTR Cl− channels. J. Gen. Physiol. 121:17–36 10.1085/jgp.20028673 [DOI] [PMC free article] [PubMed] [Google Scholar]
- Vergani P., Lockless S.W., Nairn A.C., Gadsby D.C. 2005. CFTR channel opening by ATP-driven tight dimerization of its nucleotide-binding domains. Nature. 433:876–880 10.1038/nature03313 [DOI] [PMC free article] [PubMed] [Google Scholar]
- Walker J.E., Saraste M., Runswick M.J., Gay N.J. 1982. Distantly related sequences in the alpha- and beta-subunits of ATP synthase, myosin, kinases and other ATP-requiring enzymes and a common nucleotide binding fold. EMBO J. 1:945–951 [DOI] [PMC free article] [PubMed] [Google Scholar]
- Weinreich F., Riordan J.R., Nagel G. 1999. Dual effects of ADP and adenylylimidodiphosphate on CFTR channel kinetics show binding to two different nucleotide binding sites. J. Gen. Physiol. 114:55–70 10.1085/jgp.114.1.55 [DOI] [PMC free article] [PubMed] [Google Scholar]
- Winter M.C., Sheppard D.N., Carson M.R., Welsh M.J. 1994. Effect of ATP concentration on CFTR Cl− channels: a kinetic analysis of channel regulation. Biophys. J. 66:1398–1403 10.1016/S0006-3495(94)80930-0 [DOI] [PMC free article] [PubMed] [Google Scholar]
- Yuan Y.R., Blecker S., Martsinkevich O., Millen L., Thomas P.J., Hunt J.F. 2001. The crystal structure of the MJ0796 ATP-binding cassette. Implications for the structural consequences of ATP hydrolysis in the active site of an ABC transporter. J. Biol. Chem. 276:32313–32321 10.1074/jbc.M100758200 [DOI] [PubMed] [Google Scholar]
- Zeltwanger S., Wang F., Wang G.T., Gillis K.D., Hwang T.C. 1999. Gating of cystic fibrosis transmembrane conductance regulator chloride channels by adenosine triphosphate hydrolysis. Quantitative analysis of a cyclic gating scheme. J. Gen. Physiol. 113:541–554 10.1085/jgp.113.4.541 [DOI] [PMC free article] [PubMed] [Google Scholar]