

Abstract
During liver fibrogenesis, quiescent hepatic stellate cells switch their phenotype toward a myofibroblastic-like pattern with a gain in motility. Here, we show that SCG10 (superior cervical ganglia 10) mRNA expression, a microtubule-destabilizing protein that favors cell growth and motility in neurons, both increases and correlates with the stage of fibrosis in patients with chronic hepatitis C. We also show the de novo expression of SCG10 mRNA in two rat models of liver fibrosis. We demonstrate that activated hepatic stellate cells appear to be the major cellular sources of SCG10 in the liver. Tracking of the SCG10 pathway in hepatic stellate cells shows that SCG10 initially accumulates in the perinuclear Golgi area then migrates in small vesicle-like structures along individual microtubules. Moreover, SCG10 vesicles cluster at the distal ends of microtubules in areas where tubules are spread and decompacted, suggesting their preferential association with destabilized and dynamic microtubules. Inhibition of SCG10 expression by gene-specific short interfering RNA in primary rat hepatic stellate cells is associated with a significant reduction in microtubule-dependent cellular functions, such as proliferation and migration. In conclusion, the de novo expression of SCG10 by hepatic stellate cells may play a major role in cellular mechanisms associated with HSC activation, namely cell motility and division, through interference with microtubules. SCG10 may represent a potential molecular target for anti-fibrosis therapies.
Hepatic stellate cells (HSCs) are nonparenchymal cells mainly involved in the storage and metabolism of vitamin A in the normal liver.1 Once liver damage and inflammation occur, HSCs undergo a process of activation characterized by a phenotypic switch from quiescent retinoid-storing cells to proliferative fibrogenic myofibroblast-like cells.2–4 The fibrogenic phenotype of HSCs represents a key cellular event in development of liver fibrosis and cirrhosis. Activation of HSCs is characterized by gain of new functions such as motility and cell division (for review see 5). Although many studies have highlighted important molecular events associated with this phenotypic switch, less is known about cellular mechanisms that support these newly gained capacities.
One of the earliest events in HSC activation is extension of cytoplasmic processes which form the substrate of their increased mobility. Cytoskeleton remodeling may play an important role in this process. In eukaryotic cells, the major constituents of the cytoskeleton are actin filaments and microtubules. Microtubules are polymers of tubulin and, in moving cells, these structures are in perpetual change via successive polymerization and depolymerization by adding and removing tubulin subunits at polymer ends.6,7 Microtubules also enable delivery of cargo to and from the cell periphery. Understanding the mechanisms underlying continual rearrangement of the microtubules might contribute to highlighting cellular events driving cytoplasmic reorganization, cell division, and cell motility during HSC activation.
Selective stabilization or destabilization of the microtubule cytoskeleton involves complementary actions of proteins that disassemble and rescue microtubules, respectively. Microtubule stability is augmented by binding of microtubule-associated proteins and is decreased by destabilizing proteins such as SCG10 (superior cervical ganglia 10, STMN2).8 SCG10, a neuronal growth-associated protein, sequesters free tubulin, enabling microtubule dynamics by promoting their destabilization and thus contributing to changes in cell shape and motility.9–11
In previous studies, we had noted that SCG10 was one of the genes whose expression is significantly increased in various pathological conditions associated with liver fibrogenesis.12,13 In the present study, we show that hepatic stellate cells are the cellular source of SCG10, the expression of which is induced de novo during HSC activation. Our results suggest that SCG10 might play a major role in cellular mechanisms associated with HSC activation, namely cell motility and division, likely through its role in controlling microtubule dynamics.
Materials and Methods
Liver Biopsy
Liver biopsies of patients with chronic HCV infection were prospectively collected. After informed consent, the largest fragment was formalin-fixed and paraffin-embedded for routine staining. Liver fibrosis was assessed according to the METAVIR staging system from F0 (no fibrosis) to F4 (cirrhosis) and grading of necroinflammation from A0 (no activity) to A3 (severe activity).14 In addition, a small fragment was snap-frozen in liquid nitrogen and stored at −80°C until use for total RNA extraction and SCG10 mRNA expression quantification.
Rat Model of Liver Fibrosis
SCG10 expression was studied in two models of liver fibrosis, bile duct ligation and chronic CCl4 injection.
Male Sprague–Dawley rats were either bile-duct–ligated (BDL) (n = 5) or sham-operated (n = 5). In brief, under light ether anesthesia, the common bile duct was double-ligated and sectioned between the ligatures. Sham-operated rats were treated in the same manner except that the bile duct was gently manipulated but not ligated or sectioned. All animals were sacrificed 3 weeks after the surgical procedure.
A repeated (twice a week) intraperitoneal injection of CCl4 in olive oil (vol/vol) at a dose of 1 ml/kg body weight (n = 5), or vehicle only (n = 5), was given for 3 weeks. Rats were killed 21 days after the first injection.
Liver fragments were fixed in formalin and embedded in paraffin for routine hematoxylin-eosin staining, while other pieces were snap-frozen for RNA extraction.
This study was performed in accordance with the local regulations and with a protocol approved by the local Committees for Ethical Review of Research.
HSC Isolation and Culture
HSCs were isolated from normal male Sprague–Dawley rats according to previously published protocols.15 Briefly, the liver was dispersed by perfusion with pronase and collagenase. The resulting nonparenchymal cell suspension was filtered through a nylon membrane and washed three times in Gey's balanced salt solution (GBSS) buffer containing Ca2+ (1.6 mmol/L), Mg2+ (1.2 mmol/L), and DNase and then centrifuged through two successive Nycodenz gradients (Sigma, St. Louis, MO), 15 and 10%, respectively. After each gradient, HSCs were recovered from the interface between Nycodenz and medium containing 0.3% BSA, washed in DMEM, and plated on uncoated tissue plastic at a density of 130.103 cells/cm2 in DMEM supplemented with 10% each of calf and horse serum, 2 mmol/L l-glutamine, 10 mmol/L HEPES buffer, 10,000 IU/ml penicillin, and 10 ng/ml streptomycin. Cultures were incubated at 37°C in a humidified atmosphere containing 95% O2, 5% CO2 and the medium was changed every day. Viability was assessed by the trypan blue exclusion test. Purity was more than 95% as assessed by autofluorescence.
Real-Time RT-PCR
Real-time quantitative RT-PCR was performed using the ABI Prism 7700 Sequence Detection System (Perkin-Elmer Applied Biosystems, Foster City, CA). For each sample, data were normalized according to the level of expression of a housekeeping endogenous RNA control gene, namely TBP. Results, expressed as the N-fold differences in target gene expression relative to the TBP gene, and termed Ntarget, were determined as Ntarget = 2ΔCtsample, where the ΔCt value of the sample was determined by subtracting the average Ct value of the target gene from the average Ct value of the TBP gene. The Ntarget values of the samples were subsequently normalized such that the median of the Ntarget values of the human normal liver or quiescent HSC Ntarget values was 1.
Western Blot
One-dimensional electrophoresis was performed on 13% sodium dodecyl sulfate-polyacrylamide gels (1D-PAGE). Proteins were immunoblotted as follows. Proteins were transferred onto 0.2 μm nitrocellulose filters (Schleicher & Schuell, Germany) in a semidry electroblotting apparatus. The membranes were fixed for 10 minutes with 0.25% glutaraldehyde in PBS, stained with Ponceau red, and thereafter saturated with 5% nonfat dry milk in immunoblot solution (12 mmol/L Tris-HCl pH 7.4, 160 mmol/L NaCl, 0.1% Triton X-100). Membranes were probed with polyclonal rabbit SCG10 antisera at 1:1000 dilution. Bound antibodies were detected by chemiluminescence (ECL, Amersham, UK) with the appropriate secondary antibodies, with the membranes exposed to XAR5 film (Kodak, NY).
SCG10 Immunolabeling
Rabbit polyclonal antibody directed against the C-terminal peptide of SCG10 was a gift from A. Sobel.16 Commercial antibodies were monoclonal antibody directed to α-tubulin (Amersham Life Science), polyclonal anti-myc (Chemicon International, Billerica, MA), Alexa 488-congugated anti-rabbit IgG antibody, and Alexa 546-conjugated anti-mouse IgG secondary antibodies (Molecular Probes, Carlsbad, CA).
HSCs were fixed with 4% paraformaldehyde, 30 mmol/L sucrose in PBS for 10 minutes at room temperature. After fixation, coverslips were washed three times in PBS, thereafter permeabilized with 0.1% Triton X-100 in PBS for 5 minutes, quickly washed in PBS, and then blocked for 30 minutes with 3% BSA in PBS. The coverslips were then incubated for 1 hour with relevant antibody at adequate dilution. After five washes with 0.1% Tween-20 in PBS, coverslips were incubated for 1 hour with secondary antibody in blocking buffer. DAPI counterstaining was performed for nuclei visualization. The coverslips were finally washed five times with 0.1% Tween-20 in PBS and mounted.
For double immunofluorescence, cells were incubated for 1 hour with polyclonal anti-SCG10 antibody (1:500) and monoclonal anti–α-tubulin antibody (1:1000) in blocking buffer. After five washes with PBS, cells were incubated with Alexa 488-conjugated anti-rabbit IgG antibody and Alexa 546-conjugated anti-mouse IgG, diluted. Observation of coverslips was performed either with a fluorescence photomicroscope (Olympus, Tokyo, Japan) equipped with a digital camera (Princeton Scientific Instruments, Monmouth Junction, NJ), or with a SP2 confocal microscope (Leica Microsystems, Wetzlar, Germany).
siRNA and SCG10-myc Transfection of HSCs
Four days after plating, HSCs were transfected with 10 nmol/L of target-specific 20 to 25 nt small interfering RNAs (siRNAs) designed to knock down SCG10 (siSCG10#1, siSCG10#2) gene expression or nonsilencing controls (scSCG10#1, scSCG10#2) in siRNA transfection reagent according to the manufacturer's instructions (Applied Biosystem, Courtaboeuf, France). Cells were tested for proliferation and migration 2 days after transfection.
The SCG10-myc fusion protein containing full-length SCG10 was a gift of A Sobel. Transfection was performed in primary HSCs, 2 days after plating and fixed 2 days after transfection.
Bromodeoxyuridine Proliferation Assay
HSCs transfected with siRNA or scRNA at day 4 were tested for proliferation 2 days after transfection.
HSC were incubated in culture medium supplemented with bromodeoxyuridine-labeling medium for 1 hour at 37°C. After three washes, cells were fixed in 70% ethanol for 30 minutes at 20°C. Cells were then incubated with anti-bromodeoxyuridine working solution for 30 minutes at 37°C, followed by incubation with anti-mouse Ig alkaline phosphatase solution for 30 minutes at 37°C. Cells were washed and covered with the color substrate solution for 30 minutes at room temperature. The numbers of bromodeoxyuridine-positive cells were counted in 10 randomly chosen fields at a magnification of ×400. Counting was performed in three independent experiments.
Cell Migration Assay
Migration assays were performed in modified Boyden chambers. A cell culture insert was placed in the well of a 12-well tissue culture plate (Becton Dickinson, Le Pont de Claix, France). The insert had a 10-mm2 uncoated translucent membrane with 8-μm pores at the bottom. HSCs (400,000 cells) obtained two days after transfection with either Si or ScRNA were added to the insert to adhere to the upper surface of the membrane. Cells were serum-starved for 1 hour and then stimulated with 10 ng/ml PDGF-BB. After incubation for 16 hours, culture medium was removed and HSCs adhering to the membrane were fixed with 100% methanol and stained with May-Grünwald Giemsa. The numbers of HSCs on the upper surface and those on the lower surface were counted in five randomly chosen microscopic fields at a magnification of ×400 by changing the focus. The proportion of migrating cells (migration index [MI]) was calculated as follows: MI = [number of cells on the lower surface/number of cells on the upper and lower surfaces] × 100. Experiments were repeated three times.
Results
Overexpression of SCG10 in Human Liver Biopsies and Animal Models of Liver Fibrosis
A total of 79 human liver biopsies displaying different stages of fibrosis were collected (F0, n = 16; F1, n = 21; F2, n = 19; F3, n = 18; and F4, n = 5). SCG10 mRNA expression progressively increased according to the stage of liver fibrosis in the biopsies of HCV-infected patients [median value (ranges) versus F0: F1-F2, 3 fold (1.5–6.5); F3-F4, 5.6 fold (2–12)]. In contrast, mRNA of SCLIP/STMN3 and RB3/STMN4, other members of the stathmin family did not vary significantly according to stage of fibrosis (Figure 1A).
Figure 1.
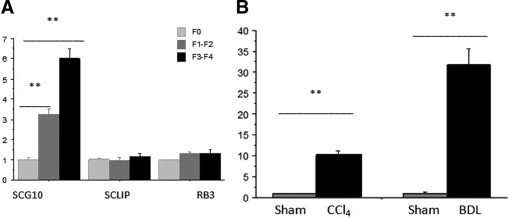
Quantitative SCG10 expression level assessed by real-time PCR. A: In liver biopsies of patients with hepatitis C and different stages of fibrosis according to METAVIR scoring system, SCG10 increases according to the score of fibrosis while SCLIP and RB3, other members of the family, do not change. B: In experimental models of rat liver fibrosis, chronic CCl4 intoxication, and bile duct ligation (BDL), SCG10 expression significantly increases in both models compared with sham-operated animals. Data are normalized to normal liver (A) or sham-operated rats (B). Mann–Whitney U-test, **P < 0.01.
In rats with BDL and chronic CCl4 models of liver fibrosis, SCG10 mRNA was also increased, respectively, 32 fold (20–43) and 10 fold (6–12) versus sham-operated animals (Figure 1B).
Overexpression of SCG10 in HSCs during Activation
Culturing HSC for several days on plastic is a well-established model for in vitro HSC activation. The SCG10 mRNA level was quantified by real-time RT-PCR in lysate of primary HSCs 1 day after isolation (quiescent) and 7 days (activated) after plating.
One day after isolation, HSC showed a lipid-storing phenotype with a round shape, short cytoplasmic expansion with many lipid vacuoles in their cytoplasm. After 7 days in culture, cells switch to a myofibroblastic phenotype with loss of lipid vacuoles and numerous elongated cytoplasmic extensions.
Between day 1 and day 7, a mean 80-fold increase was observed in SCG10 mRNA levels. In parallel, a significant but lower increase was observed for type I alpha1 collagen mRNA expression (mean 12 fold between day 1 and day 7) and connective tissue growth factor (mean 22 fold). Experiments were performed in triplicate and repeated at least 5 times.
A similar increase was observed at the protein level by Western blot. A specific band was strongly expressed in control pheochromocytoma PC12 cell lines but was not observed in quiescent HSCs; it progressively increased at the intermediate stage (day 4 after plating) and in fully activated cells (day 7) (Figure 2). Thus, SCG10 is expressed both at mRNA and protein level in HSCs on activation.
Figure 2.
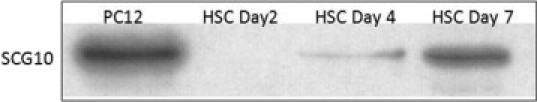
Western blot analysis of SCG10 expression in HSCs on days 1, 4, and 7 after isolation and plating. PC12 were used as control cells.
Immunohistochemistry of SCG10 in HSCs
Tracking Traffic of Exogenous SCG10 in Activated HSCs
To track trafficking of SCG10 within HSC, we transfected a SCG10-myc fusion protein within HSC shortly after isolation and followed SCG10 during HSC activation with an anti-myc fluorescent antibody. Strong immunoreactivity was concentrated mainly at the Golgi compartment during HSC transdifferentiation (day 4 after plating). In addition, small vesicles were already detected within the cytoplasm (Figure 3). These results show that, in HSCs, SCG10 follow a similar cellular pathway that observed in neuronal cells where SCG10 was previously reported.
Figure 3.
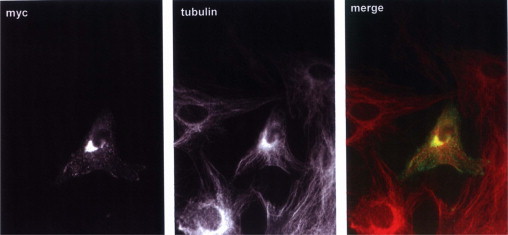
SCG10 trafficking pathway in HSCs. HSCs were transfected with a SCG10-myc fusion protein after 2 days of plating and fixed with paraformaldehyde 48 hours later. Expression of exogenous SCG10 was detected using an anti-myc anti-serum. Microtubules were costained with anti–α-tubulin antibody. Transfected SCG10 concentrate mainly at the Golgi area, with small vesicles along the cytoplasmic processes.
Subcellular Distribution of Endogenous SCG10 in HSCs during Activation
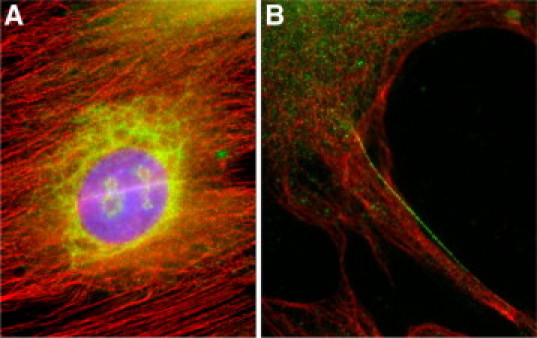
In quiescent HSCs, no cytoplasmic staining was observed except for strong nucleolar staining the significance of which is unknown. After 4 days of culture, immunolabeling demonstrated that SCG10 expression was found in microvesicular structures in the perinuclear region of the Golgi complex (Figure 4A). After full activation, SCG10 accumulated in vesicular structures within the cytoplasm distant from the perinuclear region. Double immunofluorescence with tubulin showed that small SCG10 vesicle-like structures were organized in close contact with individual microtubules. Although the distribution was heterogeneous within the cell, regular organization along the fibers was observed (Figure 4B). Moreover, SCG10 vesicles gathered also toward the distal end of microtubules or in areas where tubules appeared to be spread and decompacted (Figure 5, A and B). This organization suggested a preferential association of SCG10 with dynamic reorganizing microtubules.
Figure 4.
Localization of endogenous SCG10 in HSC. Immunofluorescence microscopy after double labeling for SCG10 (green) and tubulin (red). A: After 4 days in culture, SCG10 is mainly located in the perinuclear network, suggestive of the Golgi area. B: In fully activated cells (7 days in culture), SCG10 labeling appears as small intracytoplasmic vesicle-like structures. Coimmunostaining of microtubules shows that SCG10 was organized in close contact and along individual microtubules.
Figure 5.
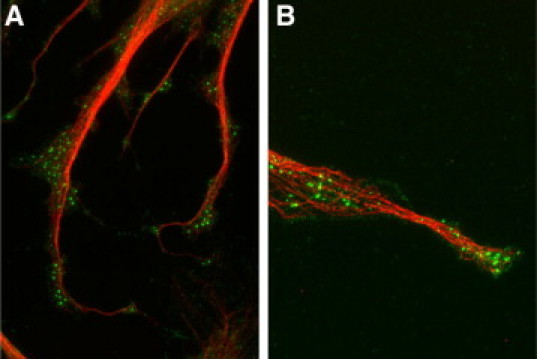
Colocalization of SCG10 and tubulin at the distal end of microtubules in HSC after 7 days in culture. Double immunofluorescence of SCG10 (green) and tubulin (red) in activated HSCs. A: SCG10 vesicles are present along microtubules and accumulate at the end and in areas where microtubules are decompacted. B: Higher magnification showing SCG10 vesicles where microtubules are spread out.
Increased SCG10 Expression Supports Proliferation and Migration of Activated HSCs
SCG10 accumulation along reorganizing microtubules suggests a possible regulatory role in cell motility and division. To determine whether de novo SCG10 expression was of functional relevance during HSC activation, SCG10 was knocked down in HSCs using two independent siRNAs. Transfection of HSCs by SCG10 RNAi induced a significant reduction in SCG10 transcript level, whereas no change was observed for several major genes well known to be overexpressed on HSC activation (CTGF, TGF-Beta1, MMP2, and type 1 collagen) (Figure 6A).
Figure 6.
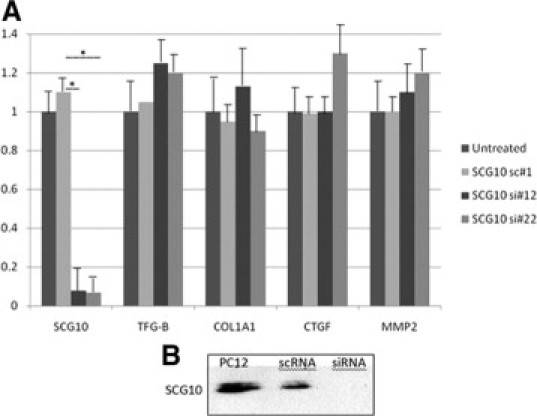
Inhibition of SCG10 expression by gene-specific siRNAs in HSCs. Cells were transfected on day 4 after plating and tested after 2 days. A: Real-time PCR revealed a significant reduction in the SCG10 transcript level by siRNA (si#12, si#22) compared with untreated cells and nonsilencing control (sc#1). No effect was observed on gene expression of TGF-β1, collagen type I α 1, CTGF, or MMP2, *P < 0.001. B: Western blot with anti-SCG10 antibody. Control PC12 cells and hepatic stellate cells transfected with scRNA showed SCG10 expression whether complete disappearance of SCG10 was observed after siRNA transfection or not.
Transfection of HSCs with siSCG10 induced major decrease in protein expression. Whereas a specific SCG10 band was immunolabeled on Western blots of control PC12 cells or scRNA transfected HSCs, no signal was detected in SCG10-siRNA transfected cells (Figure 6B).
The knockdown of SCG10 significantly affected both the proliferative and migratory capacities of HSCs. When SCG10 was inhibited, a decrease of up to 54% in the proliferation rate was observed compared with untreated cells or cells transfected with sc-SCG10 (Figure 7A). No significant effect on cell viability was observed.
Figure 7.
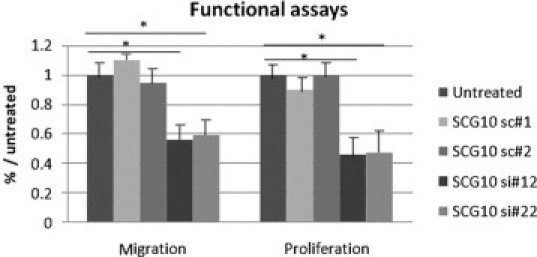
Functional effect of reduced SCG10 expression levels in HSCs. SiRNA-mediated inhibition (si#12, si#22) affects cell migration and cell proliferation compared with untreated cells used as controls or cells transfected with scRNA (sc#1, sc#2), *P < 0.01.
To assess the migratory effect of SCG10, primary HSCs were seeded in the upper compartment of the modified Boyden chamber and allowed to migrate through the filter. To favor HSC migration, PDGF-BB (10 ng/ml) was added to the lower chamber. Migration assays showed a mean 50% decrease in cell migration when HSCs were transfected with SCG10 siRNA, whereas no changes were observed when using cells transfected with scRNA in comparison to unmodified HSCs (Figure 7B).
These experiments, in correlation with the results of immunolabeling studies, demonstrate the functional significance of SCG10 expression in HSCs. These results are highly relevant to the destabilizing effect of SCG10 on microtubules.
Discussion
Pioneering observations of cell division showed that protein polymers in the cell undergo rapid exchange with soluble subunits that can generate forces by subunit addition (polymerization) and loss (depolymerization).17 Subsequent works revealed that microtubules are among these polymers and play central roles in major physiological processes, including cell shape control, cell motility, and chromosome segregation.18–20 Understanding the mechanisms by which these cytoskeletal polymers polymerize and depolymerize is critical for understanding how these cells spatially reorganize in their microenvironment. This topic is particularly relevant in liver physiopathology, because HSC activation is associated with a shift from a quiescent fat-storing cell to a mobile myofibroblast-like cell (activated HSCs) with extensive changes in their cytoskeleton and cell contour that support motility and division.21 We show in the present study that SCG10, a member of the STMN (stathmin-like) family, whose expression was initially thought to be restricted to neuronal cells, is also expressed in fibrotic liver. Here, we demonstrated that activated HSCs are cellular source for its production. Our results also suggest that, similarly to neural cells, SCG10 increase cell mobility of HSCs likely through its role in controlling microtubule polymerization/depolymerization.
Overexpression of SCG10 in Liver Fibrosis and Activated HSCs
We had previously observed that SCG10 gene expression was undetectable in normal liver but significantly increased during liver fibrosis in different chronic liver diseases.12,13 To validate that observation, we quantified, by real-time PCR, SCG10 gene expression in liver tissue of patients with hepatitis C at various stages of fibrosis. Although SCG10 was at the limit of detection in normal liver, it was strongly expressed in liver biopsies of patients with hepatitis C. Interestingly, the expression level increased progressively according to the stage of liver fibrosis, with the highest level in cirrhosis. An increase of SCG10 expression level was also found in two models of liver fibrosis, bile duct ligation and chronic CCl4 intoxication by comparison to sham animals. Finally, our in vitro experiments definitively showed that activated HSCs are involved in SCG10 expression both at the mRNA and protein level.
Although stathmin 1 (STMN1/Op18) is ubiquitously expressed, SCG10 (STMN2), SCLIP (STMN3), and RB3 (STMN4), the other members of the STMN family, have been considered mostly (although not exclusively for SCLIP) as neuron-specific proteins.22,23 In these cells as in PC12, a pheochromocytoma cell line, SCG10 has been identified as a growth-associated protein located preferentially in the growth cones of developing neurons.22 Our study is the first to show that SCG10 is also present in another cell type of nonneuronal origin. This result might be related to previous studies showing that activated HSCs share several phenotypic markers with neural cells, such as GFAP, PrP, NCAM, etc.24–26 Furthermore, It was previously found in PC12 cells that SCG10 mRNA is nerve growth factor (NGF)-inducible.27 NGF acts through the p75 neurotrophin receptor (p75NTR) and tyrosine kinase receptor (TrkA). Interestingly, HSCs express both NGF and NGF low-affinity receptor p75 on activation.28,29 Whether this mechanism is involved in de novo expression of SCG10 during activation of HSC remains to be demonstrated.
In Situ Localization of SCG10 and the Trafficking Pathway in HSCs
Previous studies have shown that cytosolic SCG10 traffic through the Golgi complex into vesicular structures detected within the cell body of neurons.22,30,31 In the present study, we assessed both the trafficking and cellular distribution of SCG10 in HSCs. To detect endogenous SCG10, we used an existing antibody for SCG10 which was highly specific in Western blot and immunofluorescence.16 Then we tracked the trafficking pathway using transfected SCG10-myc in HSCs. Our study reveals several new findings.
First, we showed that SCG10 in HSCs follows the same pathway as in neuron cells, with initial accumulation within the perinuclear area Golgi complex and then export via vesicular secretion along the cytoskeleton. Therefore, SCG10 subcellular targeting appears to involve a ubiquitous mechanism which does not depend on the cell types but on its own structural characteristics. Indeed, SCG10 contains three functional regions: membrane anchoring, regulatory, and coiled-coil regions. In the membrane-anchoring region at the N terminus, SCG10 is anchored by palmitoylation to membranes such as those in the Golgi apparatus and vesicles for membrane targeting.32 In its central region, SCG10 possesses sites of phosphorylation by PKA and MAP kinase. Multiple phosphorylation regulates destabilizing activity and therefore this region is referred to as the regulatory region.33 At the C terminus, SCG10 has a helical structure and can interact with tubulin.34 These characteristics are highly relevant to cellular localization of SCG10 in activated HSCs. Using double immunostaining, SCG10 labeling appeared as small vesicles organized along the microtubules in fully activated HSCs, a distribution pattern highly reminiscent of the cargo function of SCG10 vesicles previously reported in neurons. We also showed accumulation of SCG10 vesicles at the terminal end of microtubules, in areas where microtubules are decompacted. This pattern strongly supports their role in microtubule dynamics, which is a necessary event for cell motility. Indeed, biochemical and structural studies have shown that stathmin proteins each bind two tubulin heterodimers and can induce microtubule disassembly in vitro.9,35 Therefore, it is not surprising to note that SCG10 vesicles accumulate in areas of microtubule decompaction.
Finally, the knockdown of SCG10 in HSCs using siRNA showed that expression of SCG10 in activated HSCs is physiologically relevant. Among the properties gained through transdifferentiation of HSC are motility and proliferation. Inhibition of SCG10 expression in HSC with siRNA strongly decreased cell mobility in a cell migration assay as well as cell proliferation. This effect was not observed with scRNA. These results reinforce the role of SCG10 as a destabilizing microtubule protein that is essential for cell motility and division in eukaryotic cells and specially in HSC. However, although this study shows SCG10 overexpression in human liver biopsies and in animal models of liver fibrosis, the functional relevance has been demonstrated in vitro only and would deserve complementary approaches for assessing its role in vivo.
In conclusion, de novo expression of SCG10 by activated HSCs may play a major role in cellular mechanisms associated with HSC activation, namely cell motility and division, likely through its interference with microtubules dynamics. SCG10 may represent potential molecular targets for anti-fibrosis drug development.
Acknowledgements
We thank André Sobel, Patrick Curmi, and Fabienne Poulain for help and fruitful discussions.
References
- 1.Wake K. “Sternzellen” in the liver: perisinusoidal cells with special reference to storage of vitamin A. Am J Anat. 1971;132:429–462. doi: 10.1002/aja.1001320404. [DOI] [PubMed] [Google Scholar]
- 2.Rockey DC, Boyles JK, Gabbiani G, Friedman SL. Rat hepatic lipocytes express smooth muscle actin upon activation in vivo and in culture. J Submicrosc Cytol Pathol. 1993;24:193–203. [PubMed] [Google Scholar]
- 3.Friedman SL, Roll FJ, Boyles J, Bissell DM. Hepatic lipocytes: the principal collagen-producing cells of normal rat liver. Proc Natl Acad Sci USA. 1985;82:8681–8685. doi: 10.1073/pnas.82.24.8681. [DOI] [PMC free article] [PubMed] [Google Scholar]
- 4.Geerts A, Vrijsen R, Rauterberg J, Burt A, Schellinck P, Wisse E. In vitro differentiation of fat-storing cells parallels marked increase of collagen synthesis and secretion. J Hepatol. 1989;9:59–68. doi: 10.1016/0168-8278(89)90076-7. [DOI] [PubMed] [Google Scholar]
- 6.Kueh HY, Mitchison TJ. Structural plasticity in actin and tubulin polymer dynamics. Science. 2009;325:960–963. doi: 10.1126/science.1168823. [DOI] [PMC free article] [PubMed] [Google Scholar]
- 7.Carvalho P, Tirnauer JS, Pellman D. Surfing on microtubule ends. Trends Cell Biol. 2003;13:229–237. doi: 10.1016/s0962-8924(03)00074-6. [DOI] [PubMed] [Google Scholar]
- 8.Gavet O, Ozon S, Manceau V, Lawler S, Curmi P, Sobel A. The stathmin phosphoprotein family. Intracellular localization and effects on the microtubule network. J Cell Sci. 1998;111:3333–3346. doi: 10.1242/jcs.111.22.3333. [DOI] [PubMed] [Google Scholar]
- 9.Charbaut E, Curmi PA, Ozon S, Lachkar S, Redeker V, Sobel A. Stathmin family proteins display specific molecular and tubulin binding properties. J Biol Chem. 2001;276:16146–16154. doi: 10.1074/jbc.M010637200. [DOI] [PubMed] [Google Scholar]
- 10.Poulain FE, Sobel A. The “SCG10-LIke Protein” SCLIP is a novel regulator of axonal branching in hippocampal neurons, unlike SCG10. Mol Cell Neurosci. 2007;34:137–146. doi: 10.1016/j.mcn.2006.10.012. [DOI] [PubMed] [Google Scholar]
- 11.Jourdain L, Curmi P, Sobel A, Pantaloni D, Carlier MF. Stathmin: a tubulin-sequestering protein which forms a ternary T2S complex with two tubulin molecules. Biochemistry. 1997;36:10817–10821. doi: 10.1021/bi971491b. [DOI] [PubMed] [Google Scholar]
- 12.Asselah T, Bieche I, Laurendeau I, Martinot-Peignoux M, Paradis V, Vidaud D, Valla DC, Bedossa P, Marcellin P, Vidaud M. Liver gene expression signature of mild fibrosis in patients with chronic hepatitis C. Gastroenterology. 2005;129:2064–2075. doi: 10.1053/j.gastro.2005.09.010. [DOI] [PubMed] [Google Scholar]
- 13.Paradis V, Bieche I, Dargere D, Cazals-Hatem D, Laurendeau I, Saada V, Belghiti J, Bezeaud A, Vidaud M, Bedossa P, Valla DC. Quantitative gene expression in Budd-Chiari syndrome: a molecular approach to the pathogenesis of the disease. Gut. 2005;54:1776–1781. doi: 10.1136/gut.2005.065144. [DOI] [PMC free article] [PubMed] [Google Scholar]
- 14.P. Bedossa and the METAVIR cooperative study group an algorithm for the grading of activity in chronic hepatitis. Hepatology. 1996;24:289–293. doi: 10.1002/hep.510240201. [DOI] [PubMed] [Google Scholar]
- 15.Friedman SL, Roll FJ. Isolation and culture of hepatic lipocytes. Kupffer cells, sinusoidal endothelial cells by density gradient centrifugation with Stractan. Anal Biochem. 1987;61:207–218. doi: 10.1016/0003-2697(87)90673-7. [DOI] [PubMed] [Google Scholar]
- 16.Ozon S, Maucuer A, Sobel A. The stathmin family: molecular and biological characterization of novel mammalian proteins expressed in the nervous system. Eur J Biochem. 1997;248:794–806. doi: 10.1111/j.1432-1033.1997.t01-2-00794.x. [DOI] [PubMed] [Google Scholar]
- 17.Inoué S, Sato H. Cell motility by labile association of molecules. The nature of mitotic spindle fibers and their role in chromosome movement. J Gen Physiol. 1967;50:259–292. [PMC free article] [PubMed] [Google Scholar]
- 18.Arnal I, Karsenti E, Hyman AA. Structural transitions at microtubule ends correlate with their dynamic properties in Xenopus egg extracts. J Cell Biol. 2000;149:767–774. doi: 10.1083/jcb.149.4.767. [DOI] [PMC free article] [PubMed] [Google Scholar]
- 19.Belmont LD, Mitchison TJ. Identification of a protein that interacts with tubulin dimers and increases the catastrophe rate of microtubules. Cell. 1996;84:623–631. doi: 10.1016/s0092-8674(00)81037-5. [DOI] [PubMed] [Google Scholar]
- 20.Dye NA, Shapiro L. The push and pull of the bacterial cytoskeleton. Trends Cell Biol. 2007;17:239–245. doi: 10.1016/j.tcb.2007.03.005. [DOI] [PubMed] [Google Scholar]
- 21.Chang KT, Tsai MJ, Cheng YT, Chen JJ, Hsia RH, Lo YS, Ma YR, Weng CF. Comparative atomic force and scanning electron microscopy: an investigation of structural differentiation of hepatic stellate cells. J Struct Biol. 2009;167:200–208. doi: 10.1016/j.jsb.2009.06.005. [DOI] [PubMed] [Google Scholar]
- 22.Stein R, Mori N, Matthews K, Lo LC, Anderson DJ. The NGF-inducible SCG10 mRNA encodes a novel membrane-bound protein present in growth cones and abundant in developing neurons. Neuron. 1988;1:463–476. doi: 10.1016/0896-6273(88)90177-8. [DOI] [PubMed] [Google Scholar]
- 23.Bièche I, Maucuer A, Laurendeau I, Lachkar S, Spano AJ, Frankfurter A, Lévy P, Manceau V, Sobel A, Vidaud M, Curmi PA. Expression of stathmin family genes in human tissues: non-neural-restricted expression for SCLIP. Genomics. 2003;81:400–410. doi: 10.1016/s0888-7543(03)00031-4. [DOI] [PubMed] [Google Scholar]
- 24.Geerts A. History, heterogeneity, developmental biology, functions of quiescent hepatic stellate cells. Semin Liver Dis. 2001;21:311–335. doi: 10.1055/s-2001-17550. [DOI] [PubMed] [Google Scholar]
- 25.Ikeda K, Kawada N, Wang YQ, Wang YQ, Kadoya H, Nakatani K, Sato M, Kaneda K. Expression of cellular prion protein in activated hepatic stellate cells. Am J Pathol. 1998;153:1695–1700. doi: 10.1016/S0002-9440(10)65683-0. [DOI] [PMC free article] [PubMed] [Google Scholar]
- 26.Knittel T, Aurisch S, Neubauer K, Eichhorst S, Ramadori G. Cell-type-specific expression of neural cell adhesion molecule (N-CAM) in Ito cells of rat liver. Up-regulation during in vitro activation and in hepatic tissue repair. Am J Pathol. 1996;149:449–462. [PMC free article] [PubMed] [Google Scholar]
- 27.Stein R, Orit S, Anderson DJ. The induction of a neural-specific gene. SCG10, by nerve growth factor in PC12 cells is transcriptional, protein synthesis dependent, and glucocorticoid inhibitable. Dev Biol. 1988;127:316–325. doi: 10.1016/0012-1606(88)90318-1. [DOI] [PubMed] [Google Scholar]
- 28.Kendall TJ, Hennedige S, Aucott RL, Aucott RL, Hartland SN, Vernon MA, Benyon RC, Iredale JP. p75 Neurotrophin receptor signaling regulates hepatic myofibroblast proliferation and apoptosis in recovery from rodent liver fibrosis. Hepatology. 2009;49:901–910. doi: 10.1002/hep.22701. [DOI] [PubMed] [Google Scholar]
- 29.Passino MA, Adams RA, Sikorski SL, Akassoglou K. Regulation of hepatic stellate cell differentiation by the neurotrophin receptor p75NTR. Science. 2007;315:1853–1856. doi: 10.1126/science.1137603. [DOI] [PubMed] [Google Scholar]
- 30.Di Paolo G, Lutjens R, Pellier V, Stimpson SA, Beuchat MH, Catsicas S, Grenningloh G. Targeting of SCG10 to the area of the golgi complex is mediated by its NH2-terminal region. J Biol Chem. 1997;272:5175–5182. doi: 10.1074/jbc.272.8.5175. [DOI] [PubMed] [Google Scholar]
- 31.Sobel A, Boutterin MC, Beretta L, Chneiweiss H, Doye V, Peyro-Saint-Paul H. Intracellular substrates for extracellular signaling. Characterization of a ubiquitous, neuron-enriched phosphoprotein (stathmin) J Biol Chem. 1989;264:3765–3772. [PubMed] [Google Scholar]
- 32.Chauvin S, Poulain FE, Ozon S, Sobel A. Palmitoylation of stathmin family proteins domain A controls Golgi versus mitochondrial subcellular targeting. Biol Cell. 2008;100:577–589. doi: 10.1042/BC20070119. [DOI] [PubMed] [Google Scholar]
- 33.Antonsson B, Kassel DB, Di Paolo G, Lutjens R, Riederer BM, Grenningloh G. Identification of in vitro phosphorylation sites in the growth cone protein SCG10. Effect of phosphorylation site mutants on microtubule-destabilizing activity. J Biol Chem. 1998;273:8439–8446. doi: 10.1074/jbc.273.14.8439. [DOI] [PubMed] [Google Scholar]
- 34.Li YH, Ghavampur S, Bondallaz P, Will L, Grenningloh G, Püschel AW. Rnd1 regulates axon extension by enhancing the microtubule destabilizing activity of SCG10. J Biol Chem. 2009;284:363–371. doi: 10.1074/jbc.A808126200. [DOI] [PMC free article] [PubMed] [Google Scholar]
- 35.Ravelli RB, Gigant B, Curmi PA, Jourdain I, Lachkar S, Sobel A, Knossow M. Insight into tubulin regulation from a complex with colchicine and a stathmin-like domain. Nature. 2004;428:198–202. doi: 10.1038/nature02393. [DOI] [PubMed] [Google Scholar]
Uncited reference
- 5.Friedman SL. Hepatic stellate cells: protean. multifunctional, and enigmatic cells of the liver. Physiol Rev. 2008;88:125–172. doi: 10.1152/physrev.00013.2007. [DOI] [PMC free article] [PubMed] [Google Scholar]