

Abstract
Adiponectin is a hormone that lowers glucose production by increasing liver insulin sensitivity. Insulin blocks the generation of biochemical intermediates for glucose production by inhibiting autophagy. However, autophagy is stimulated by an essential mediator of adiponectin action, AMPK. This deadlock led to our hypothesis that adiponectin inhibits autophagy through a novel mediator. Mass spectrometry revealed a novel protein that we call suppressor of glucose by autophagy (SOGA) in adiponectin-treated hepatoma cells. Adiponectin increased SOGA in hepatocytes, and siRNA knockdown of SOGA blocked adiponectin inhibition of glucose production. Furthermore, knockdown of SOGA increased late autophagosome and lysosome staining and the secretion of valine, an amino acid that cannot be synthesized or metabolized by liver cells, suggesting that SOGA inhibits autophagy. SOGA decreased in response to AICAR, an activator of AMPK, and LY294002, an inhibitor of the insulin signaling intermediate, PI3K. AICAR reduction of SOGA was blocked by adiponectin; however, adiponectin did not increase SOGA during PI3K inhibition, suggesting that adiponectin increases SOGA through the insulin signaling pathway. SOGA contains an internal signal peptide that enables the secretion of a circulating fragment of SOGA, providing a surrogate marker for intracellular SOGA levels. Circulating SOGA increased in parallel with adiponectin and insulin activity in both humans and mice. These results suggest that adiponectin-mediated increases in SOGA contribute to the inhibition of glucose production.
Adipose tissue exerts a powerful effect on glucose metabolism by regulating the concentration of circulating adiponectin.1 High adiponectin in the lean state is linked to elevated insulin sensitivity, whereas low adiponectin in the obese state is linked to insulin resistance and type II diabetes.2–5 Endogenous glucose production is elevated in both type I and type II diabetes.6 Studies in mice and liver cells show that adiponectin lowers glucose production by increasing the insulin sensitivity of the liver.7–9
The adiponectin signaling pathway is currently linked to i) adiponectin receptors that bind to full-length adiponectin or the carboxy-terminal ‘globular’ fragment of adiponectin, ii) the intracellular domains of adiponectin receptors 1 and 2 binding to the adaptor APPL1, and iii) the activation of AMPK, a signaling intermediate that reduces the gene expression of rate-limiting enzymes for glucose production.8–20 However, the inhibition of glucose production by this pathway is not completely clear.
Glucose production depends on autophagy, a regulated mechanism of intracellular degradation that is inhibited by insulin. The reduction of insulin during fasting, starvation, and type I diabetes increases autophagy in the liver. 21–23 Autophagy provides the biochemical intermediates for glucose production through the hydrolysis of proteins, glycogen, and triglycerides.24–26 Insulin inhibition of autophagy in isolated hepatocytes is linked to the activation of mTOR.27,28 Hence, we were perplexed by reports that AMPK, an essential mediator of adiponectin action, inhibits mTOR and stimulates autophagy.29–35
Mass spectrometry analysis of adiponectin-treated hepatoma cells revealed a protein that we call suppressor of glucose by autophagy (SOGA). Our initial interest in SOGA was based on conserved domains, which predicted that SOGA could participate in the regulation of autophagy.36 The results presented here indicate that the regulation and function of SOGA can explain how adiponectin enhances insulin inhibition of autophagy while activating AMPK.
Materials and Methods
Mass Spectrometry
McArdle rat hepatoma cells were exposed to adipocyte conditioned media with or without adiponectin.16 Cell lysates were digested with proteomics grade trypsin (Sigma, St. Louis, MO) and filtered through YM-10 molecular weight cutoff filters (Millipore, Bedford, MA). Tryptic digests were injected into an LCQ-Deca Ion Trap mass spectrometer coupled to a Surveyor HPLC system (Thermo Fisher Scientific, Waltham, MA). The solvent, 50% methanol and 0.1% formic acid, was delivered to the spectrometer at 200 μl/min. Peptide masses were acquired in positive mode using electrospray ionization under the following source conditions: spray voltage was 5 kV, sheath gas was 40 (arbitrary units), auxiliary gas was 20 (arbitrary units), and heated capillary temperature was 350 C.
Cloning of Murine SOGA
Total RNA was obtained from primary mouse hepatocytes using Triazol reagent (Invitrogen, Carlsbad, CA). mRNA was isolated using Oligotex mRNA Kit (Qiagen, Valencia, CA). Primers used to clone SOGA were designed using publicly available genomic and mRNA sequence data based on the open reading frame of SOGA peptides we detected by mass spectrometry. The 4.7-kb SOGA cDNA was isolated by annealing two PCR products using overlap extension. RNA ligase mediated RACE (Ambion, Austin, TX) was used to clone the 5′ SOGA mRNA sequence.
Antibody Production
Human- and murine-specific polyclonal antisera were produced in three New Zealand White rabbits (Franklin Rabbitry, NC) using a human-specific peptide antigen STQSLTSC*FARSSRSAIRHSPSKC and two partially overlapping murine-specific peptide antigens CSAQSLASCFIRPSRN and SAQSLASC*FIRPSRNPIRHSPSKC, where C* represents acemidomethyl cysteine. Synthetic peptides were purified by HPLC and analyzed on the LCQ-Deca Ion Trap mass spectrometer to confirm their molecular weight. Antigenic peptides (10 mg) were dissolved in 0.1 mol/L NaH2PO4 (pH 7.2)/0.05 mol/L NaCl and conjugated to keyhole limpet hemocyanin (KLH; 4 mg) before injection. KLH-conjugated peptides were dissolved in 3 ml of 0.03% trifluoroacetic acid and added to 3 ml complete Freund's adjuvant (Sigma). New Zealand White rabbits were injected intradermally using multiple injection sites. After 5 weeks, each animal was reinjected subcutaneously with KLH-conjugated antigen in 1 ml of 50% incomplete Freund's adjuvant (Sigma). Four weeks later, 20 ml blood were collected and rabbits were reimmunized. Injections and bleedings were performed at monthly intervals thereafter. The antibody production protocol was approved by UNC's Institutional Animal Care and Use Committee (IACUC). Rabbit antisera recognizing human and murine SOGA are available through Millipore (catalogue numbers ABS81 and ABS91).
Hepatocyte Studies
Mouse livers were perfused with a Krebs-Ringer-HEPES buffer containing collagenase IV (Sigma-Aldrich). Livers were isolated and cells were dispersed by gentle shaking and filtered through sterile 100 μm nylon gauze. Cells were washed twice with sterile phosphate-buffered saline and purified by centrifugation in 50% isotonic Percoll (Sigma-Aldrich). Cells were resuspended with Krebs-Ringer-HEPES + Ca2+ buffer to a total volume of 10 ml. Viability was validated via trypan blue exclusion and routinely exceeded 90%. Freshly isolated mouse hepatocytes were plated at 105 cells per well in 12-well culture plates coated with rat tail collagen I (BD Biosciences). Cells were maintained in William E culture medium (Invitrogen), 25 mmol/L glucose and 10% horse serum (HS). Adiponectin was provided from adipocyte-conditioned media as previously described.16 SOGA siRNA, AICAR (500 μmol/L), or LY293004 (10 nmol/L) were introduced to the media 48 hours before the measurement of glucose production. siRNA sequences corresponding to bp 157–175 and 1812–1831 on the open reading frame of murine SOGA were selected using a rational design algorithm (Invitrogen). Transfection with a pool of 2 siRNAs targeting SOGA had a greater knockdown efficiency than transfecting with the individual siRNAs. Transfection was achieved by electroporation using the Mouse Hepatocyte Nucleofector Kit (LONZA) according to the manufacturer's protocol. In brief, freshly isolated mouse hepatocytes were diluted to 3 × 10⁶ cells per tube in media without antibiotics and centrifuged at 2000 rpm for 2 minutes. The supernatant was removed and the cells were resuspended in 100 μl of nucleofector solution containing 100 nmol/L of siRNA. The cell suspension was transferred to an electroporation cuvette, which was placed in a Nucleofector I electroporation device and pulse charge was applied for 2 minutes using program T-28. Hepatocytes received 1.0 ml of media and were transferred to 12-well plates. SOGA expression and production of valine and glucose were assayed 48 hours after siRNA transfection. Media was replaced with glucose-free DMEM containing MG-132 (10 μmol/L), an inhibitor of the ubiquitin–proteasome pathway of protein degradation, for 6–8 hours to measure hepatocytes glucose production. Glucose was measured by colorimetric assay (Autokit Glucose CII). Valine in the medium was measured by a UPLC (Waters) coupled TSQ-Quantum ultra triple quad mass analyzer (ThermoFinigan) in the Biomarkers Facility Core at UNC. Valine was measured in selected reaction monitoring mode (SRM) using the MS/MS transition of 118→72.
Late Autophagosome and Lysosome Activity
Autophagic activity was estimated by late autophagosome and lysosome vacuole staining using Lyso Tracker Red DND 99 (Invitrogen), a membrane permeable fluorescent labeled basic amine with high affinity for the acidic interior of late autophagosome and lysosome vacuoles.37 Cell medium was removed and replaced with GF/DMEM containing 50 nmol/L LysoTracker Red. Cells were incubated for 30 minutes at 37°C, and the medium was replaced with GF/DMEM. Digital images were obtained at the Microscopy Services Laboratory of UNC with an Olympus IX81 Motorized Inverted Microscope, a ×40/1.30 Oil DIC lens, Camera pixel count: Hamamatsu C10600–10B 1344 × 1024 using the acquisition software Volocity 5.3.2 (Perkin-Elmer). Fluorescence Filter Cubes Specifications (Semrock, Inc.) were TXRED-4040B for rhodamine and Texas Red: Exciter 562 nm ± 20, Dichroic R 530–585/T 601–800, Emitter 642 ± 20. Lysosome and late autophagosome vacuole number was determined from digital images as isolated punctuate staining, greater than background staining intensity threshold, distinct from lipid droplets in clearly demarcated cells containing 2 nuclei. Spot recognition and enumeration according to the foregoing definition was determined by two individuals.
Mouse Studies
Mice were housed in ventilated isolator cage systems in a pathogen-free barrier facility maintained at 23°C, 55% humidity on a 12-hour light/12-hour dark cycle. Mice received a standard chow diet consisting of 73% carbohydrate, 18% protein, 4% fat, and 5% ash (Purina). Young (3–6 months old) female C57Bl/6J calorie-restricted (CR) and ad libitum–fed (AL) mice were maintained as previously described.38 Adjustments were made to ensure that CR mice received 70% of the ad libitum food intake. Blood samples were collected at 1:00 PM from the tail tip using heparinized capillary tubes (Fisher) and stored at –20°C. Male ob/ob mice (6–9 months old; FVB background strain) received a daily dose of pioglitazone at 6 mg/kg BW in 0.025% (wt/wt) carboxymethylcellulose by oral gavage for 4 days. Control mice received carboxymethylcellulose by oral gavage for 4 days. Blood was collected from the tail tip on day 5 and analyzed for glucose, adiponectin, and 25-kDa SOGA. Immediately after the collection of blood samples, ob/ob mice were sacrificed for tissue collection by cervical dislocation. Northern blot analysis for SOGA mRNA and 18S RNA was performed using 20 μg of liver RNA. NOD mice were bred and housed as previously described.39 Where indicated, diabetic NOD mice were injected with 5 units of insulin (NPH Human Insulin, Isophane Suspension; 100 U/ml Novolin; Novo Nordisk) 24 hours before blood collection. High fat fed adiponectin transgenic mice were produced as previously described.9 Glucose was measured by colorimetric assay. Adiponectin and SOGA were measured by SDS-PAGE analysis using 1 μl plasma. The total concentration of protein in plasma, measured by BCA assay (Pierce), did not differ between groups. Experimental procedures were approved by IACUC.
Human Studies
Thirteen healthy women between the ages of 20–63 years and body mass indexes between 20.2 and 31.9 kg/m2 were included for this study. Inclusion was contingent on a good age-typical health status, as ascertained by physical examination and standard clinical laboratory tests such as complete blood count, blood chemistries, fasting glucose, insulin, lipid and liver function tests, liver lipid content, and the presence of no known chronic disease including diabetes. Subjects were admitted to the Clinical and Translational Research Center of UNC and placed on a balanced weight maintenance diet for 10 days.40 Circulating SOGA and adiponectin were measured from plasma samples collected from an intravenous catheter after an overnight fast. The race–ethnicity distribution of the participants was white (8), African American (3), Asian (1), and Native American (1), which reflected the local population characteristics of the Raleigh-Durham-Chapel Hill area. Plasma adiponectin and SOGA were determined by SDS-PAGE using polyclonal antisera against human adiponectin and human SOGA, horseradish peroxidase–linked secondary anti-rabbit IgG. Circulating adiponectin and SOGA levels were measured by enhanced chemiluminescence (ECL) signal intensity. Human studies were performed under an IRB approved protocol (CTRC-2645; Study: 07-1158).
Statistical Analysis
Student's t-test was used to identify significant differences when data within groups showed a normal distribution and Wilcoxon-Rank Sum test was used when data did not show a normal distribution. P values less than 0.05 were considered significant.
Results
Identification of SOGA by Mass Spectrometry
Protein extracts from adiponectin-treated hepatoma cells were digested with trypsin and analyzed by mass spectrometry. Mass spectrometry revealed a peptide, KVLPSEEDDFLEVNSM, encoded by a gene located on chromosome 2 in mice (2qH1) and chromosome 20 in humans (20q11). Mouse liver RNA was used to clone the full-length 4.7-kb SOGA cDNA. The GENBANK accession numbers for murine and human SOGA mRNA sequences are FJ977045 and BK007092, respectively. The GENBANK accession numbers for the murine and human SOGA gene sequences are BK007094 and BK007093, respectively. Northern blot analysis, using a probe recognizing the C-terminal end of SOGA, revealed a single dominant 4–5 kb band in the liver. The open reading frame (ORF) for SOGA mRNA predicts the production of a 161-kDa protein that contains an internal peptide sequence, FKHNFLLLFMKLRWFLKRWRQG (Figure 1, A and B). On the basis of computational algorithms that incorporate signal peptide and cleavage site predictions, SOGA is cleaved between G at the carboxy-terminal end of the signal peptide and K at the beginning of the tryptic peptide we identified by mass spectrometry.41
Figure 1.
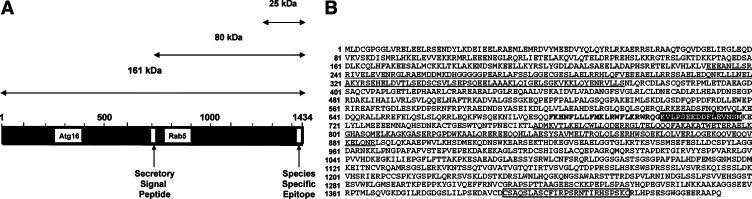
Predicted functional domains of SOGA. A: SOGA map showing the location of conserved ATG16 and Rab5-binding motifs, the signal peptide, and the species-specific epitope in the predicted 161-kDa SOGA. The map also shows the predicted domains of the 80-kDa peptide detected in liver, hepatocytes, and hepatocyte-conditioned media and the 25–kDa peptide detected in plasma. B: The amino acid sequence for murine SOGA showing the location of the Atg16 (232–375) and Rab5-binding (757–886) motifs underlined, the signal peptide (593–614) in bold, the tryptic peptide identified by mass spectrometry (703–718) shaded, and the species specific domain (1392–1416) in a box. The position of the internal signal peptide explains why our antibodies, recognizing the species-specific epitope near the C terminus of SOGA, detect an 80-kDa SOGA peptide rather than the 161-kDa SOGA protein.
Function of SOGA in Primary Hepatocytes
Consistent with the predicted position of the cleavage site, rabbit antisera recognizing the species-specific domain on the C-terminal region of murine SOGA recognized a single 80-kDa protein in isolated hepatocytes (Figure 2A). siRNA suppression of SOGA caused a dramatic increase in the number of late autophagosome and lysosome vacuoles per cell (2.0 ± 0.2 per cell compared with 17.5 ± 2.0 per cell; n = 25–30 cells per group; P < 0.0001). Figure 2B shows late autophagosome and lysosome vacuoles by isolated punctate acidophylic fluorescent dye staining, which provides correlative data on autophagy (Figure 2B).37 The hypothesis that SOGA inhibits autophagy is supported by the reduction of total cell protein content 48 hours after siRNA suppression of SOGA (11.2 ± 0.6 μg/well compared with 16.3 ± 0.4 μg/well; n = 4 per group; P < 0.05). Adiponectin exposure caused a 36% increase of SOGA in primary hepatocytes and a 50% reduction in glucose production (Figure 2C). siRNA suppression of SOGA also blocked the inhibition of glucose production and stimulated valine secretion (Figure 2C). The secretion of valine, an essential amino acid that cannot be metabolized, due the absence of branched chain aminotransferase in hepatocytes, also suggests an increase in autophagy. These results support the hypothesis that the elevation of SOGA in response to adiponectin exposure is linked to the inhibition of autophagy.
Figure 2.
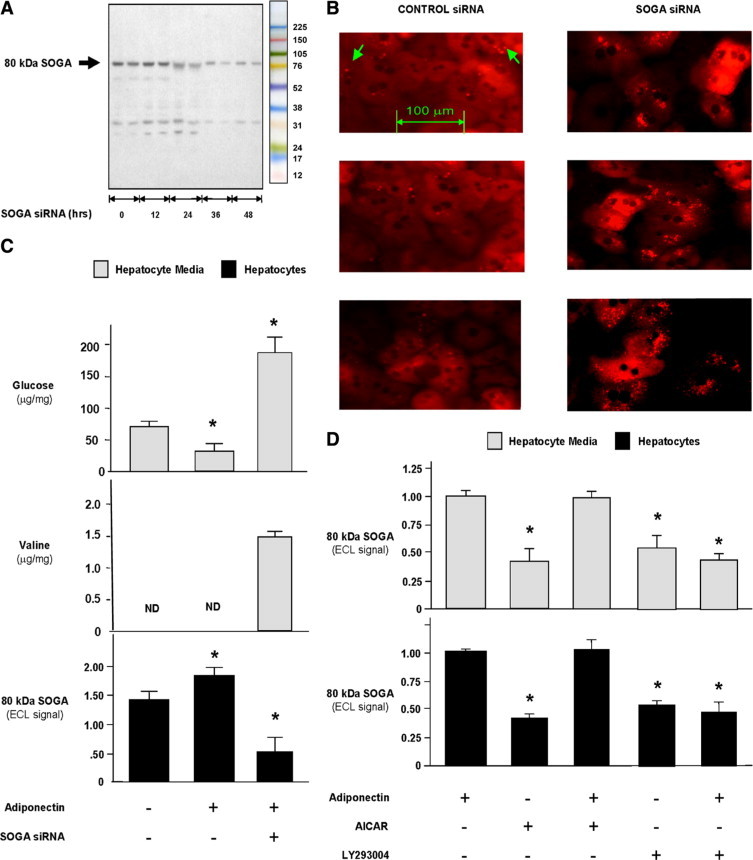
Function and regulation of SOGA in primary hepatocytes. A: Representative SDS-PAGE of primary murine hepatocyte samples showing the knockdown of 80-kDa SOGA as a function of time after exposure to siRNA. B: Representative purified binucleate hepatocyte cultures transfected with control (left) or SOGA siRNA (right) stained with the late autophagosome and lysosome-specific fluorescent dye LysoTracker Red. Control siRNA-transfected cultures exhibited an average of two isolated punctate stained vacuoles per hepatocyte (indicated by green arrows), whereas SOGA siRNA-transfected cultures showed an average of 18 stained vacuoles per hepatocyte. C: Bar graphs showing the effects of adiponectin and SOGA siRNA on glucose and valine in hepatocyte conditioned media (top and middle) and 80-kDa SOGA in hepatocytes (bottom). Densitometry was used to determine the ECL (enhanced chemiluminescent) signal after SDS-PAGE. D: Bar graphs showing the roles of AMPK and PI3K on adiponectin regulation of intracellular and extracellular SOGA levels. Primary hepatocytes were incubated in the presence or absence of the 500 μmol/L AICAR, a stimulator of AMPK, or 10 nmol/L LY294002, a PI3K inhibitor. Bars represent mean values ± SEM for n = 4 per group where there is a significant a difference compared with control (left bar) at *P < 0.05 by nonparametric Student's t-test. Gray and black bars indicate whether measurements were made in hepatocyte conditioned media or hepatocytes, respectively. ND indicates not detected.
Regulation of SOGA in Primary Hepatocytes and the Correlation between Intracellular and Extracellular Levels of SOGA
AICAR activation of AMPK caused a decrease in SOGA that was blocked by adiponectin exposure (Figure 2D). On the other hand, the inhibition of PI3K by LY294002 caused a decrease in SOGA that was not blocked by adiponectin (Figure 2D). These observations suggest that adiponectin increases SOGA through the insulin signaling pathway. Consistent with the identification of an internal signal peptide in SOGA, SDS-PAGE analysis revealed that the 80-kDa SOGA fragment is secreted in hepatocyte conditioned media. The reduction of intracellular SOGA by AICAR and LY294002 was reflected in the levels of SOGA in hepatocyte-conditioned media (Figure 2D). These results suggest that extracellular levels of SOGA could be used as a biomarker of its intracellular activity.
Circulating SOGA in Mice and Humans
Antisera from two different rabbits immunized with two different peptide antigens, 476 and 477, detected a 25-kDa peptide in mouse plasma (see Supplemental Figure 1A at http://ajp.amjpathol.org). Rabbit antisera recognizing murine SOGA did not cross-react with any proteins in human plasma (see Supplemental Figure 1A at http://ajp.amjpathol.org). Antibody detection of 25-kDa SOGA required the reduction of the sample with dithiothreitol due, presumably, to cysteine residues within the species-specific antigenic epitope of SOGA. Based on the predicted sequence of 25-kDa SOGA, the intramolecular disulfide bonds between cysteine residues on the carboxy-terminal end of SOGA should generate a fish hook conformation. Two observations indicate that 25-kDa SOGA circulates as a monomer. First, SOGA was detected at 25 kDa when plasma samples were reduced after SDS-PAGE. Second, by size exclusion chromatography of plasma proteins under native conditions, SOGA eluted at 25 kDa (see Supplemental Figure 1B at http://ajp.amjpathol.org).
Correlation between Circulating Adiponectin and SOGA
To further validate the link between adiponectin and SOGA in vivo, we measured circulating levels of adiponectin and SOGA in i) healthy human volunteers, ii) wild-type mice after weight reduction by calorie restriction, and iii) pioglitazone treatment in ob/ob mice, an obese model of type II diabetes. The analysis of human plasma from healthy fasting female volunteers (plasma insulin: 7.1 ± 1.0 μU/ml) showed a positive correlation between circulating levels of adiponectin and SOGA (R2 = 0.82) (Figure 3A). Calorie restriction, a nutritional intervention that doubled plasma adiponectin, resulted in a twofold elevation of circulating SOGA (Figure 3B). The concentration of plasma glucose in CR mice compared with AL mice was 80 ± 7 mg/dl and 131 ± 10 mg/dl, respectively (Figure 3B). The complex oligomeric structure, high turnover rate, and abundance of circulating adiponectin prevented us from using recombinant adiponectin to study the regulation of SOGA in vivo.42 Therefore, oral pioglitazone treatment was used to elevate adiponectin in ob/ob mice. Pioglitazone treatment caused a 40% increase of SOGA mRNA in the liver and a threefold elevation of circulating adiponectin and SOGA (Figure 3C). The concentration of plasma glucose was 155 ± 8 mg/dl in pioglitazone treated ob/ob mice compared with 450 ± 18 mg/dl in untreated ob/ob mice (P < 0.05) (Figure 3C). These results support the hypothesis that adiponectin elevation of SOGA increases insulin sensitivity. Both calorie restriction and pioglitazone treatment have pleitropic effects beyond the elevation of circulating adiponectin, making it difficult to draw any direct conclusions about the linkage between adiponectin and SOGA. Hence, we compared circulating levels of SOGA between wild-type and adiponectin transgenic mice (Figure 3D). Previous studies have shown that the threefold elevation of adiponectin in transgenic mice exerts a protective effect against a diabetogenic high-fat diet.9,16 Consistent with a stimulatory effect of adiponectin, circulating levels of SOGA were higher in adiponectin transgenic mice than their wild-type littermates on a high-fat diet (Figure 3D). These results further support the hypothesis that an increase in SOGA contributes to the reduction of plasma glucose.
Figure 3.
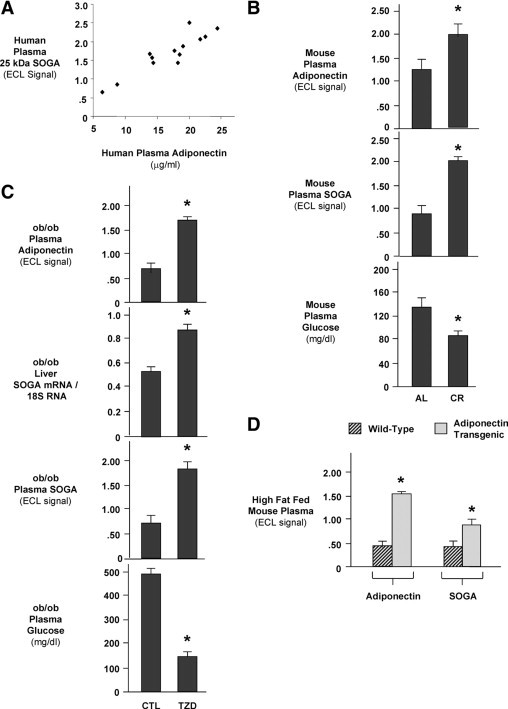
Circulating adiponectin and SOGA levels in humans and mice. A: Adiponectin and 25-kDa SOGA levels in human plasma from healthy female volunteers (ages 20–63; n = 13). Plasma was collected after an overnight fast. Values represent averages from two plasma samples taken 10 minutes apart. A correlation coefficient (R2) of 0.82 was found between SOGA and adiponectin. B: The effect of AL versus 30% CR feeding on adiponectin, SOGA, and glucose in female wild-type mice. Bar graphs show levels of plasma adiponectin (top), 25-kDa SOGA (middle), and glucose (bottom). C: The effect of pioglitazone treatment on liver SOGA mRNA and circulating adiponectin, SOGA, and glucose in diabetic ob/ob mice. Mice received a daily dose of pioglitazone (TZD) or placebo (CTL) by oral gavage. Bar graphs show the levels of plasma adiponectin (top), liver SOGA mRNA/18S RNA (second), plasma 25 kDa SOGA (third), and plasma glucose (bottom) after 4 days of treatment. D: Circulating levels of adiponectin and SOGA in male adiponectin transgenic mice and their wild-type littermates on a high-fat diet. Bars in panels B, C, and D represent mean ± SEM for n = 4–5 per group where there is a significant difference (*P < 0.05) by nonparametric Student's t-test.
Correlation between Circulating Insulin and SOGA
Because adiponectin is an insulin sensitizer and the inhibition of the insulin signaling intermediate PI3K blocked the induction of SOGA in isolated hepatocytes (Figure 2D), we sought to determine whether there is a correlation between circulating levels of insulin and SOGA during i) feeding and fasting in humans and ii) insulin withdrawal in NOD mice, a model of type I diabetes. Consistent with the hypothesis that insulin stimulates SOGA, a 12-hour fast in healthy human volunteers was associated with a 25% reduction in circulating SOGA (Figure 4A). A threefold reduction of circulating SOGA in hyperglycemic NOD mice, in comparison with euglycemic NOD mice, also suggests that insulin induces SOGA in vivo (Figure 4B). In support of the hypothesis that an increase of SOGA contributes to the reduction of plasma glucose, the treatment of type I diabetes in NOD mice by insulin injection was associated with a twofold induction of SOGA (Figure 4B). The reduction of SOGA during fasting and insulin withdrawal is consistent with the increase of autophagy in these states.21–23
Figure 4.

Circulating levels of SOGA in relation to insulin in humans and mice. A: Percent change in circulating levels of SOGA in healthy human volunteers (20–43 years old) measured at 8:00–11:00 AM, either at two hours after feeding or following an overnight (10–12 hour) fast. Bars represent mean values ± SEM for n = 5, and there is a significant a difference at *P < 0.05 by nonparametric Student's t-test. B: The effect of insulin withdrawal and insulin injection on SOGA and glucose in female NOD mice. Circulating levels of 25-kDa SOGA and glucose in NOD mice without diabetes (Group 1), NOD mice with diabetes (Group 2), and NOD mice with diabetes treated by a single injection of insulin 24 hours earlier (Group 3). Bar graphs show the levels of plasma SOGA (top) and glucose (bottom). Bars show mean ± SEM for n = 5 per group. Statistical significance was determined by Student's t-test where *P < 0.05.
Discussion
The results of this study suggest that the elevation of SOGA in response to adiponectin and insulin lowers liver glucose production through the inhibition of autophagy, resulting in a decrease of plasma glucose. The observation that knockdown of SOGA elevated glucose production in primary hepatocytes indicates that SOGA is an inhibitor of glucose production. The elevation of glucose production during knockdown of SOGA was linked to changes in primary hepatocytes, which suggested an increase in autophagy. The reduction in protein content, increased staining of late autophagosome and lysome vacuoles, and the secretion of valine are all indicative of increased autophagy during the knockdown of SOGA.
The mechanism through which SOGA interferes with autophagy may be linked to the Atg16- and Rab5-binding motifs in SOGA.36 Both Atg16 and Rab5 contribute to the early stages of autophagy.43 Although Atg16 is an essential component of the autophagic machinery, adenoviral overexpression of Atg16 inhibits autophagy in mammalian cells.44,45 The disruption of autophagy by overexpression of Atg16 provides a paradigm that may explain how elevated SOGA inhibits autophagy. Although the current study focuses on the role of SOGA in the liver, it is important to point out that SOGA is expressed in the other gluconeogenic organs such as the kidneys. SOGA is also expressed in tissues that are rich sources of gluconeogenic substrates like skeletal and cardiac muscle. Therefore, the elevation of SOGA in extrahepatic tissues can play a critical role in the reduction of glucose production and the amelioration of glucose homeostasis.
Intracellular levels of SOGA in isolated hepatocytes were proportional to the levels of SOGA in hepatocyte-conditioned media, leading us to propose that circulating levels of SOGA can be used as a biomarker for the intracellular levels of SOGA. This hypothesis was supported by the elevation of liver SOGA mRNA and circulating SOGA in pioglitazone-treated ob/ob mice. Our in vitro experiments suggest that the elevation of circulating SOGA indicates a decrease in glucose production. This interpretation is consistent with the elevation of circulating SOGA after calorie restriction, oral pioglitazone, transgenic elevation of adiponectin, feeding, and insulin injection. Although in vivo glucose production was not measured in the present study, previous reports show that glucose production is reduced by the elevation of adiponectin in transgenic mice, the implementation of calorie restriction, the treatment of type II diabetes by oral insulin sensitizers, and the treatment of type I diabetes by insulin.6,8,9,16,46,47
The elevation of SOGA in CR, pioglitazone-treated and adiponectin-transgenic mice supports the hypothesis that adiponectin induces SOGA in vivo. In isolated hepatocytes, the elevation of SOGA in response to adiponectin was not impaired by AMPK. However, adiponectin-mediated increases in SOGA were impaired by pharmacological inhibition of the insulin-signaling intermediate PI3K, suggesting that adiponectin regulation of SOGA is mediated through the insulin-signaling pathway. The elevation of circulating SOGA by feeding calorie restriction, pioglitazone treatment and insulin injection support the hypothesis that SOGA is induced through the insulin-signaling pathway. Adiponectin could increase SOGA through the insulin-signaling pathway via APPL1, an adaptor protein that binds to the intracellular domain of the adiponectin receptors and the catalytic subunit of PI3K.15,48,49
Antibodies recognizing the C-terminal region of murine SOGA show that cultured hepatocytes as well as liver samples incubated ex vivo secrete an 80-kDa SOGA fragment rather than a 161-kDa protein predicted by the 4.7-kb cDNA. The size discrepancy is explained by the location of an internal signal peptide; an internal signal peptide is also observed in chicken ovalbumin.50 The fate and function of the amino-terminal portion of SOGA is unknown to us because our antibodies only recognize the carboxy-terminal end of SOGA. The presence of repeated LXXXXXXL sequences in the amino-terminal portion of SOGA (16–30 and 230–262) suggests a potential feedback mechanism through protein–protein interactions of leucine zipper motifs in SOGA and APPL1.48 The absence of 25-kDa SOGA in hepatocytes and liver-conditioned media suggests that proteolytic cleavage of 80-kDa SOGA depends on an extracellular factor that is inactive or absent in vitro. The mechanism that yields the 25-kDa SOGA fragment is currently unknown. The incubation of mouse hepatocyte–conditioned media containing 80-kDa SOGA with endothelial cells (HUVECs) or human plasma did not yield a 25-kDa fragment. Circulating SOGA may play a physiological role in glucose homeostasis. The function of circulating SOGA will emerge from ongoing studies with recombinant SOGA.
The discovery that circulating levels of adiponectin and SOGA are highly correlated in humans suggests that the measurement of SOGA may be clinically relevant. For example, while glitazone drug treatment is almost always effective in the induction of adiponectin, it is only effective in lowering glucose in 70% of type II diabetics.51 Insulin treatment of type I diabetes is also not completely effective 100% of the time. Based on the results presented here, it would not be surprising if poor clinical outcomes were associated with low induction of SOGA.
Footnotes
Supported by grants from the National Institutes of Diabetes and Digestive and Kidney Diseases (DK075573 and DK056350), Allergy and Infectious Diseases (AI066075), Environmental Health Sciences (ES010126) and a Graduate Women in Science Fellowship. The mRNA and predicted amino acid sequences for murine SOGA were submitted to GENBANK (FJ977045).
R.P.B., M.M.A., and J.M.A. contributed equally to this study.
CME Disclosure: None of the authors disclosed any relevant financial relationships.
Supplemental material for this article can be found on http://ajp.amjpathol.org.
Web Extra Material
Circulating 25 kDa SOGA. (A) SDS-PAGE showing the SOGA peptide antigen 476 was detected with immune but not pre-immune sera. The blot exposed to immune sera shows that the signal intensity is proportional to the peptide antigen concentration. (B)Left. Mouse-specific polyclonal antisera 476 detected a 25 kDa protein in mouse plasma but not human plasma. Right. Antisera from 2 different rabbits immunized with 2 different peptide antigens, 476 and 477, detected a 25 kDa peptide in mouse plasma. Peptide antigens 476 and 477 correspond to overlapping amino acid sequences in the species specific epitope of SOGA. Peptide antigens used to produce rabbit antisera, SAQSLASCFIRPSRNPIRHSPSKC (antigen 476) and CSAQSLASCFIRPSRN (antigen 477), were analyzed by mass spectrometry to confirm their amino acid sequence. (C)Top Panel. Absorption plot (UV) for murine plasma proteins generated by HPLC. Size exclusion chromatography was achieved using an FPLC column (BioSil SEC250, BIORAD). FPLC shows that 25 kDa SOGA circulates as a monomer that can be isolated in fraction 9. For reference, the triglyceride peak (VLDL particle, ˜400 kDa) and the cholesterol peak (HDL particle, ˜200 kDa) were observed in fractions 1–2 and 5–6, respectively. Bottom Panel. SDS-PAGE showing SOGA precipitated out of FPLC fraction 9 in a 40% ammonium sulfate solution.
References
- 1.Goldfine AB, Kahn CR. Adiponectin: linking the fat cell to insulin sensitivity. Lancet. 2003;362:1431–1432. doi: 10.1016/S0140-6736(03)14727-7. [DOI] [PubMed] [Google Scholar]
- 2.Arita Y, Kihara S, Ouchi N, Takahashi M, Maeda K, Miyagawa J, Hotta K, Shimomura I, Nakamura T, Miyaoka K, Kuriyama H, Nishida M, Yamashita S, Okubo K, Matsubara K, Muraguchi M, Ohmoto Y, Funahashi T, Matsuzawa Y. Paradoxical decrease of an adipose-specific protein, adiponectin, in obesity. Biochem Biophys Res Commun. 1999;257:79–83. doi: 10.1006/bbrc.1999.0255. [DOI] [PubMed] [Google Scholar]
- 3.Hotta K, Funahashi T, Arita Y, Takahashi M, Matsuda M, Okamoto Y, Iwahashi H, Kuriyama H, Ouchi N, Maeda K, Nishida M, Kihara S, Sakai N, Nakajima T, Hasegawa K, Muraguchi M, Ohmoto Y, Nakamura T, Yamashita S, Hanafusa T, Matsuzawa Y. Plasma concentrations of a novel, adipose-specific protein, adiponectin, in type 2 diabetic patients. Arterioscler Thromb Vasc Biol. 2000;20:1595–1599. doi: 10.1161/01.atv.20.6.1595. [DOI] [PubMed] [Google Scholar]
- 4.Maeda N, Takahashi M, Funahashi T, Kihara S, Nishizawa H, Kishida K, Nagaretani H, Matsuda M, Komuro R, Ouchi N, Kuriyama H, Hotta K, Nakamura T, Shimomura I, Matsuzawa Y. PPARgamma ligands increase expression and plasma concentrations of adiponectin, an adipose-derived protein. Diabetes. 2001;50:2094–2099. doi: 10.2337/diabetes.50.9.2094. [DOI] [PubMed] [Google Scholar]
- 5.Weyer C, Funahashi T, Tanaka S, Hotta K, Matsuzawa Y, Pratley RE, Tataranni PA. Hypoadiponectinemia in obesity and type 2 diabetes: close association with insulin resistance and hyperinsulinemia. J Clin Endocrinol Metab. 2001;86:1930–1935. doi: 10.1210/jcem.86.5.7463. [DOI] [PubMed] [Google Scholar]
- 6.Wahren J, Ekberg K. Splanchnic regulation of glucose production. Annu Rev Nutr. 2007;27:329–345. doi: 10.1146/annurev.nutr.27.061406.093806. [DOI] [PubMed] [Google Scholar]
- 7.Berg AH, Combs TP, Du X, Brownlee M, Scherer PE. The adipocyte-secreted protein Acrp30 enhances hepatic insulin action. Nat Med. 2001;7:947–953. doi: 10.1038/90992. [DOI] [PubMed] [Google Scholar]
- 8.Combs TP, Berg AH, Obici S, Scherer PE, Rossetti L. Endogenous glucose production is inhibited by the adipose-derived protein Acrp30. J Clin Invest. 2001;108:1875–1881. doi: 10.1172/JCI14120. [DOI] [PMC free article] [PubMed] [Google Scholar]
- 9.Combs TP, Pajvani UB, Berg AH, Lin Y, Jelicks LA, Laplante M, Nawrocki AR, Rajala MW, Parlow AF, Cheeseboro L, Ding YY, Russell RG, Lindemann D, Hartley A, Baker GR, Obici S, Deshaies Y, Ludgate M, Rossetti L, Scherer PE. A transgenic mouse with a deletion in the collagenous domain of adiponectin displays elevated circulating adiponectin and improved insulin sensitivity. Endocrinology. 2004;145:367–383. doi: 10.1210/en.2003-1068. [DOI] [PubMed] [Google Scholar]
- 10.Tomas E, Tsao TS, Saha AK, Murrey HE, Zhang CcC, Itani SI, Lodish HF, Ruderman NB. Enhanced muscle fat oxidation and glucose transport by ACRP30 globular domain: acetyl-CoA carboxylase inhibition and AMP-activated protein kinase activation. Proc Natl Acad Sci USA. 2002;99:16309–16313. doi: 10.1073/pnas.222657499. [DOI] [PMC free article] [PubMed] [Google Scholar]
- 11.Yamauchi T, Kamon J, Minokoshi Y, Ito Y, Waki H, Uchida S, Yamashita S, Noda M, Kita S, Ueki K, Eto K, Akanuma Y, Froguel P, Foufelle F, Ferre P, Carling D, Kimura S, Nagai R, Kahn BB, Kadowaki T. Adiponectin stimulates glucose utilization and fatty-acid oxidation by activating AMP-activated protein kinase. Nat Med. 2002;8:1288–1295. doi: 10.1038/nm788. [DOI] [PubMed] [Google Scholar]
- 12.Shklyaev S, Aslanidi G, Tennant M, Prima V, Kohlbrenner E, Kroutov V, Campbell-Thompson M, Crawford J, Shek EW, Scarpace PJ, Zolotukhin S. Sustained peripheral expression of transgene adiponectin offsets the development of diet-induced obesity in rats. Proc Natl Acad Sci USA. 2003;100:14217–14222. doi: 10.1073/pnas.2333912100. [DOI] [PMC free article] [PubMed] [Google Scholar]
- 13.Nawrocki AR, Rajala MW, Tomas E, Pajvani UB, Saha AK, Trumbauer ME, Pang Z, Chen AS, Ruderman NB, Chen H, Rossetti L, Scherer PE. Mice lacking adiponectin show decreased hepatic insulin sensitivity and reduced responsiveness to peroxisome proliferator-activated receptor gamma agonists. J Biol Chem. 2006;281:2654–2660. doi: 10.1074/jbc.M505311200. [DOI] [PubMed] [Google Scholar]
- 14.Andreelli F, Foretz M, Knauf C, Cani PD, Perrin C, Iglesias MA, Pillot B, Bado A, Tronche F, Mithieux G, Vaulont S, Burcelin R, Viollet B. Liver adenosine monophosphate-activated kinase-alpha2 catalytic subunit is a key target for the control of hepatic glucose production by adiponectin and leptin but not insulin. Endocrinology. 2006;147:2432–2441. doi: 10.1210/en.2005-0898. [DOI] [PubMed] [Google Scholar]
- 15.Mao X, Kikani CK, Riojas RA, Langlais P, Wang L, Ramos FJ, Fang Q, Christ-Roberts CY, Hong JY, Kim RY, Liu F, Dong LQ. APPL1 binds to adiponectin receptors and mediates adiponectin signalling and function. Nat Cell Biol. 2006;8:516–523. doi: 10.1038/ncb1404. [DOI] [PubMed] [Google Scholar]
- 16.Brooks NL, Trent CM, Raetzsch CF, Flurkey K, Boysen G, Perfetti MT, Jeong YC, Klebanov S, Patel KB, Khodush VR, Kupper LL, Carling D, Swenberg JA, Harrison DE, Combs TP. Low utilization of circulating glucose after food withdrawal in Snell dwarf mice. J Biol Chem. 2007;282:35069–35077. doi: 10.1074/jbc.M700484200. [DOI] [PubMed] [Google Scholar]
- 17.Yoon YS, Ryu D, Lee MW, Hong S, Koo SH. Adiponectin and thiazolidinedione targets CRTC2 to regulate hepatic gluconeogenesis. Exp Mol Med. 2009;41:577–583. doi: 10.3858/emm.2009.41.8.063. [DOI] [PMC free article] [PubMed] [Google Scholar]
- 18.Wang C, Mao X, Wang L, Liu M, Wetzel MD, Guan KL, Dong LQ, Liu F. Adiponectin sensitizes insulin signaling by reducing p70 S6 kinase-mediated serine phosphorylation of IRS-1. J Biol Chem. 2007;282:7991–7996. doi: 10.1074/jbc.M700098200. [DOI] [PubMed] [Google Scholar]
- 19.Hug C, Wang J, Ahmad NS, Bogan JS, Tsao TS, Lodish HF. T-cadherin is a receptor for hexameric and high-molecular-weight forms of Acrp30/adiponectin. Proc Natl Acad Sci USA. 2004;101:10308–10313. doi: 10.1073/pnas.0403382101. [DOI] [PMC free article] [PubMed] [Google Scholar]
- 20.Yamauchi T, Kamon J, Ito Y, Tsuchida A, Yokomizo T, Kita S, Sugiyama T, Miyagishi M, Hara K, Tsunoda M, Murakami K, Ohteki T, Uchida S, Takekawa S, Waki H, Tsuno NH, Shibata Y, Terauchi Y, Froguel P, Tobe K, Koyasu S, Taira K, Kitamura T, Shimizu T, Nagai R, Kadowaki T. Cloning of adiponectin receptors that mediate antidiabetic metabolic effects. Nature. 2003;423:762–769. doi: 10.1038/nature01705. [DOI] [PubMed] [Google Scholar]
- 21.Amherdt M, Harris V, Renold AE, Orci L, Unger RH. Hepatic autography in uncontrolled experimental diabetes and its relationships to insulin and glucagon. J Clin Invest. 1974;54:188–193. doi: 10.1172/JCI107742. [DOI] [PMC free article] [PubMed] [Google Scholar]
- 22.de Waal EJ, Vreeling-Sindelarova H, Schellens JP, Houtkooper JM, James J. Quantitative changes in the lysosomal vacuolar system of rat hepatocytes during short-term starvation. A morphometric analysis with special reference to macro- and microautophagy. Cell Tissue Res. 1986;243:641–648. doi: 10.1007/BF00218073. [DOI] [PubMed] [Google Scholar]
- 23.Lenk SE, Bhat D, Blakeney W, Dunn WA., Jr Effects of streptozotocin-induced diabetes on rough endoplasmic reticulum and lysosomes of rat liver. Am J Physiol. 1992;263:E856–E862. doi: 10.1152/ajpendo.1992.263.5.E856. [DOI] [PubMed] [Google Scholar]
- 24.Mortimore GE, Poso AR. Intracellular protein catabolism and its control during nutrient deprivation and supply. Annu Rev Nutr. 1987;7:539–564. doi: 10.1146/annurev.nu.07.070187.002543. [DOI] [PubMed] [Google Scholar]
- 25.Kotoulas OB, Kalamidas SA, Kondomerkos DJ. Glycogen autophagy in glucose homeostasis. Pathol Res Pract. 2006;202:631–638. doi: 10.1016/j.prp.2006.04.001. [DOI] [PubMed] [Google Scholar]
- 26.Singh R, Kaushik S, Wang Y, Xiang Y, Novak I, Komatsu M, Tanaka K, Cuervo AM, Czaja MJ. Autophagy regulates lipid metabolism. Nature. 2009;458:1131–1135. doi: 10.1038/nature07976. [DOI] [PMC free article] [PubMed] [Google Scholar]
- 27.Blommaart EF, Luiken JJ, Blommaart PJ, van Woerkom GM, Meijer AJ. Phosphorylation of ribosomal protein S6 is inhibitory for autophagy in isolated rat hepatocytes. J Biol Chem. 1995;270:2320–2326. doi: 10.1074/jbc.270.5.2320. [DOI] [PubMed] [Google Scholar]
- 28.Kanazawa T, Taneike I, Akaishi R, Yoshizawa F, Furuya N, Fujimura S, Kadowaki M. Amino acids and insulin control autophagic proteolysis through different signaling pathways in relation to mTOR in isolated rat hepatocytes. J Biol Chem. 2004;279:8452–8459. doi: 10.1074/jbc.M306337200. [DOI] [PubMed] [Google Scholar]
- 29.Shaw RJ, Bardeesy N, Manning BD, Lopez L, Kosmatka M, DePinho RA, Cantley LC. The LKB1 tumor suppressor negatively regulates mTOR signaling. Cancer Cell. 2004;6:91–99. doi: 10.1016/j.ccr.2004.06.007. [DOI] [PubMed] [Google Scholar]
- 30.Meley D, Bauvy C, Houben-Weerts JH, Dubbelhuis PF, Helmond MT, Codogno P, Meijer AJ. AMP-activated protein kinase and the regulation of autophagic proteolysis. J Biol Chem. 2006;281:34870–34879. doi: 10.1074/jbc.M605488200. [DOI] [PubMed] [Google Scholar]
- 31.Xu ZX, Liang J, Haridas V, Gaikwad A, Connolly FP, Mills GB, Gutterman JU. A plant triterpenoid, avicin D, induces autophagy by activation of AMP-activated protein kinase. Cell Death Differ. 2007;14:1948–1957. doi: 10.1038/sj.cdd.4402207. [DOI] [PubMed] [Google Scholar]
- 32.Liang J, Shao SH, Xu ZX, Hennessy B, Ding Z, Larrea M, Kondo S, Dumont DJ, Gutterman JU, Walker CL, Slingerland JM, Mills GB. The energy sensing LKB1-AMPK pathway regulates p27(kip1) phosphorylation mediating the decision to enter autophagy or apoptosis. Nat Cell Biol. 2007;9:218–224. doi: 10.1038/ncb1537. [DOI] [PubMed] [Google Scholar]
- 33.Meijer AJ, Codogno P. AMP-activated protein kinase and autophagy. Autophagy. 2007;3:238–240. doi: 10.4161/auto.3710. [DOI] [PubMed] [Google Scholar]
- 34.Cheng SW, Fryer LG, Carling D, Shepherd PR. Thr2446 is a novel mammalian target of rapamycin (mTOR) phosphorylation site regulated by nutrient status. J Biol Chem. 2004;279:15719–15722. doi: 10.1074/jbc.C300534200. [DOI] [PubMed] [Google Scholar]
- 35.Hoyer-Hansen M, Bastholm L, Szyniarowski P, Campanella M, Szabadkai G, Farkas T, Bianchi K, Fehrenbacher N, Elling F, Rizzuto R, Mathiasen IS, Jaattela M. Control of macroautophagy by calcium, calmodulin-dependent kinase kinase-beta, and Bcl-2. Mol Cell. 2007;25:193–205. doi: 10.1016/j.molcel.2006.12.009. [DOI] [PubMed] [Google Scholar]
- 36.Buljan M, Bateman A. The evolution of protein domain families. Biochem Soc Trans. 2009;37:751–755. doi: 10.1042/BST0370751. [DOI] [PubMed] [Google Scholar]
- 37.Klionsky DJ, Abeliovich H, Agostinis P, Agrawal DK, Aliev G, Askew DS, Baba M, Baehrecke EH, Bahr BA, Ballabio A, Bamber BA, Bassham DC, Bergamini E, Bi X, Biard-Piechaczyk M, Blum JS, Bredesen DE, Brodsky JL, Brumell JH, Brunk UT, Bursch W, Camougrand N, Cebollero E, Cecconi F, Chen Y, Chin LS, Choi A, Chu CT, Chung J, Clarke PG, Clark RS, Clarke SG, Clavé C, Cleveland JL, Codogno P, Colombo MI, Coto-Montes A, Cregg JM, Cuervo AM, Debnath J, Demarchi F, Dennis PB, Dennis PA, Deretic V, Devenish RJ, Di Sano F, Dice JF, Difiglia M, Dinesh-Kumar S, Distelhorst CW, Djavaheri-Mergny M, Dorsey FC, Dröge W, Dron M, Dunn WA, Jr, Duszenko M, Eissa NT, Elazar Z, Esclatine A, Eskelinen EL, Fésüs L, Finley KD, Fuentes JM, Fueyo J, Fujisaki K, Galliot B, Gao FB, Gewirtz DA, Gibson SB, Gohla A, Goldberg AL, Gonzalez R, González-Estévez C, Gorski S, Gottlieb RA, Häussinger D, He YW, Heidenreich K, Hill JA, Høyer-Hansen M, Hu X, Huang WP, Iwasaki A, Jäättelä M, Jackson WT, Jiang X, Jin S, Johansen T, Jung JU, Kadowaki M, Kang C, Kelekar A, Kessel DH, Kiel JA, Kim HP, Kimchi A, Kinsella TJ, Kiselyov K, Kitamoto K, Knecht E, Komatsu M, Kominami E, Kondo S, Kovács AL, Kroemer G, Kuan CY, Kumar R, Kundu M, Landry J, Laporte M, Le W, Lei HY, Lenardo MJ, Levine B, Lieberman A, Lim KL, Lin FC, Liou W, Liu LF, Lopez-Berestein G, López-Otín C, Lu B, Macleod KF, Malorni W, Martinet W, Matsuoka K, Mautner J, Meijer AJ, Meléndez A, Michels P, Miotto G, Mistiaen WP, Mizushima N, Mograbi B, Monastyrska I, Moore MN, Moreira PI, Moriyasu Y, Motyl T, Münz C, Murphy LO, Naqvi NI, Neufeld TP, Nishino I, Nixon RA, Noda T, Nürnberg B, Ogawa M, Oleinick NL, Olsen LJ, Ozpolat B, Paglin S, Palmer GE, Papassideri I, Parkes M, Perlmutter DH, Perry G, Piacentini M, Pinkas-Kramarski R, Prescott M, Proikas-Cezanne T, Raben N, Rami A, Reggiori F, Rohrer B, Rubinsztein DC, Ryan KM, Sadoshima J, Sakagami H, Sakai Y, Sandri M, Sasakawa C, Sass M, Schneider C, Seglen PO, Seleverstov O, Settleman J, Shacka JJ, Shapiro IM, Sibirny A, Silva-Zacarin EC, Simon HU, Simone C, Simonsen A, Smith MA, Spanel-Borowski K, Srinivas V, Steeves M, Stenmark H, Stromhaug PE, Subauste CS, Sugimoto S, Sulzer D, Suzuki T, Swanson MS, Tabas I, Takeshita F, Talbot NJ, Tallóczy Z, Tanaka K, Tanaka K, Tanida I, Taylor GS, Taylor JP, Terman A, Tettamanti G, Thompson CB, Thumm M, Tolkovsky AM, Tooze SA, Truant R, Tumanovska LV, Uchiyama Y, Ueno T, Uzcátegui NL, van der Klei I, Vaquero EC, Vellai T, Vogel MW, Wang HG, Webster P, Wiley JW, Xi Z, Xiao G, Yahalom J, Yang JM, Yap G, Yin XM, Yoshimori T, Yu L, Yue Z, Yuzaki M, Zabirnyk O, Zheng X, Zhu X, Deter RL. Guidelines for the use and interpretation of assays for monitoring autophagy in higher eukaryotes. Autophagy. 2008;4:151–175. doi: 10.4161/auto.5338. [DOI] [PMC free article] [PubMed] [Google Scholar]
- 38.Combs TP, Berg AH, Rajala MW, Klebanov S, Iyengar P, Jimenez-Chillaron JC, Patti ME, Klein SL, Weinstein RS, Scherer PE. Sexual differentiation, pregnancy, calorie restriction, and aging affect the adipocyte-specific secretory protein adiponectin. Diabetes. 2003;52:268–276. doi: 10.2337/diabetes.52.2.268. [DOI] [PubMed] [Google Scholar]
- 39.Wong CP, Li L, Frelinger JA, Tisch R. Early autoimmune destruction of islet grafts is associated with a restricted repertoire of IGRP-specific CD8+ T cells in diabetic nonobese diabetic mice. J Immunol. 2006;176:1637–1644. doi: 10.4049/jimmunol.176.3.1637. [DOI] [PubMed] [Google Scholar]
- 40.Fischer LM, daCosta KA, Kwock L, Stewart PW, Lu TS, Stabler SP, Allen RH, Zeisel SH. Sex and menopausal status influence human dietary requirements for the nutrient choline. Am J Clin Nutr. 2007;85:1275–1285. doi: 10.1093/ajcn/85.5.1275. [DOI] [PMC free article] [PubMed] [Google Scholar]
- 41.Emanuelsson O, Brunak S, von Heijne G, Nielsen H. Locating proteins in the cell using TargetP. SignalP and related tools. Nat Protoc. 2007;2:953–971. doi: 10.1038/nprot.2007.131. [DOI] [PubMed] [Google Scholar]
- 42.Shetty S, Kusminski CM, Scherer PE. Adiponectin in health and disease: evaluation of adiponectin-targeted drug development strategies. Trends Pharmacol Sci. 2009;30:234–239. doi: 10.1016/j.tips.2009.02.004. [DOI] [PubMed] [Google Scholar]
- 43.Longatti A, Tooze SA. Vesicular trafficking and autophagosome formation. Cell Death Differ. 2009;16:956–965. doi: 10.1038/cdd.2009.39. [DOI] [PubMed] [Google Scholar]
- 44.Matsushita M, Suzuki NN, Obara K, Fujioka Y, Ohsumi Y, Inagaki F. Structure of Atg5.Atg16, a complex essential for autophagy. J Biol Chem. 2007;282:6763–6772. doi: 10.1074/jbc.M609876200. [DOI] [PubMed] [Google Scholar]
- 45.Fujita N, Itoh T, Omori H, Fukuda M, Noda T, Yoshimori T. The Atg16L complex specifies the site of LC3 lipidation for membrane biogenesis in autophagy. Mol Biol Cell. 2008;19:2092–2100. doi: 10.1091/mbc.E07-12-1257. [DOI] [PMC free article] [PubMed] [Google Scholar]
- 46.Barzilai N, Banerjee S, Hawkins M, Chen W, Rossetti L. Caloric restriction reverses hepatic insulin resistance in aging rats by decreasing visceral fat. J Clin Invest. 1998;101:1353–1361. doi: 10.1172/JCI485. [DOI] [PMC free article] [PubMed] [Google Scholar]
- 47.Miyazaki Y, Mahankali A, Wajcberg E, Bajaj M, Mandarino LJ, DeFronzo RA. Effect of pioglitazone on circulating adipocytokine levels and insulin sensitivity in type 2 diabetic patients. J Clin Endocrinol Metab. 2004;89:4312–4319. doi: 10.1210/jc.2004-0190. [DOI] [PubMed] [Google Scholar]
- 48.Mitsuuchi Y, Johnson SW, Sonoda G, Tanno S, Golemis EA, Testa JR. Identification of a chromosome 3p14.3–21.1 gene. APPL, encoding an adaptor molecule that interacts with the oncoprotein-serine/threonine kinase AKT2. Oncogene. 1999;18:4891–4898. doi: 10.1038/sj.onc.1203080. [DOI] [PubMed] [Google Scholar]
- 49.Yang L, Lin HK, Altuwaijri S, Xie S, Wang L, Chang C. APPL suppresses androgen receptor transactivation via potentiating Akt activity. J Biol Chem. 2003;278:16820–16827. doi: 10.1074/jbc.M213163200. [DOI] [PubMed] [Google Scholar]
- 50.Lingappa VR, Lingappa JR, Blobel G. Chicken ovalbumin contains an internal signal sequence. Nature. 1979;281:117–121. doi: 10.1038/281117a0. [DOI] [PubMed] [Google Scholar]
- 51.Snitker S, Watanabe RM, Ani I, Xiang AH, Marroquin A, Ochoa C, Goico J, Shuldiner AR, Buchanan TA. Changes in insulin sensitivity in response to troglitazone do not differ between subjects with and without the common, functional Pro12Ala peroxisome proliferator-activated receptor-gamma2 gene variant: results from the Troglitazone in Prevention of Diabetes (TRIPOD) study. Diabetes Care. 2004;27:1365–1368. doi: 10.2337/diacare.27.6.1365. [DOI] [PMC free article] [PubMed] [Google Scholar]
Associated Data
This section collects any data citations, data availability statements, or supplementary materials included in this article.
Supplementary Materials
Circulating 25 kDa SOGA. (A) SDS-PAGE showing the SOGA peptide antigen 476 was detected with immune but not pre-immune sera. The blot exposed to immune sera shows that the signal intensity is proportional to the peptide antigen concentration. (B)Left. Mouse-specific polyclonal antisera 476 detected a 25 kDa protein in mouse plasma but not human plasma. Right. Antisera from 2 different rabbits immunized with 2 different peptide antigens, 476 and 477, detected a 25 kDa peptide in mouse plasma. Peptide antigens 476 and 477 correspond to overlapping amino acid sequences in the species specific epitope of SOGA. Peptide antigens used to produce rabbit antisera, SAQSLASCFIRPSRNPIRHSPSKC (antigen 476) and CSAQSLASCFIRPSRN (antigen 477), were analyzed by mass spectrometry to confirm their amino acid sequence. (C)Top Panel. Absorption plot (UV) for murine plasma proteins generated by HPLC. Size exclusion chromatography was achieved using an FPLC column (BioSil SEC250, BIORAD). FPLC shows that 25 kDa SOGA circulates as a monomer that can be isolated in fraction 9. For reference, the triglyceride peak (VLDL particle, ˜400 kDa) and the cholesterol peak (HDL particle, ˜200 kDa) were observed in fractions 1–2 and 5–6, respectively. Bottom Panel. SDS-PAGE showing SOGA precipitated out of FPLC fraction 9 in a 40% ammonium sulfate solution.