

Abstract
Citrullinemia type I (CTLN1, OMIM# 215700) is an inherited urea cycle disorder that is caused by an argininosuccinate synthetase (ASS) enzyme deficiency. In this report, we describe two spontaneous hypomorphic alleles of the mouse Ass1 gene that serve as an animal model of CTLN1. These two independent mouse mutant alleles, also described in patients affected with CTLN1, interact to produce a range of phenotypes. While some mutant mice died within the first week after birth, others survived but showed severe retardation during postnatal development as well as alopecia, lethargy, and ataxia. Notable pathological findings were similar to findings in human CTLN1 patients and included citrullinemia and hyperammonemia along with delayed cerebellar development, epidermal hyperkeratosis, and follicular dystrophy. Standard treatments for CTLN1 were effective in rescuing the phenotype of these mutant mice. Based on our studies, we propose that defective cerebellar granule cell migration secondary to disorganization of Bergmann glial cell fibers cause cerebellar developmental delay in the hyperammonemic and citrullinemic brain, pointing to a possible role for nitric oxide in these processes. These mouse mutations constitute a suitable model for both mechanistic and preclinical studies of CTLN1 and other hyperammonemic encephalopathies and, at the same time, underscore the importance of complementing knockout mutations with hypomorphic mutations for the generation of animal models of human genetic diseases.
Urea cycle disorders (UCDs) are rare genetic diseases affecting protein catabolism1 through deficiency in one of the six enzymes involved in the cellular excretion process of ammonia.2 Most inborn errors of metabolism are inherited as recessive traits with the exception of X-linked ornithine transcarbamylase deficiency.3 The pathology of UCDs is characterized primarily by hyperammonemia and encephalopathy, with symptoms ranging from life-threatening episodes in newborns to recurrent headaches in adults.4,5 The reported incidence of all UCDs is approximately 1 in 25,000 live births in the United States,4 1 in 50,000 in Japan,6 and 1 in 44,000 in New South Wales, Australia.7 Currently, mouse knockout models exist for each of the UCDs, with the exception of N-acetylglutamate synthase.8
Citrullinemia type I (CTLN1) is a UCD that is characterized by severe neurological morbidity associated with hyperammonemia. The clinical spectrum of CTLN1 includes an acute neonatal form (the “classic” form) and a milder form with later onset.9–13 Untreated patients with the severe form of CTLN1 develop acute hyperammonemia leading to a life-threatening encephalopathy and mental retardation in survivors.14 Although rare, CTLN1 is a severe condition with high mortality rates that affects thousands of families in the United States, with an estimated incidence of 1 in 57,000 live births.4 Two recent studies determined that CTLN1 accounts for 14% to 27% of all reported UCDs.15,16 Clinical symptoms of neonatal CTLN1 include delayed mental and physical development, irritability, recurrent vomiting, and lethargy.9,17 Biochemically, CTLN1 is characterized by elevated plasma and urine concentrations of ammonia, citrulline, glutamine, and orotic acid, together with arginine deficiency.14,18 Treatment of patients affected with CTLN1 is based on the avoidance of hyperammonemia through dietary protein restriction, supportive management of catabolic stress, L-arginine therapy, and removal of nitrogen by alternative pathways.19–22
To date, the only gene associated with CTLN1 is ASS1, located on chromosome 9q34.1. This gene encodes argininosuccinate synthetase 1—a cytosolic enzyme that catalyzes the third step in the urea cycle, in which citrulline is condensed with aspartate to form argininosuccinic acid. Many genetic alterations have been reported at this locus including deletions, duplications, nonsense, and missense mutations.12,23–26 Severe CTLN1 phenotypes are associated with hypomorphic or loss-of-function mutations in ASS1 that result in either reduced or absent enzymatic activity. Defective activity may result from the absence of mRNA, misfolding, or rapid degradation of the enzyme. In vitro expression studies have shown that milder forms of CTLN1 are due to kinetic variants of well-folded ASS1 enzyme.12,27
The lack of appropriate animal models has precluded a more complete understanding of the pathogenesis and medical management of CTLN1. Although Ass1 knockout mice have been generated, homozygous knockout animals die shortly after birth, and no histopathological data are available for this model.28 A naturally occurring bovine model of CTLN1 was also described in the Friesian breed29; however, this model lacks many of the advantages of mouse models such as the feasibility of genetic manipulation. Despite their limitations, these two animal models have been used successfully in gene therapy studies.30,31
In this report, we describe a new hypomorphic mouse model of CTLN1 caused by two independent spontaneous recessive mutations at the Ass1 locus: barthez (bar) and follicular dystrophy (fold). Unlike the Ass1 knockout model, mice carrying these hypomorphic mutations survive longer and mimic CTLN1 both clinically and pathologically. Because the severity of the disease is unique for each of the hypomorphic mutations, severe, intermediate, and mild phenotypes can be created with different homozygous and compound heterozygous combinations. More importantly, the mutant phenotype can be rescued by standard treatments for CTLN1 patients like arginine supplementation and nitrogen scavengers. Through detailed histological examination of these mutants, we also demonstrated that one of the mechanisms leading to cerebellar developmental delay in affected mice is a slower rate of migration of granule cells into the internal granule layer, accompanied with increased apoptosis and lipid peroxidation but reduced nitrative stress. These hypomorphic mutations constitute excellent models for preclinical studies of CTLN1 that will allow the development of more effective therapies.
Materials and Methods
Animal Care
All mice housed at MD Anderson Cancer Center (MDACC) Smithville followed National Institutes of Health (NIH) guidelines (Guide for the Care and Use of Laboratory Animals) in a facility accredited by the Association for Assessment and Accreditation of Laboratory Animal Care International. The Institutional Animal Care and Use Committee at MDACC reviewed all projects involving the use of experimental animals and conducts site inspections of our facilities every six months. All studies on animals performed at Institut Pasteur followed the guidelines on the ethical use of animals from the European Communities Council Directive of 24 November 1986 (86/609/EEC).
Origin of Mutations
The bar mutant allele arose in an OF-1 outbred stock at Ecole Nationale Vétérinaire de Nantes, France. Mutant mice were introduced into the animal facility of the Institut Pasteur, Paris, in 1990 (a gift from Dr. Geneviève André-Fontaine, Ecole Nationale Vétérinaire de Nantes, France) and has since been maintained in a closed colony by crossing heterozygous +/bar mice (designated BAR/Pas). The mutation was designated “barthez” as a tribute to bald soccer celebrity Fabien Barthez, because affected mice showed generalized alopecia (baldness). Mice segregating for bar were transferred to the animal facilities of the MDACC, Smithville, where the mutant allele was backcrossed onto two different backgrounds by marker-assisted backcrossing to produce two independent congenic strains (FVB/N.Cg-Ass1bar and C57BL/6J.Cg-Ass1bar). Microsatellite genotyping was carried out in the Genetic Services Facility located at MDACC, Smithville. Specific pathogen-free FVB/N-Ass1bar (N5) and C57BL/6-Ass1bar (N4) were obtained through rederivation by embryo transfer and used for the phenotype description. The fold mutation was originally found at the Jackson Laboratory in a production colony of P/J mice. Congenic (N4) B6Ei.P-fold/J (stock number 006449) mice (fold/fold and +/fold) were purchased from The Jackson Laboratory (Bar Harbor, ME). The bar and fold mutations were proven to be allelic by using progeny testing. Genotyping for the bar and fold mutant alleles was done by direct sequencing using PCR primers designed to detect each missense mutation on genomic DNA. Primer sequences were: bar-FOR: 5′-TGGGTGGCCTCTGTCCTCAAG-3′; bar-REV: 5′-AAGCAAGGGGCAGCCAAGGT-3′; fold-FOR: 5′-ACTCCGGGGTAGGGTGGCTTG-3′; and fold-REV: 5′-TCTATTTGGCAGTGACCTTGCTC-3′.
Genetic Mapping and Assessment of Candidate Genes
The assignment of bar to chromosome 2 and further fine mapping were accomplished using two independent intercrosses (Institut Pasteur). For the first interspecific cross, we used the MAI/Pas strain (Mus m. musculus) and obtained 28 homozygous bar/bar F2 offspring that were genotyped with genome-wide microsatellite markers (Mouse MapPairs, Invitrogen, Carlsbad, CA). This linkage analysis enabled us to map the bar locus to proximal chromosome 2 (30 cM). The second interspecific cross was set up with MBT/Pas strain (Mus m. musculus), and a total of 88 bar/bar F2 offspring were genotyped with additional microsatellite markers flanking the bar locus to obtain a high resolution map. Microsatellites were PCR amplified under standard conditions (1.5 mmol/L MgCl2; 55°C annealing). Electrophoresis was performed on 4% agarose gels (Nusieve 3:1, FMC BioProducts; Rockland, ME). Further refinement of the genetic position of the bar locus was accomplished analyzing SNPs (identified “in house” by direct sequencing) segregating in hybrid (BAR/Pas × FVB/N)F2-bar/bar mice (MDACC). All predicted genes and expressed sequence tags located in our critical genetic interval (UCSC and Ensembl genome browsers) were considered as candidates. For candidate genes analysis, RNA extraction, reverse transcription (RT)-PCR, and DNA sequencing was performed using standard procedures. Briefly, total RNA was extracted from 100 mg of snap-frozen skin and liver of normal and mutant mice (homozygous bar and fold) using TRI reagent (Sigma, St. Louis, MO). Primers were designed from the Ass1 mRNA reference sequence (GenBank accession NM_007494). First strand cDNA was synthesized from total cellular RNA using GenAmp RNA PCR kit (Applied Biosystems Inc., Foster City, CA) according manufacturer instructions. Amplification products were sequenced using the ABI-PRISM Dye Terminator Cycle Sequencing Ready Reaction kit (Perkin Elmer, Norwalk, CT). Sequencing was carried out using an ABI 3130XL DNA sequencer (Perkin Elmer).
In Vivo Migration Assay-BrdU Labeling
Granule cell migration was measured by intraperitoneal injection of thymidine analog 5′-bromo-2′-deoxyuridine (BrdU) (60 μg/g; Sigma) into P7 and P11 mice, where proliferating cells in the external granular layer (EGL) take up BrdU before they migrate toward the internal granular layer (IGL). Mice were sacrificed 24, 48, and 72 hours after BrdU injection. Brain from both mutant and control animals were collected, fixed in formalin overnight, transferred to 70% ethanol, dehydrated, and paraffin processed for histopathology and immunohistochemical evaluation. After sectioning (midline sagittal), the slides were de-waxed, hydrated, and heat-induced epitope retrieval (HIER) was performed in a microwave oven with 10 mmol/L Citrate Buffer (pH 6.0) for 10 minutes. BrdU incorporation was detected by standard three-step immunoperoxidase detection using mouse anti-BrdU monoclonal antibody (Becton-Dickinson Immunocytometry System, Becton-Dickinson, San Jose, CA), biotin F(ab′) rabbit anti-mouse IgG (Accurate Chemical, Westbury, NY), and Streptavidin Peroxidase (BioGenex, San Ramon, CA.). Diaminobenzidine (BioGenex) was the chromagen used for visualization.
Immunohistochemistry (IHC)
Tissues from mutant and control mice were fixed in formalin overnight and then transferred to 70% ethanol for paraffin processing immediately after the mice were sacrificed. Immunohistochemical staining of dorsal skin was performed with polyclonal antibodies directed against mouse keratins K1, K5, K6, K10, K14, (Covance Research Products, Richmond, CA); loricrin, involucrin, and profilaggrin/filaggrin (BabCo, Richmond, CA), and Ki-67 (Dako, Carpinteria, CA) using standard procedures. Immunohistochemical staining for desmoglein 1 and 2 was performed using mouse anti-human desmoglein monoclonal antibody CBL174 (clone DG 3.10) (Chemicon International, Temecula, CA). Immunohistochemical staining for ASS1 was performed using a monoclonal antibody against the C terminus of human ASS (BD 611700, BD Transduction Laboratories, San Jose, CA). Cerebella from mutant and control mice were stained using antibodies directed against Ki-67, GFAP (Dako), MDA (MDA 11-S) (α Diagnostics International, San Antonio, TX), active Caspase-3, Pax6 (R&D Systems, Minneapolis, MN), and Calbindin (Sigma). Controls in the absence of primary antibodies were routinely performed.
To evaluate nitrotyrosine in tissue, fresh collected brains were cut along the midline, submerged in OCT, and frozen in liquid nitrogen, then transferred to the ultra low freezer (−80°C) until sectioning. After blocking, the sections were incubated in the following primary antibodies diluted in 2% GS-PBS (2% goat serum, 0.2% Triton X-100, 0.1% BSA, PBS, pH 7.5) overnight at 4°C: anti-nitrotyrosine (#06-284, Upstate Bio- technology, Lake Placid, NY) diluted 1:200 or anti-nNOS (#sc-648, Santa Cruz Biotechnology, Santa Cruz, CA) diluted 1:200. Sections were washed and incubated with the following secondary antibodies in a 1:1000 dilution in 2% GS-PBS for 30 minutes: for nitrotyrosine, AlexaFluor 594-labeled goat anti-rabbit (#A11012, Invitrogen) diluted and for nNOS, AlexaFluor 488-labeled goat anti-rabbit (#A11034, Invitrogen). Slides were washed and incubated with DAPI (diluted 1:1000). Images were taken on an Olympus FV1000 confocal microscope.
Pathology and Biochemistry
The model characterization (clinical and histopathological) was carried out in the Mutant Mouse Pathology Service located at the MDACC, Smithville. Hematology, clinical chemistry, and urinalysis were performed at the Michale Keeling Center for Comparative Medicine and Research, MDACC, Bastrop. Plasma ammonia levels were quantified with the AA0100 Ammonia Assay Kit (Sigma). Determination of plasma amino acids and ASS liver activity was performed at the BCM Medical Genetics Laboratory (Houston, TX). Gross examination, complete necropsy, tissue collection, and processing were carried out as previously described for the evaluation of mouse mutants.28 Formalin-fixed paraffin-embedded tissue sections were stained with hematoxylin and eosin (H&E), and histological examination performed. We examined the cerebella of mice at time points essential for cerebellar development (P1, P7, P8, P10, P14) and at days P21 and P35.
L-Arginine and Sodium Benzoate Treatment
Homozygous FVB/N-bar/bar and C57BL/6-bar/bar mice were treated daily with intraperitoneal injections of L-arginine at 1 g/kg of body weight (Sigma) and sodium benzoate at 0.1 g/kg of body weight (Fluka BioChemika, Buchs, Switzerland) in PBS beginning at day 3 after birth, as previously described.29
Statistics
Data were expressed as either mean ± SE or as means if SEs were ≤12% of mean. Statistical significance of differences in brain weight and body weight was determined by Student's t-test. Pairwise comparisons of proportions were conducted for survival rates. Other data were evaluated by the analysis of variance (analysis of variance) using StatSimple v2.0.5 (Nidus Technologies, Toronto, Canada) and considering P ≤ 0.05 as statistically significant unless indicated.
Results
Genetic Mapping
To determine the genetic localization of the bar locus, we raised two independent F2 crosses. Genotyping a total of 116 homozygous bar/bar mice from these crosses allowed us to map the bar locus in a 2-Mb interval of proximal mouse chromosome 2, between microsatellite markers D2Mit33 and D2Mit179 (30.5–32.3 Mb), a region which is homologous with human chromosome 9q34.1. A spontaneous recessive mutation (fold), also with small body size and skin phenotype, was localized in the same interval.30 Based on its similar phenotype, we speculated that fold might be another allele of our bar mutation. This was confirmed by a complementation test between a +/fold male and +/bar females, which produced compound heterozygotes with abnormal hair growth and small size. By combining the data for the genetic localizations of fold and bar, we were able to reduce the critical interval to approximately 1 Mb (31.2–32.3 Mb). This interval contains less than 20 genes, including Hmcn2, Ass1, Fubp3, Abl1, and Lamc3 (Ensembl genome browser, July 2009).
Identification of Two Clinical Missense Mutations in the Mouse Ass1 Gene
Ass1 (argininosuccinate synthetase 1) was considered the likely candidate for bar and fold phenotypes based on a previous study demonstrating that a targeted disruption of this gene resulted in perinatal mortality31 and a transgenic mouse model for arginine deficiency that displayed a skin phenotype.32 To confirm the hypothesis that the bar and fold mutant alleles involved the Ass1 gene, Ass1-specific primers were designed and used to amplify mutant and control cDNAs. PCR products amplified from both mutant and control mice were of the expected size (data not shown). However, the cDNA sequence for bar contained a C→T transition in exon 12, leading to an arginine for cysteine (R265C) substitution, whereas the sequence for fold contained a C→T transition in exon 15, resulting in a threonine for isoleucine (T389I) substitution. These missense mutations are identical to two mutations with pathological effects that have been described previously in patients affected by CTLN1. A R265C mutation of the ASS1 gene was recently described in Germany in a patient of Indian ethnicity exhibiting severe clinical course. Interestingly, this mutation was present in a homozygous state, representing a human homolog of our bar mutant mice.26 In addition, a different amino acid substitution was previously described at the same R265 residue in a patient with mild clinical disease in Japan.25 An evolutionary comparison of ASS1 amino acid sequences showed that the R265 residue, localized at the beginning of the β sheet 11 region, is conserved in all eukaryotes and may be involved in ionic interactions.26 The T389I mutation found in fold mice was also identified in Canada in an individual with mild CTLN1.25 The evolutionary comparison of ASS1 amino acid sequences showed that this T389 residue, localized in the α helix 14 region, is conserved in mammals and chicken, and may be involved in subunit interface.26
To further investigate the effect of these mutations, we generated 3D molecular structures of human ASS1 based on the data published by Karlberg et al.33 The structures of wild-type and mutant proteins were built with MacPyMOL (DeLano Scientific LLC, Palo Alto, CA) and modeled to obtain the most stable structure. In wild-type ASS1, R265 is held in place by H-bonds with T210 and with G262 via a water molecule. When R265 is mutagenized to C, the H-bonds are disrupted, the interaction with the β sheets is weakened, and major rearrangements are occurring at the level of random coils (not shown). In wild-type ASS1, T389 presents H-bonds with N393, however, when this residue is mutagenized to an I, the helix is disrupted, impacting in most of the 3D structure (not shown). The two mouse mutations bar and fold, being two new alleles at the Ass1 locus, were then given the new designation Ass1bar and Ass1fold, respectively.
To investigate whether these putative hypomorphic mutations resulted in reduced levels of Ass1 RNA transcripts, we analyzed total liver RNA by quantitative real-time PCR using ASS1 assay on demand (Applied Biosystems, Foster City, CA) and found that no significant differences were detected between affected mutants and control littermates (data not shown). Western blot analysis performed using an ASS1-specific monoclonal antibody in mutant and control liver protein lysates showed no differences in the expected size of the protein (47 kDa) (data not shown). Immunohistochemical localization of ASS1 in different mouse tissues using the same antibody revealed high expression in intestinal villi, liver, kidney tubules, and bone marrow (Figure 1), with no obvious differences between mutant and control mice (not shown).
Figure 1.
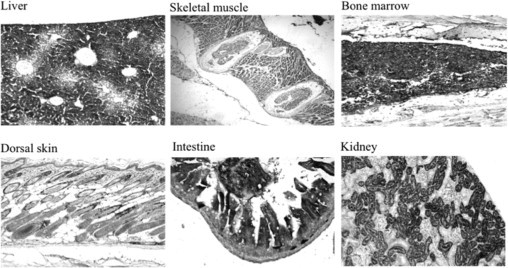
Expression of ASS1 in mouse tissues. Several tissues from wild-type FVB/N adult mice were analyzed by IHC using a monoclonal antibody against the C terminus of human ASS (BD 611700). Note the high expression of ASS1 in liver, intestine (villi), kidney (tubules), and bone marrow. In the skin, ASS1 is expressed in the keratinocytes of the basal epidermis and outer root sheath. All magnifications, ×200.
Phenotype in Mutant Mice Mimic Clinical, Morphological, and Biochemical Features of CTLN1
Homozygous Ass1bar/Ass1bar (bar/bar) and Ass1fold/Ass1fold (fold/fold) mice exhibited variable degrees of growth retardation, lethargy, and alopecia. Growth retardation was evident in bar/bar (FVB and C57BL/6 backgrounds), fold/fold (C57BL/6), and compound heterozygous bar/fold (C57BL/6) mutant mice shortly after birth; however, the reduction in body size was more prominent in bar/bar than fold/fold or bar/fold mutant mice (Figure 2, A and B). The few FVB/N-bar/bar mice that survived after weaning exhibited reduction in body size throughout their short lifespan (Figure 2B). Conversely, surviving fold/fold and bar/fold mice are almost indistinguishable from wild-type littermates after weaning (Figure 2B). Survival curves of mutant mice also indicated marked differences between the three mutant genotypes, for example, bar/bar exhibited the highest death rates, followed by fold/fold and bar/fold (Figure 2C). Interestingly, survival curves comparing FVB/N-bar/bar (N5) and C57BL/6-bar/bar (N4) at postnatal day 12 (P12) showed significant differences (P = 0.07) in death rate, suggesting the influence of genetic background (Figure 2C). The oldest mutant mouse in our records was a C57BL/6-bar/fold female that lived for 7 months. No differences in death rates were observed between female and male mutant mice. Tremor and unstable gait were observed in all mutant genotypes; however, these observations were more frequent in FVB/N-bar/bar mice. Circling behavior was occasionally observed only in FVB/N-bar/bar mice after P15, but not in C57BL/6-bar/bar or C57BL/6-fold/fold mice.
Figure 2.
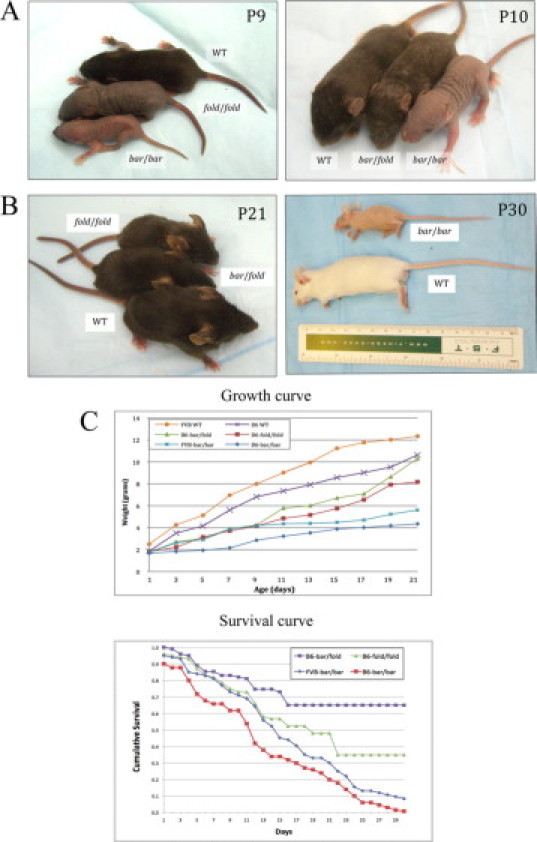
Homozygous Ass1bar and Ass1fold and compound heterozygous mice exhibit variable degrees of growth retardation and alopecia. A, Left: Growth retardation and alopecia at P9 in Ass1bar/Ass1bar (bottom) and Ass1fold/Ass1fold (middle) compared with control littermate (top). Right: Growth retardation and alopecia at P10 in Ass1bar/Ass1bar (right) and Ass1bar/Ass1fold (middle) compared with littermate control (left) (all mice on C57BL/6 background). B, Left: At P21, Ass1fold/Ass1fold (top) and Ass1bar/Ass1fold (middle) are almost the size of wild-type littermates (bottom) and exhibit a full coat of pelage, albeit sparse. Right: An adult FVB/N-bar/bar mouse exhibiting substantial reduction in body size and generalized alopecia when compared with littermate control (bottom). C, Top: Mean weight values of FVB-+/+ (n = 15), FVB-bar/bar (n = 15), C57BL/6-+/+ (n = 12), C57BL/6-bar/bar (n = 10), C57BL/6-fold/fold (n = 12), and C57BL/6-bar/fold (n = 10), showing growth retardation in mutant mice during the first 3 weeks of life, particularly pronounced in bar/bar mice. P < 0.0001 for C57BL/6-+/+ vs. C57BL/6-bar/bar; P = 0.0002 for FVB-+/+ vs. FVB-bar/bar (pairwise comparisons using t-tests). Bottom: Survival curves over the first 30 days of life show differences in death rates between FVB-bar/bar (n = 45), C57BL/6-bar/bar (n = 42), C57BL/6-fold/fold (n = 22), and C57BL/6-bar/fold (n = 12) mutant mice. At P30, differences between bar/bar and bar/fold genotypes were highly statistically significant (P < 0.001).
Plasma amino acid analysis from bar/bar, fold/fold, and bar/fold mice between P14 and P21 showed a 10- to 40-fold increase in the levels of citrulline, and a 1.5- to threefold increase in the plasma levels of many amino acids, including glutamine, cystine, methionine, and lysine. On the other hand, arginine, glutamic acid, leucine, and ornithine levels were decreased (0.6 to 0.7-fold; P < 0.1). Plasma ammonia concentration at P14 was elevated in the three mutant genotypes, and, interestingly, the levels of citrullinemia and hyperammonemia corresponded well with the severity of the gross phenotype. For example, FVB/N-bar/bar and C57BL/6-bar/bar showed the highest levels of plasma ammonia and citrulline, followed by C57BL/6-fold/fold, and C57BL/6-bar/fold mice (Table 1).15,21,25,34 We could confirm that liver ASS activity was severely reduced in the three mutant genotypes (biochemical analysis performed at BCM Medical Genetics Laboratories, Houston, TX). Table 1 shows values for plasma ammonia, citrulline, and arginine levels and ASS liver activity in bar/bar, fold/fold, and bar/fold mice and littermate controls, including a comparison with biochemical data from CTLN1 patients.15,21,25,34
Table 1.
Plasma Ammonia, Citrulline, and Arginine Levels and ASS Liver Activity in bar/bar, fold/fold, and bar/fold Mice Compared with Data from CTLN1 Human Patients
| Genotype | Ammonia (μg/dl) | Citrulline (μmol/L) | Arginine (μmol/L) | ASS Liver activity (μmol/min/g) |
|---|---|---|---|---|
| FVB/N-bar/bar | 530 ± 27 | 5790 ± 841 | 97 ± 11 | 0.06 ± 0.02 |
| (n = 4, P14) | (n = 4, P14–P21) | (n = 4, P14–P21) | (n = 3, P20) | |
| FVB/N-+/+ | 201 ± 37 | 145 ± 27 | 209 ± 49 | 3.73 ± 2.39 |
| (n = 4, P14) | (n = 4, P14–P21) | (n = 4, P14-P21) | (n = 3, P20) | |
| C57BL/6-bar/bar | 556 ± 21 | N/A | N/A | 0.03 ± 0.03 |
| (n = 3, P14) | (n = 3, P21) | |||
| C57BL/6-fold/fold | 462 ± 12 | 2941 ± 1347 | 171 ± 68 | 0.12 ± 0.06 |
| (n = 4, P14) | (n = 4, P14–P21) | (n = 4, P14–P21) | (n = 3, P21) | |
| C57BL/6-bar/fold | 356 ± 22 | 2076 ± 192 | 229 ± 41 | 0.12 ± 0.06 |
| (n = 3, P14) | (n = 3, P14–P21) | (n = 3, P14–P21) | (n = 3, P21) | |
| C57BL/6-+/+ | 193 ± 35 | 106 ± 6 | 271 ± 51 | 1.23 ± 0.75 |
| (n = 3, P14) | (n = 3, P14-P21) | (n = 3, P14–P21) | (n = 3, P21) | |
| Reference values for human CTLN1 patients | 18–2900 | 1685 ± 1325 (n = 24) | 71 ± 38 (n = 24) | 0.02–0.8 |
| (control range 10–60) | (control range 10–50) | (control range 20–149) | (control range 0.8–3.8) | |
| (Ref. 25) | (Refs. 15, 25) | (Refs. 15, 21) | (Ref. 34) |
Values are mean ± SD using data from 3 or 4 mice of each genotype. Number and age of mice are presented in parentheses. Plasma was prepared using ammonia-free heparin. Liver samples were removed from mice at necropsy and stored at −80°C until analysis. μg/dl: Microgram of ammonia per deciliter of plasma; μmol/L: micromoles of amino acid per L of plasma; μmol/min/g: micromoles of final reaction product per minute and per gram of tissue. Plasma amino acid analysis and liver ASS enzymatic activity were performed at BCM Medical Genetics Laboratories, Houston, TX. Reference values for human CTLN1 patients are from the bibliographic references in parentheses.
The skin phenotype of bar/bar and fold/fold mutant mice became evident around P6. At this age, hair shafts emerged from the epidermis in wild-type littermates but not in mutant mice. FVB/N-bar/bar and C57BL/6-bar/bar mice exhibited the strongest skin phenotype, with generalized alopecia during the first three weeks of life. The small percentage of FVB/N-bar/bar mice that survived beyond 21 days developed a thin hair coat (not shown). On the other hand, C57BL/6-fold/fold and C57BL/6-bar/fold mutant mice developed a first hair coat at P12 and P9, respectively, and by weaning both mutant genotypes exhibited an almost normal hair coat (Figure 2, A and B). In addition, when compared with bar/bar, the dorsal skin of fold/fold mice appeared characteristically wrinkled. Histologically, the skin in both mutations from P7 through P21 and all genetic backgrounds was characterized by epidermal hyperplasia, hyperkeratosis and follicular dystrophy (Figure 3A). IHC analysis of dorsal skin from 15-day-old FVB/N-bar/bar mice showed overexpression of basal keratins, K5 (not shown), and K14, as well as abnormal expression of K6 in the interfollicular epidermis (Figure 3, B and C), suggesting abnormal epidermal differentiation. Expression of early suprabasal markers, K1 and K10, did not differ between mutant mice and littermate controls (data not shown). Abnormal expression of filaggrin and desmoglein was also observed in mutant dorsal skin (Figure 3, D and E). Desynchronization of the growth cycle of hair follicles was also found in both mutations (data not shown).
Figure 3.
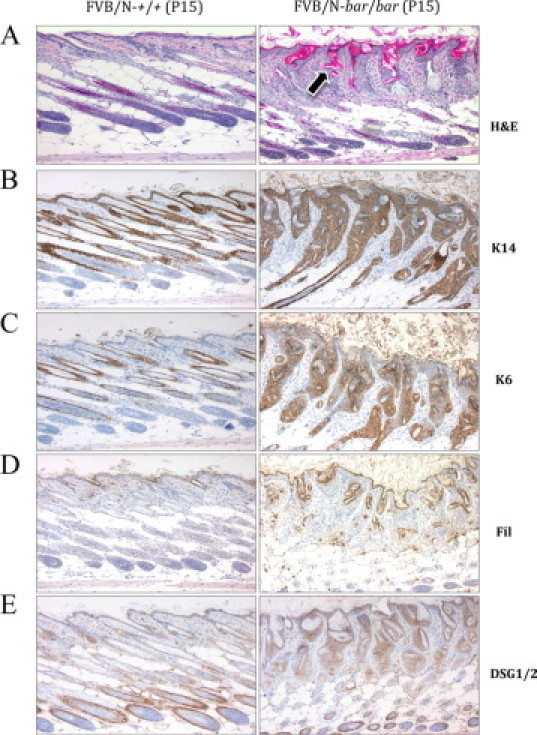
Histology and immunohistochemistry of FVB/N-Ass1bar/Ass1bar mouse epidermis at P15. A: Hematoxylin-eosin (H&E) staining of normal (left) and mutant (right) dorsal skin. Although hair follicles are in anagen, hair shafts do not penetrate the epidermis and keratin is accumulated inside the dilated follicular infundibulum (arrow). Mutant skin is severely dysplastic, markedly hyperkeratotic, and lacks a normal hypodermal fat layer. B: Note the overexpression of basal cell marker K14 in mutant epidermis. C: Note that in back skin from mutant mice, K6 expression is present in the interfollicular epidermis, a feature not found in age- and sex-matched littermate controls. D and E: Note the marked increase in the expression of the late marker proffilagrin/filaggrin and adhesion molecule desmoglein in mutant epidermis. Immunohistochemistry was performed with specific antibodies as described in Materials and Methods. All magnifications, ×100.
At P14, the brain weights of bar/bar, fold/fold, and bar/fold mutant mice were reduced by 45%, 10%, and 6%, respectively, as compared with sex- and age-matched littermate controls [FVB/N-+/+: 500 ± 14.5 mg; FVB/N-bar/bar: 274 ± 20 mg; C57BL/6-+/+: 407 ± 7.6 mg; C57BL/6-fold/fold: 370 ± 13.2 mg; C57BL/6-bar/fold: 389 ± 33.2 mg (n = 3 for all strains)]. Despite the decrease in brain mass, the ratio of brain weight to body weight was increased in all 3 mutant strains as compared with littermate controls [FVB/N-+/+: 49 ± 4; FVB/N-bar/bar: 76 ± 20; C57BL/6-+/+: 58 ± 1; C57BL/6-fold/fold: 69 ± 11; C57BL/6-bar/fold: 64 ± 10 (n = 3 for all strains)]. In normal mice, this ratio decreases dramatically during the first two weeks of postnatal development.35 The higher ratios exhibited by mutant mice are likely due to their growth retardation.
Slower Rate of Migration of Granule Cells in the Cerebellum of Mutant Mice
Given that substantial cerebellar development in the mouse occurs postnatally, detailed histological examination was performed between days P7 and P14 (peak of granule cell migration). Postnatal migration of granule cells from the EGL to the IGL was essentially complete in wild-type littermates by P14; however, granule cell migration appeared to be delayed by several days in both genotypes and was more pronounced in bar/bar mice. At P7, the EGL and IGL in bar/bar mice displayed reduced cellularity, a poorly defined molecular layer (ML), and slightly reduced levels of EGL proliferation, as measured by Ki-67 immunostaining (Figure 4A). Increased expression of activated caspase-3 at P7 in the EGL and IGL of bar/bar mice indicated an increase in apoptosis (Figure 4B) that may have caused the hypocellularity of the IGL. Immunostaining with Pax6, a granule cell marker, at P14 showed a thicker EGL in the mutant cerebellum (Figure 4C), suggesting decreased cell migration to the IGL. Around P21, bar and fold mutant cerebella from surviving mice had preserved foliation and a normal arrangement of EGL, ML, Purkinje cell layer, and IGL (data not shown).
Figure 4.
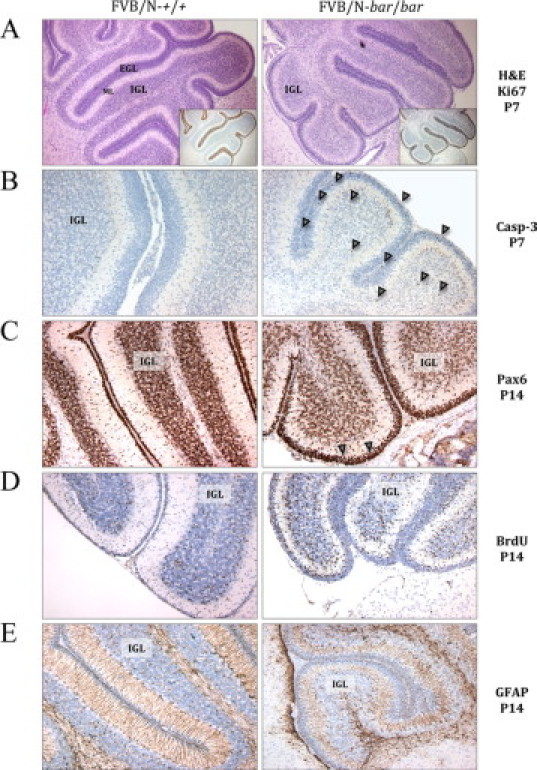
Morphological changes in the cerebellum of FVB/N-Ass1bar/Ass1bar mice at P7 and P14. A: H&E and Ki-67 immunostaining (inset) of a sagittal section of normal (left) and mutant (right) cerebella. Note the reduced cellularity of the IGL and poorly defined ML in bar/bar mice at P7 compared with controls. B: Activated caspase-3 immunostaining at P7 showing increased apoptosis in the EGL and IGL of bar/bar mice (arrowheads). C: At P14, Pax6 immunostaining shows a thicker EGL in bar/bar mutant mice compared with controls (arrowheads). D: Seventy-two hours after a single BrdU injection, there are still many granule cells labeled in the EGL or migrating through the ML in bar/bar mutant mice (P14). E: GFAP immunostaining shows disorganization, low density, and shortening of Bergmann glial fibers in the cerebellum of bar/bar mice at P14. Immunohistochemistry was performed with specific antibodies as described in Materials and Methods. Magnifications, ×40 (A) and × 100 (B–E). IGL indicates internal granule layer; EGL, external granule layer; ML, molecular layer.
To study in vivo granule cell migration, we performed pulse labeling of migrating cells with BrdU. At 72 hours after a single BrdU injection, few labeled cells were found in the EGL of wild-type littermates at P14, whereas many granule cells were labeled in both the EGL and the ML in bar/bar mutant mice (Figure 4D). IHC analysis of mutant cerebella using GFAP-specific antibody showed disorganization and low density and shortening of Bergmann glial fibers in the cerebellum of bar/bar mice (up to P14) (Figure 4E). These results suggest that granule cells migrate more slowly in the hyperammonemic brain of mutant mice and that this defect might be secondary to disorganized Bergmann glial fibers, essential for neuronal migration during pre- and postnatal cerebellar development.36
Nitrative Stress Is Significantly Decreased in the Cerebellum of Mutant Mice
Tyrosine nitration is one of the earliest markers found in brains from people affected with Alzheimer disease and in degenerating neurons in amyotrophic lateral sclerosis patients.37,38 The association of specific oxidative damage with sites of injury in different types of neurodegeneration could signify a common underlying mechanism or simply reflect secondary epiphenomena. Nitrotyrosine is formed in proteins by the action of a nitrating agent originated from superoxide anion and NO.39 Thus, if the mutant mice display an increase in these radicals (assuming that antioxidant defenses remained constant), an increase in nitrotyrosine should be observed. To this end, we performed IHC to evaluate nitrotyrosine in the brains of bar/bar and fold/fold mice and littermate controls at P8. Control mice showed nitrotyrosine staining in the EGL and IGL of the cerebellum suggesting a background normal level of nitrative stress during postnatal development. Conversely, mutant mice did not show a significant nitrotyrosine staining in any of the regions of the cerebellum indicating that nitration of proteins has been halted (Figure 5A). To exclude the possibility that proteins in mutant brains were resistant to nitration, we incubated control and mutant brain slices with tetranitromethane (to induce chemical nitration). Subsequent immunostaining for nitrotyrosine revealed no differences between mutant and control brains, thus confirming that the mutant brains were not resistant to nitration. These results suggested that in mutant mice either the expression of neuronal NO synthase (nNOS or NOS1) in the brain was decreased or the production of NO was decreased without significant changes in enzyme expression. Immunoassaying for nNOS indicated that fold/fold cerebella had 60% to 70% of control values (P < 0.05; Figure 5B). Although statistically significant, this amount of enzyme cannot account for the negligible amount of nitrotyrosine observed in mutant cerebella. Of note, the immunostaining for nitrotyrosine followed the distribution of NOS1 in control cerebellum, whereas nitrated proteins in mutant mice followed a different pattern than that of NOS1 distribution (Figure 5B). Finally, we performed IHC at P14 to evaluate malondialdehyde (MDA), a marker of lipid peroxidation, and found increased staining in the EGL of mutant cerebella, compared to controls (Figure 5C).
Figure 5.
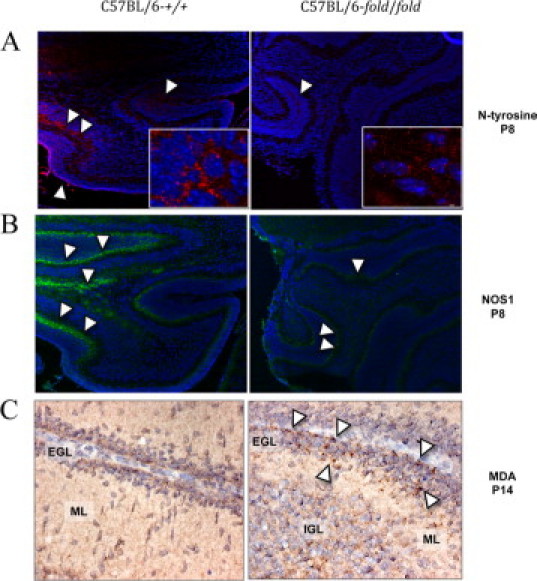
Nitrotyrosine and NOS1 in cerebella from C57BL/6-Ass1fold/Ass1fold mice at P8 and MDA at P14. A: Nitrotyrosine immunostaining (in red) of a sagittal section of normal (left) and mutant (right) cerebella shown at ×100 and ×400 (inset). Nuclei are shown in blue. Arrowheads point at areas with nitrotyrosine in the EGL and IGL. B: NOS1 immunostaining (in green) shown at ×100. Arrowheads point at areas with positive staining. C: MDA immunostaining at P14 showing increased expression in the EGL of fold/fold cerebellum (arrowheads) at ×400. Immunohistochemistry was performed with specific antibodies as described in Materials and Methods (magnifications, ×100 and ×400). IGL indicates internal granule layer; EGL, external granule layer; ML, molecular layer; NOS1, neuronal NO synthase; MDA, malondialdehyde.
Successful Treatment of Affected Mice with L-Arginine and Sodium Benzoate
When treated daily with intraperitoneal injections of sodium benzoate (0.1 g/kg body weight) and L-arginine (1g/kg body weight), a standard therapy for CTLN1 patients, the neonatal crisis in bar/bar and fold/fold homozygous mice could be circumvented. In a few days, all aspects of the mutant phenotype were rescued in treated preweaned mice. Twelve hours after the first injection, mutant mice appeared more active and no tremors or ataxia were observed. After six weeks of daily injections, surviving FVB/N-bar/bar mice, homozygous for the more severe of the mutant alleles, exhibited a full hair coat, albeit sparse (Figure 6A). We also assessed cerebellar morphology in treated mice and found that, at P14, the defective granule cell migration in mutant cerebella appeared to be corrected. Instead of the thick EGL, poorly defined ML, and reduced cellularity of the IGL seen in cerebella from untreated mutant mice, treated mutant mice cerebella had a thin EGL (with slightly increased proliferation), well-defined ML, and almost normal cellularity of the IGL (Figure 6B). Protein restriction was not investigated because all studies were carried out using preweaned mice.
Figure 6.
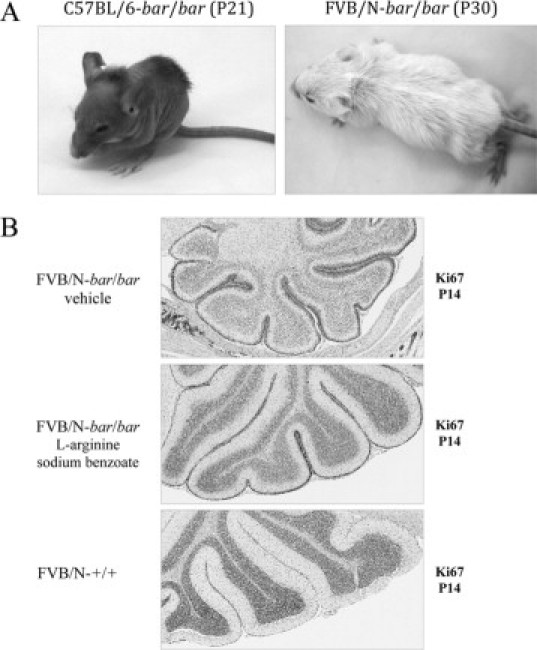
Improvement in mutant mice treated with sodium benzoate and L-arginine. A: All bar/bar mice, carrying the more severe allele, circumvented the neonatal crisis when treated with daily intraperitoneal injections of sodium benzoate (0.1 g/kg body weight) and L-arginine (1 g/kg body weight). Without treatment, 50% of homozygous bar/bar mice die before day 12. After three weeks of daily injections, mutant mice started to grow hair (left), and some mice exhibited a full hair coat (although sparse) after four weeks of treatment (right). B: Cerebellar morphology in treated mutant mice appeared to be corrected at P14. Top: Cerebellum from untreated bar/bar mouse showing thick EGL, poorly defined ML and reduced cellularity of the IGL. Middle: Treated bar/bar mouse showing thin EGL (with increased proliferation of granule cells when compared with wild type), well-defined ML, and almost normal cellularity of the IGL. Bottom: Cerebellum from wild-type mouse. Ki-67 immunohistochemistry was performed with specific antibodies as described in Materials and Methods. Magnifications, ×40.
Discussion
To improve medical management of human patients with CTLN1, a greater understanding of the following aspects of the disease is essential: (i) pathophysiology of the neurological damage; (ii) correlation between specific ASS1 mutations and the severity of disease; (iii) influence of genetic background and environment; and (iv) novel therapeutic approaches. Additionally, because expanded newborn screenings are now detecting CTNL1 patients with modest elevation in citrulline, it is also important to establish a way to manage these cases.34 Nevertheless, the insufficiency of animal models that reliably reproduce the pathological alterations of human CTLN1 has seriously hampered the ability to generate novel discoveries in these areas.
We introduce here two independent hypomorphic mouse mutations affecting the Ass1 gene and present the first comprehensive pathological description of a laboratory animal model of CTLN1. As in humans with ASS1 mutations, neonatal hyperammonemic encephalopathy, lethargy, tremors, and decreased survival are periodically observed in all of the Ass1 hypomorphic allele combinations during the first weeks of age. Brains obtained at P14 from bar/bar mice are about 60% of the normal size (about the size of a 6-day-old wild-type brain). Histologically, this phenotype is associated with a reduced rate of granule cell migration secondary to abnormal Bergmann glia. At P14, the thickness of the EGL is greater in mutant mice when compared with wild-type littermates and is always associated with increased numbers of apoptotic granule cells, poorly developed Bergmann glial fibers, and hypocellularity of the IGL. Because Bergmann fibers are essential for neuronal migration during cerebellar development,36 we speculate that the presence of truncated fibers that do not extend all of the way through the IGL might be the cause of the granule cell migration defect observed in the hyperammonemic brain of mutant mice. Although several other spontaneous and targeted mouse mutations have abnormal neuronal migration,40 few existing mouse models provide the ability to study defective neuronal migration in a hyperammonemic brain. In agreement with studies using other rodent models,41 the degree of cerebellar developmental delay and severity of histopathological findings in bar/bar, fold/fold, and bar/fold mutant mice correlate with the levels of hyperammonemia. However, it will be critical to determine whether the high levels of citrulline also play a role in the development of encephalopathy in our mouse model.42
The mechanism of cerebral damage in CTLN1 patients is not well understood. Recently, ammonia-associated neurotoxicity and enhanced oxidative stress during metabolic decompensation have been suggested to play a role in the pathogenesis of CTLN1.43 Additionally, citrulline and ammonia accumulation may be responsible for a decrease in the antioxidant capacity in the rat brain in vitro.42 After studying children with CTLN1, Lücke et al proposed that increased levels of the potent nNOS inhibitor asymmetric dimethylarginine (ADMA) may lead to disturbed NO metabolism and/or enhanced nitrative stress in neurons.43 However, a clear role for oxidative and nitrative stress in CTLN1 has not yet been elucidated.44 Few reports found increased biomarkers for oxidative stress associated with sustained hypercitrullinemia,45 or decreased total antioxidant capacity in brain with no changes in antioxidant enzyme activities or MDA formation.42
In our mouse model, the higher content of MDA-reactive material found in mutant cerebella compared to controls can be linked to either increased oxidative stress, a decreased capacity for glutathione peroxidase/glutathione reductase to catabolyze lipid hydroperoxides, or a combination of both processes. It is tempting to suggest that a lower antioxidant capacity could be the result of a lower NADPH availability to sustain glutathione redox cycling.46,47 Nitrative stress (evaluated as nitrotyrosine) in cerebella from mutant mice was significantly decreased when compared to controls (40% reduction in the less severe fold/fold mutants). The decreased protein nitration could result from the lower nNOS expression found in the cerebella of mutant mice and/or to other effects, not related directly to the NOS protein content, but rather to metabolite control of enzymatic activity within the tissue. In this regard, if we assume that the plasma concentration of citrulline in mutant mice is equivalent to its intracellular concentration, hypercitrullinemia may lead to inhibition of dimethylarginine dimethylaminohydrolase (DDAH) (enzyme that hydrolyzes the potent nNOS inhibitor ADMA),48 resulting in an increase in ADMA. This compound, in turn, would inhibit NOS,49 decreasing NO production and the ensuing NO-derived nitrative stress. Given that the cessation of granule cell proliferation and the differentiation of Bergmann glia is inhibited by NOS inhibitors or NO scavengers, the lower NO production would ultimately suggest that endogenous NO can be a signal for the differentiation of granule cells and Bergmann glia in cerebellar cortical development.50 However, this hypothesis has to be proven by future studies.
The influence of genetic background on the phenotype of transgenic and mutant mice is well recognized, particularly in neurological and behavioral studies.51 To determine whether the genetic background modified the phenotype of our model, we performed our studies on the bar mutation using congenic FVB/N and C57BL/6 strains. As reported for the Spfash mouse,52 the interaction between the bar mutation and genetic background revealed different phenotypes; for example, survival rate was lower in C57BL/6 than FVB/N, and circling behavior was only observed in FVB/N background. These results highlight the importance of the elucidation of genetic modifiers to improve the management of CTLN1.
The remarkable growth retardation observed in Ass1 hypomorphic mice is consistent with a previous report of growth arrest in rapidly growing suckling rodents with arginine deficiency.53 Likewise, given that the skin participates in the synthesis of arginine-rich proteins (eg, trichohyalin and filaggrin), the skin phenotype in the Ass1 hypomorphic mice may result, at least partially, from moderate arginine deficiency. This hypothesis is supported by similar skin phenotypes in an arginine-deficient transgenic mouse model,32 ornithine transcarbamylase–deficient mice,53 and some CTLN1 patients.54 Additional studies will be necessary to confirm this hypothesis and to reveal the mechanism leading to abnormal keratinocyte differentiation in the mutant epidermis.
In summary, we present here a new animal model for studying CTLN1 where mice carrying the hypomorphic mutations bar and fold replicate the pathology of the human disease. In addition, the disease severity, particularly in terms of survival rate, developmental delay, and neurological phenotype, is unique in each of the hypomorphic mutations. These differences allowed us to reproduce phenotypic variations using homozygous and compound heterozygous combinations that create a spectrum of severe (bar/bar), intermediate (fold/fold), and mild (bar/fold) phenotypes. The fact that the compound heterozygotes, carrying one severe allele (bar) and one mild allele (fold), unexpectedly exhibited a milder phenotype (including residual activity of liver ASS and less pronounced plasma ammonia levels) than mice carrying two copies of the mild allele (fold/fold) warrants further investigation of the molecular interactions between these ASS1 mutant proteins. Our results show that a therapeutic effect can be obtained in our mouse model of CTLN1 with L-arginine supplementation and removal of nitrogen. Thus, our animal model provides a new tool for the development of alternative and more effective therapies for CTLN1 and other hyperammonemic encephalopathies and, for the first time, provides a method for studying the early consequences of CTLN1. Further pathological and behavioral description (eg, learning and memory) of this hypomorphic mouse model of CTLN1 may provide clues to the processes underlying the neurological symptoms in humans, including mental retardation.
Acknowledgements
We thank the Research Animal Support Facility-Smithville for their assistance with the maintenance of the mouse strains. We also thank Kevin Lin for statistical analyses, the Histology and Tissue Processing Facility Core for the IHC, and the Molecular Biology Facility Core for DNA sequencing. We are grateful to Brenda Webb (Michale E. Keeling Center) for her excellent technical skills with blood sampling. We thank Qin Sun (BCM Medical Genetics Laboratories) for the plasma amino acid analysis and ASS liver activity assays.
Footnotes
Supported by National Institutes of Health grant CA90922 (C.J.C.); Department of Health and Human Services/National Cancer Institute grants P30 CA016672 (F.B. and D.F. K.) and P30 ES007784 (I.G.C.); and funding from Autism Speaks (C.G.).
References
- 1.Mian A, Lee B. Urea-cycle disorders as a paradigm for inborn errors of hepatocyte metabolism. Trends Mol Med. 2002;8:583–589. doi: 10.1016/s1471-4914(02)02437-1. [DOI] [PubMed] [Google Scholar]
- 2.Shih VE. Congenital hyperammonemic syndromes. Clin Perinatol. 1976;3:3–14. [PubMed] [Google Scholar]
- 3.Scott CR, Teng CC, Goodman SI, Greensher A, Mace JW. X-linked transmission of ornithine-transcarbamylase deficiency. Lancet. 1972;2:1148. doi: 10.1016/s0140-6736(72)92756-0. [DOI] [PubMed] [Google Scholar]
- 4.Brusilow SW, Maestri NE. Urea cycle disorders: diagnosis, pathophysiology, and therapy. Adv Pediatr. 1996;43:127–170. [PubMed] [Google Scholar]
- 5.Smith W, Kishnani PS, Lee B, Singh RH, Rhead WJ, Sniderman King L, Smith M, Summar M. Urea cycle disorders: clinical presentation outside the newborn period. Crit Care Clin. 2005;21:S9–S17. doi: 10.1016/j.ccc.2005.05.007. [DOI] [PubMed] [Google Scholar]
- 6.Uchino T, Endo F, Matsuda I. Neurodevelopmental outcome of long-term therapy of urea cycle disorders in Japan. J Inherit Metab Dis. 1998;21(Suppl 1):151–159. doi: 10.1023/a:1005374027693. [DOI] [PubMed] [Google Scholar]
- 7.Wilcken B. Problems in the management of urea cycle disorders. Mol Genet Metab. 2004;81(Suppl 1):S86–S91. doi: 10.1016/j.ymgme.2003.10.016. [DOI] [PubMed] [Google Scholar]
- 8.Deignan JL, Cederbaum SD, Grody WW. Contrasting features of urea cycle disorders in human patients and knockout mouse models. Mol Genet Metab. 2008;93:7–14. doi: 10.1016/j.ymgme.2007.08.123. [DOI] [PMC free article] [PubMed] [Google Scholar]
- 9.McMurray WC, Rathbun JC, Mohyuddin F, Koegler SJ. Citrullinuria. Pediatrics. 1963;32:347–357. [PubMed] [Google Scholar]
- 10.Scott-Emuakpor A, Higgins JV, Kohrman AF. Citrullinemia: a new case, with implications concerning adaptation to defective urea synthesis. Pediatr Res. 1972;6:626–633. [PubMed] [Google Scholar]
- 11.Walser M, Batshaw M, Sherwood G, Robinson B, Brusilow S. Nitrogen metabolism in neonatal citrullinaemia. Clin Sci Mol Med. 1977;53:173–181. doi: 10.1042/cs0530173. [DOI] [PubMed] [Google Scholar]
- 12.Haberle J, Pauli S, Schmidt E, Schulze-Eilfing B, Berning C, Koch HG. Mild citrullinemia in Caucasians is an allelic variant of argininosuccinate synthetase deficiency (citrullinemia type 1) Mol Genet Metab. 2003;80:302–306. doi: 10.1016/j.ymgme.2003.08.002. [DOI] [PubMed] [Google Scholar]
- 13.Kim IS, Ki CS, Kim JW, Lee M, Jin DK, Lee SY. Characterization of late-onset citrullinemia 1 in a Korean patient: confirmation by argininosuccinate synthetase gene mutation analysis. J Biochem Mol Biol. 2006;39:400–405. doi: 10.5483/bmbrep.2006.39.4.400. [DOI] [PubMed] [Google Scholar]
- 14.Brusilow SW, Horwich A. Urea cycle enzymes. In: Scriver CR, Sly WS, editors. The Metabolic and Molecular Bases of Inherited Disease. McGraw-Hill Medical Publication division; New York: 2001. pp. 1908–1964. [Google Scholar]
- 15.Tuchman M, Lee B, Lichter-Konecki U, Summar ML, Yudkoff M, Cederbaum SD, Kerr DS, Diaz GA, Seashore MR, Lee HS, McCarter RJ, Krischer JP, Batshaw ML. Cross-sectional multicenter study of patients with urea cycle disorders in the United States. Mol Genet Metab. 2008;94:397–402. doi: 10.1016/j.ymgme.2008.05.004. [DOI] [PMC free article] [PubMed] [Google Scholar]
- 16.Summar ML, Dobbelaere D, Brusilow S, Lee B. Diagnosis, symptoms, frequency and mortality of 260 patients with urea cycle disorders from a 21-year, multicentre study of acute hyperammonaemic episodes. Acta Paediatr. 2008;97:1420–1425. doi: 10.1111/j.1651-2227.2008.00952.x. [DOI] [PMC free article] [PubMed] [Google Scholar]
- 17.Whelan DT, Brusso T, Spate M. Citrullinemia: phenotypic variations. Pediatrics. 1976;57:935–941. [PubMed] [Google Scholar]
- 18.Beaudet AL, O'Brien WE, Bock HG, Freytag SO, Su TS. The human argininosuccinate synthetase locus and citrullinemia. Adv Hum Genet. 1986;15:161–196. doi: 10.1007/978-1-4615-8356-1_3. 291–162. [DOI] [PubMed] [Google Scholar]
- 19.Bachmann C. Long-term outcome of patients with urea cycle disorders and the question of neonatal screening. Eur J Pediatr. 2003;162(Suppl 1):S29–S33. doi: 10.1007/s00431-003-1347-z. [DOI] [PubMed] [Google Scholar]
- 20.Scaglia F, Brunetti-Pierri N, Kleppe S, Marini J, Carter S, Garlick P, Jahoor F, O'Brien W, Lee B. Clinical consequences of urea cycle enzyme deficiencies and potential links to arginine and nitric oxide metabolism. J Nutr. 2004;134:2775S–2782S. doi: 10.1093/jn/134.10.2775S. discussion 2796S–2797S. [DOI] [PubMed] [Google Scholar]
- 21.Singh RH, Rhead WJ, Smith W, Lee B, King LS, Summar M. Nutritional management of urea cycle disorders. Crit Care Clin. 2005;21:S27–S35. doi: 10.1016/j.ccc.2005.08.003. [DOI] [PubMed] [Google Scholar]
- 22.Das AM, Illsinger S, Hartmann H, Oehler K, Bohnhorst B, Kuehn-Velten N, Luecke T. Prenatal benzoate treatment in urea cycle defects. Arch Dis Child Fetal Neonatal Ed. 2009;94:F216–F217. doi: 10.1136/adc.2008.144824. [DOI] [PubMed] [Google Scholar]
- 23.Kobayashi K, Kakinoki H, Fukushige T, Shaheen N, Terazono H, Saheki T. Nature and frequency of mutations in the argininosuccinate synthetase gene that cause classical citrullinemia. Hum Genet. 1995;96:454–463. doi: 10.1007/BF00191806. [DOI] [PubMed] [Google Scholar]
- 24.Kakinoki H, Kobayashi K, Terazono H, Nagata Y, Saheki T. Mutations and DNA diagnoses of classical citrullinemia. Hum Mutat. 1997;9:250–259. doi: 10.1002/(SICI)1098-1004(1997)9:3<250::AID-HUMU6>3.0.CO;2-B. [DOI] [PubMed] [Google Scholar]
- 25.Gao HZ, Kobayashi K, Tabata A, Tsuge H, Iijima M, Yasuda T, Kalkanoglu HS, Dursun A, Tokatli A, Coskun T, Trefz FK, Skladal D, Mandel H, Seidel J, Kodama S, Shirane S, Ichida T, Makino S, Yoshino M, Kang JH, Mizuguchi M, Barshop BA, Fuchinoue S, Seneca S, Zeesman S, Knerr I, Rodes M, Wasant P, Yoshida I, De Meirleir L, Abdul Jalil M, Begum L, Horiuchi M, Katunuma N, Nakagawa S, Saheki T. Identification of 16 novel mutations in the argininosuccinate synthetase gene and genotype-phenotype correlation in 38 classical citrullinemia patients. Hum Mutat. 2003;22:24–34. doi: 10.1002/humu.10230. [DOI] [PubMed] [Google Scholar]
- 26.Engel K, Hohne W, Haberle J. Mutations and polymorphisms in the human argininosuccinate synthetase (ASS1) gene. Hum Mutat. 2008;30:300–307. doi: 10.1002/humu.20847. [DOI] [PubMed] [Google Scholar]
- 27.Berning C, Bieger I, Pauli S, Vermeulen T, Vogl T, Rummel T, Hohne W, Koch HG, Rolinski B, Gempel K, Haberle J. Investigation of citrullinemia type I variants by in vitro expression studies. Hum Mutat. 2009;29:1222–1227. doi: 10.1002/humu.20784. [DOI] [PubMed] [Google Scholar]
- 28.Sundberg JBD. Systematic Approach to Evaluation of Mouse Mutations. CRC Press; Boca Raton, FL: 2001. [Google Scholar]
- 29.Ye X, Whiteman B, Jerebtsova M, Batshaw ML. Correction of argininosuccinate synthetase (AS) deficiency in a murine model of citrullinemia with recombinant adenovirus carrying human AS cDNA. Gene Ther. 2000;7:1777–1782. doi: 10.1038/sj.gt.3301303. [DOI] [PubMed] [Google Scholar]
- 30.Harris BW-BP, Johnson K, Bronson R. Follicular dystrophy: a new skin and hair mutation on mouse Chromosome 2. The Jackson Laboratory; 2007. [Google Scholar]
- 31.Patejunas G, Bradley A, Beaudet AL, O'Brien WE. Generation of a mouse model for citrullinemia by targeted disruption of the argininosuccinate synthetase gene. Somat Cell Mol Genet. 1994;20:55–60. doi: 10.1007/BF02257486. [DOI] [PubMed] [Google Scholar]
- 32.de Jonge WJ, Hallemeesch MM, Kwikkers KL, Ruijter JM, de Gier-de Vries C, van Roon MA, Meijer AJ, Marescau B, de Deyn PP, Deutz NE, Lamers WH. Overexpression of arginase I in enterocytes of transgenic mice elicits a selective arginine deficiency and affects skin, muscle, and lymphoid development. Am J Clin Nutr. 2002;76:128–140. doi: 10.1093/ajcn/76.1.128. [DOI] [PubMed] [Google Scholar]
- 33.Karlberg T, Collins R, van den Berg S, Flores A, Hammarstrom M, Hogbom M, Holmberg Schiavone L, Uppenberg J. Structure of human argininosuccinate synthetase. Acta Crystallogr D Biol Crystallogr. 2008;64:279–286. doi: 10.1107/S0907444907067455. [DOI] [PubMed] [Google Scholar]
- 34.Dimmock DP, Trapane P, Feigenbaum A, Keegan CE, Cederbaum S, Gibson J, Gambello MJ, Vaux K, Ward P, Rice GM, Wolff JA, O'Brien WE, Fang P. The role of molecular testing and enzyme analysis in the management of hypomorphic citrullinemia. Am J Med Genet A. 2008;146A:2885–2890. doi: 10.1002/ajmg.a.32527. [DOI] [PMC free article] [PubMed] [Google Scholar]
- 35.Kobayashi T. Brain-to-body ratios and time of maturation of the mouse brain. Am J Physiol. 1963;204:343–346. doi: 10.1152/ajplegacy.1963.204.2.343. [DOI] [PubMed] [Google Scholar]
- 36.Hatten ME. New directions in neuronal migration. Science. 2002;297:1660–1663. doi: 10.1126/science.1074572. [DOI] [PubMed] [Google Scholar]
- 37.Hensley K, Maidt ML, Yu Z, Sang H, Markesbery WR, Floyd RA. Electrochemical analysis of protein nitrotyrosine and dityrosine in the Alzheimer brain indicates region-specific accumulation. J Neurosci. 1998;18:8126–8132. doi: 10.1523/JNEUROSCI.18-20-08126.1998. [DOI] [PMC free article] [PubMed] [Google Scholar]
- 38.Beal MF, Ferrante RJ, Browne SE, Matthews RT, Kowall NW, Brown RH., Jr Increased 3-nitrotyrosine in both sporadic and familial amyotrophic lateral sclerosis. Ann Neurol. 1997;42:644–654. doi: 10.1002/ana.410420416. [DOI] [PubMed] [Google Scholar]
- 39.Ischiropoulos H, Beckman JS. Oxidative stress and nitration in neurodegeneration: cause, effect, or association? J Clin Invest. 2003;111:163–169. doi: 10.1172/JCI17638. [DOI] [PMC free article] [PubMed] [Google Scholar]
- 40.Rice DS, Curran T. Mutant mice with scrambled brains: understanding the signaling pathways that control cell positioning in the CNS. Genes Dev. 1999;13:2758–2773. doi: 10.1101/gad.13.21.2758. [DOI] [PubMed] [Google Scholar]
- 41.Cagnon L, Braissant O. Hyperammonemia-induced toxicity for the developing central nervous system. Brain Res Rev. 2007;56:183–197. doi: 10.1016/j.brainresrev.2007.06.026. [DOI] [PubMed] [Google Scholar]
- 42.Prestes CC, Sgaravatti AM, Pederzolli CD, Sgarbi MB, Zorzi GK, Wannmacher CM, Wajner M, Wyse AT, Dutra Filho CS. Citrulline and ammonia accumulating in citrullinemia reduces antioxidant capacity of rat brain in vitro. Metab Brain Dis. 2006;21:63–74. doi: 10.1007/s11011-006-9005-6. [DOI] [PubMed] [Google Scholar]
- 43.Lucke T, Tsikas D, Kanzelmeyer N, Vaske B, Das AM. Elevated plasma concentrations of the endogenous nitric oxide synthase inhibitor asymmetric dimethylarginine in citrullinemia. Metabolism. 2006;55:1599–1603. doi: 10.1016/j.metabol.2006.07.020. [DOI] [PubMed] [Google Scholar]
- 44.Norenberg MD, Rama Rao KV, Jayakumar AR. Signaling factors in the mechanism of ammonia neurotoxicity. Metab Brain Dis. 2009;24:103–117. doi: 10.1007/s11011-008-9113-6. [DOI] [PubMed] [Google Scholar]
- 45.Nagasaka H, Okano Y, Tsukahara H, Shigematsu Y, Momoi T, Yorifuji J, Miida T, Ohura T, Kobayashi K, Saheki T, Hirano K, Takayanagi M, Yorifuji T. Sustaining hypercitrullinemia, hypercholesterolemia and augmented oxidative stress in Japanese children with aspartate/glutamate carrier isoform 2-citrin-deficiency even during the silent period. Mol Genet Metab. 2009;97:21–26. doi: 10.1016/j.ymgme.2009.01.009. [DOI] [PubMed] [Google Scholar]
- 46.Minich T, Yokota S, Dringen R. Cytosolic and mitochondrial isoforms of NADP+-dependent isocitrate dehydrogenases are expressed in cultured rat neurons, astrocytes, oligodendrocytes and microglial cells. J Neurochem. 2003;86:605–614. doi: 10.1046/j.1471-4159.2003.01871.x. [DOI] [PubMed] [Google Scholar]
- 47.Vogel R, Wiesinger H, Hamprecht B, Dringen R. The regeneration of reduced glutathione in rat forebrain mitochondria identifies metabolic pathways providing the NADPH required. Neurosci Lett. 1999;275:97–100. doi: 10.1016/s0304-3940(99)00748-x. [DOI] [PubMed] [Google Scholar]
- 48.Ogawa T, Kimoto M, Sasaoka K. Purification and properties of a new enzyme. NG,NG-dimethylarginine dimethylaminohydrolase, from rat kidney. J Biol Chem. 1989;264:10205–10209. [PubMed] [Google Scholar]
- 49.Tsikas D, Boger RH, Sandmann J, Bode-Boger SM, Frolich JC. Endogenous nitric oxide synthase inhibitors are responsible for the L-arginine paradox. FEBS Lett. 2000;478:1–3. doi: 10.1016/s0014-5793(00)01686-0. [DOI] [PubMed] [Google Scholar]
- 50.Tanaka M, Yoshida S, Yano M, Hanaoka F. Roles of endogenous nitric oxide in cerebellar cortical development in slice cultures. Neuroreport. 1994;5:2049–2052. doi: 10.1097/00001756-199410270-00015. [DOI] [PubMed] [Google Scholar]
- 51.Banbury Mutant mice and neuroscience: Recommendations concerning genetic background: Banbury Conference on genetic background in mice. Neuron. 1997;19:755–759. doi: 10.1016/s0896-6273(00)80958-7. [DOI] [PubMed] [Google Scholar]
- 52.Marini JC, Erez A, Castillo L, Lee B. Interaction between murine spf-ash mutation and genetic background yields different metabolic phenotypes. Am J Physiol Endocrinol Metab. 2007;293:E1764–E1771. doi: 10.1152/ajpendo.00525.2007. [DOI] [PubMed] [Google Scholar]
- 53.DeMars R, LeVan SL, Trend BL, Russell LB. Abnormal ornithine carbamoyltransferase in mice having the sparse-fur mutation. Proc Natl Acad Sci USA. 1976;73:1693–1697. doi: 10.1073/pnas.73.5.1693. [DOI] [PMC free article] [PubMed] [Google Scholar]
- 54.Goldblum OM, Brusilow SW, Maldonado YA, Farmer ER. Neonatal citrullinemia associated with cutaneous manifestations and arginine deficiency. J Am Acad Dermatol. 1986;14:321–326. doi: 10.1016/s0190-9622(86)70035-2. [DOI] [PubMed] [Google Scholar]