

Abstract
Metastases are frequently found during colorectal cancer diagnoses and are the main determinants of clinical outcome. The lack of reliable models of metastases has precluded their mechanistic understanding and our capacity to improve outcome. We studied the effect of E-cadherin and Snail1 expression on metastagenesis in a colorectal cancer model. We microinjected SW480-ADH human colorectal cancer cells, transfected with an empty vector (Mock) or overexpressing Snail1 (Snail1OE) or E-cadherin (E-cadherinOE), in the ceca of nude mice (eight per group) and analyzed tumor growth, dissemination, and Snail1, E-cadherin, β-catenin, and Presenilin1 (PS1) expression in local tumors and/or metastatic foci. Snail1OE cells disseminated only to lymph nodes, whereas Mock or E-cadherinOE cells spread to lymph nodes and peritoneums. Peritoneal tumor foci developed by E-cadherinOE cells presented an increase in E-cadherin proteolysis and nuclear translocation, and enhanced expression of proteolytically active PS1, which was linked to increased tumor growth and shortened mouse survival. Interestingly, local and lymph node tumors in mice bearing E-cadherinOE cells overexpressed E-cadherin, but they did not show E-cadherin proteolysis or nuclear translocation. Remarkably, E-cadherin nuclear translocation and enhanced expression of active PS1 were found in a patient with colorectal signet-ring cell carcinoma. In conclusion, we have established a colorectal cancer metastasis model in which E-cadherin proteolyis and nuclear translocation associates with aggressive foci growth only in the peritoneal microenvironment.
Metastases are frequently found at colorectal cancer diagnosis and are the main determinants of clinical outcome.1 Despite an initial response to therapy they are frequently fatal.2 A mechanistic understanding of metastatic dissemination may improve prognosis and outcome.
E-cadherin is a tumor suppressor that maintains epithelial integrity and inhibits migration and invasion.3 Its forced expression suppresses tumorigenesis, whereas E-cadherin loss associates with adenoma to carcinoma transition in experimental models.4 Transcriptional repression or mutational inactivation occurs in diffuse type gastric carcinomas,5 whereas increased membranous expression associates with longer cancer patient survival in bladder cancer.6 In sporadic colorectal cancer, E-cadherin down-regulation has been reported to associate with dedifferentiation, progression, and metastasis,7 whereas its membranous expression could confer good prognosis.8 Intriguingly, E-cadherin is expressed in a subset of metastatic lesions in colorectal cancer.9,10 The transcription factor Snail1 represses E-cadherin expression and associates with dedifferentiation and invasiveness,11 proliferative block, and increased resistance to cell death.12 Snail1 expression correlates with metastasis and poor outcome in breast and other cancers,13–15 but this association had not been reported in colorectal cancer.16,17 A recent study has shown the expression of Snail1 protein in the stroma of colon tumors. Interestingly, the presence of Snail1 in this compartment associates with the existence of distant metastasis and with shorter patient survival.18 E-cadherin and Snail1 expression have been extensively studied in colorectal primary tumors but they have been less frequently evaluated in metastatic foci.
The lack of reliable models of metastasis in colorectal cancer has precluded the study of its mechanistic basis. We have developed a procedure for the orthotopic microinjection (OCMI) of human colon cancer cells in the colonic wall of nude mice to generate a model that replicates the relevant metastatic sites observed in human colorectal cancer.19 This model allows ex vivo manipulation of cancer cells to study the role of oncogenes or tumor suppressor genes in oncogenesis, as we described in a previous report evaluating Rac1.20
Here, we used human colorectal cancer SW480-ADH cells, which express low levels of Snail1 and E-cadherin,21,22 to derive clones expressing an empty vector (Mock cells), overexpressing Snail1 (Snail1OE cells) or overexpressing E-cadherin (E-cadherinOE cells). We studied local tumor growth and metastatic dissemination after their orthotopic implantation. We also evaluated β-catenin and E-cadherin expression in tumors, because most colorectal cancer cells, including SW480-ADH,23 have an active canonical Wnt/β-catenin signaling pathway. This leads to β-catenin accumulation within the nucleus, a process inhibited by the interaction of E-cadherin and β-catenin at the plasma membrane adherens junctions.3 In addition, we assessed Presenilin1 (PS1) expression, as this protein regulates E-cadherin cleavage and β-catenin transcriptional activity.24
Materials and Methods
Generation of Stable Cell Lines
SW480-ADH cells were retrovirally transduced with pRV-IRES-GFP (empty vector) or pRV-Snail1-IRES-GFP vectors to generate Mock cells or Snail1 overexpressing (Snail1OE) cells, respectively.22 E-cadherin overexpressing (E-cadherinOE) cells were generated by transfecting a mouse E-cadherin cDNA vector in SW480-ADH cells and selecting stable transfected cells with G418.25 Cells were maintained in DMEM and 10% FBS (both from Invitrogen, Life Technologies, Carlsbad, CA) in 5% CO2 at 37°C.
LEF1 and Fibronectin mRNA Quantitation in SW480-ADH Mock, SnailOE, and E-CadherinOE Cells
RNA was extracted from cultured cells using the RNeasy Mini Kit (Qiagen). The level of LEF1 and Fibronectin/FN1 mRNA was measured by qRT-PCR in relation to the level of the 18S rRNA using the comparative CT method. mRNA was retrotranscribed using the High-Capacity cDNA Archive Kit (Applied Biosystems, Foster City, CA). The quantitative PCR reaction was performed in an ABI Prism 7900 HT thermal cycler using Power SYBR Green PCR Master Mix (both from Applied Biosystems). Thermal cycling consisted of a denaturing step at 95°C for 10 minutes and 40 cycles of denaturing at 95°C for 15 seconds and annealing and elongation at 60°C for 60 seconds. Oligonucleotides used for LEF1 were 5′-CGAAGAGGAAGGCGATTTAG-3′ (sense) and 5′-GTCTGGCCACCTCGTGTC-3′ (antisense); whereas for Fibronectin/FN1 they were 5′-GGGAGCCTCGAAGAGCAAG-3′ (sense) and 5′-AACCGGGCTTGCTTTGAC-3′ (antisense).
β-Catenin and E-Cadherin Immunofluorescence in SW480-ADH Mock, SnailOE, and E-CadherinOE Cells
A total number of 50,000 cells were seeded into a Lab-TekII chamber slide/8 well on glass (Thermo Scientific, Rochester, NY) for 48 hours. Cells were then fixed with cold methanol, washed twice with PBS, and blocked for 1 hour in 1% BSA on PBS at room temperature. Afterward, the cells were washed with PBS and incubated with β-catenin (BD Transduction, San Jose, CA; 1:100) or E-cadherin (BD Transduction, 1:50) antibodies for 1 hour. Then, we washed with PBS and incubated with the secondary antibody conjugated with TRITC (Jackson, West Grove, PA; 1:100) and Hoescht dye (50 ng/ml). Finally, cells were rinsed with PBS and coverslips were mounted using Fluoprep (BioMe-rieux, Marcy l'Etoille, France). Samples were observed in a fluorescence microscope (Axiovert 200M, Zeiss, Dublin, CA) at 6303, using a rhodamine or DAPI filter. Images were obtained with a digital camera (Coolsnap, Photometrics, Tuscon, AZ) and MetaMorph 5.01 software.
Reporter Assays for β-Catenin/TCF Activity in SW480-ADH Mock, SnailOE, and E-CadherinOE Cells
Cells were transfected in triplicate 24-well dishes with 200 ng TOP-Flash or FOP-Flash plasmids and 20 ng pRLSV40 control plasmid (Promega, Madison, WI) using jetPEI transfection reagent (PolyPlus Transfection). TOP-Flash and FOP-Flash plasmids contain multimerized wild-type (CCTTTGATC) or mutated (CCTTTGGCC) TCF/LEF1 binding sites upstream of a minimal c-fos promoter driving luciferase gene expression (a gift from H. Clevers, Hubrecht Institute and University Medical Center, Utrecht, The Netherlands). Cells were harvested 48 hours after transfection and Firefly luciferase (Luc), and Renilla reniformis luciferase (Rluc) activities were measured separately using the Dual Luciferase Reporter Assay System (Promega) and a Lumat LB9507 luminometer (Berthold, Technologies, Bad Wildbad, Germany). Luc activity was normalized to Rluc activity.
Experimental Procedure and Collection of Human Samples
We injected 2 × 10⁶ SW480-ADH Mock, Snail1OE, or E-cadherinOE cells in the cecal wall of each Swiss nude mouse (Charles River, L'Abresle, France), as described.19 Eight mice were included per group. Animals were kept until death or sacrificed at day 150. Mice were euthanized when they had lost 20% of body weight or showed signs of pain, or if their tumors became too large. Local tumor and peritoneal tumor foci size was estimated as described.19 We obtained archived paraffin-embedded tissues from primary tumors and peritoneal metastases of 12 colorectal carcinoma patients treated at our hospital.
Histopathological Analysis
We recorded colonic tumor growth and macroscopic tumor deposits at mouse necropsy. We calculated tumor take rate as the percentage of mice with local tumor growth. Samples were frozen in liquid nitrogen for molecular analysis or fixed in formalin and H&E stained.19 The extent of gland-like structures or necrosis, periodic acid shift (PAS) staining, and Cytokeratin 20 (CK20), and/or CDX2 immunostaining defined tumor differentiation.1
Immunohistochemical Analysis
Five-micrometer sections of paraffin-embedded tumor tissues from the experimental and clinical studies were reacted with antibodies against β-catenin (Cell Signaling, Danvers, MA; 1:100), intracellular domain of E-cadherin (BD Transduction, 1:200), and Snail1 (a gift from A. García de Herreros, IMIM-Hospital del Mar, Barcelona, Spain, 1:500), CK20 (DAKO, Glostrup, Denmark; Ks 20.8 clone, 1:50), and CDX2 (88 clone, Biogenex, San Ramon, CA; 1:50) according to standard procedures.26 The Snail1 antibody required target retrieval at pH 9.0 and sequential pretreatment with 1% Triton (1 hour), 0.1% BSA (1 hour), and Fab fragment goat-anti-mouse IgG (1/50, 2 hours; Jackson) before incubation.
Western Blotting Analysis of Stable Cells and Tumor Xenografts
LEF1 expression in cultured cells and E-cadherin and PS1 expression in mouse tumor samples were assessed by Western blotting as described.26 Antibody dilutions were: LEF1 (Cell Signaling, 1:1000), E-cadherin (BD Transduction, 1:2000), PS1 (Santa Cruz, CA; 1:1000), β-actin (Santa Cruz, 1:2000), POD-conjugated goat anti-mouse, donkey anti-goat, and goat anti-rabbit (Boehringer-Mannheim, 1:20,000). The anti–E-cadherin antibody detects the 120-kDa full-length protein (FL), which remains in the cytosol or cell membrane, and also its 38 kDa proteolyzed cytosolic fragment (CF), which may translocate to the nucleus. The anti-PS1 antibody detects the 50-kDa nonprocessed PS1 (npPS1) and the processed proteolytically active 29-kDa PS1 (pPS1). Supersignal chemoluminescence (Pierce, Rockford, IL) and Kodak 440 Digital Science Image software were used to measure band intensity to calculate the E-cadherin proteolyzed ratio = CF/(CF + FL) after its normalization with endogenous β-actin. The same procedure was applied to calculate the PS1 proteolytic ratio = pS1/(npPS1 + pPS1).
Quantitative PCR of PS1 in Colorectal Carcinoma Samples
We assessed PS1 expression in four 10-μm-thick sections of primary tumors and peritoneal carcinomatotic foci from two patients with colorectal signet-ring cell carcinoma (SRCC) that showed different subcellular localization of E-cadherin. Before RNA extraction, the sections were deparaffined (xylol and ethanol 100%), centrifuged (10 minutes), incubated with 200 μl proteinase K lysis buffer (10 mmol/L Tris/HCl EDTA, 2% SDS, 500 μg/ml proteinase K) for 2 hours at 56°C. Five hundred microliters of 100% ethanol was then added, and the mixture was centrifuged at 12,000 rpm for 15 minutes. RNA was extracted, tested for quality, retrotranscribed, and quantified applying the comparative CT method, as described.27 We used predesigned Taqman Gene Expression Primer and Probe Assays (Applied Biosystems) for PS1 (Hs00997789_m1), GAPDH (Hs99999905_m1), and β-actin (Hs99999903_m1). We also used a colorectal primary tumor as the calibration sample and the median of endogenous β-actin and GAPDH expression to normalize PCR results.
Statistical Analysis
All measured values were expressed as mean ± SE analysis of variance, Mann—Whitney, or Student's t-tests were applied to assess the significance of the differences in mean final tumor volume, percentage of necrosis, rate of mitotis, rate of dead cell bodies, ratio of proteolyzed E-cadherin, or ratio of proteolytic PS1. The Fisher's exact test was used to evaluate the differences in take rate and lymph node or peritoneal tumor foci rates. The likelihood of mice survival was estimated according to Kaplan–Meier and survival distributions, whereas the comparison among the studied groups was performed applying the log-rank test. All tests were performed using SPSS version 11.0. Differences were considered significant at P < 0.05.
Results
Characterization of Stable Cell Lines
Mock, Snail1OE, and E-cadherinOE SW480-ADH human colorectal carcinoma cells are depicted in Figure 1. Snail1OE cells displayed a mesenchymal phenotype and expressed high levels of the mesenchymal markers LEF1 and fibronectin (Figure 1, B, D, and E), whereas E-cadherinOE cells depicted an epithelial phenotype and reduced expression of the mesenchymal markers (Figure 1, C–E). Mock cells displayed an intermediate phenotype (Figure 1, A, D, and E). Moreover, β-catenin/TCF transcriptional activity was strongly reduced in E-cadherinOE cells (Figure 1F), and accordingly β-catenin was absent in the nucleus (Figure 1G). In contrast, Mock or Snail1OE cells expressed nuclear β-catenin and displayed higher β-catenin/TCF transcriptional activity (Figure 1, F and G).
Figure 1.
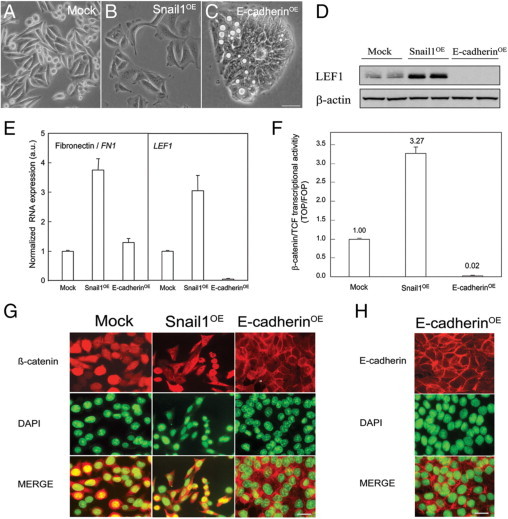
Characterization of cultured human SW480-ADH colorectal cancer cells stably expressing an empty vector (Mock cells) or overexpressing Snail1 (Snail1OE cells) or E-cadherin (E-cadherinOE). These cells were previously generated (22 and 25). A–C: Phase-contrast microscopy images of Mock (A), Snail1OE (B), and E-cadherinOE (C) SW480-ADH cells. Scale bar = 50 μm. Snail1OE cells displayed a large and stellate phenotype with few cell-cell contacts. E-cadherinOE cells displayed an epitheloid morphology with higher cell density and cell–cell contacts. Mock cells displayed a mixed phenotype with an intermediate cell density and a few suspended cells. D and E: The expression of the mesenchymal markers LEF1 and Fibronectin, as measured by Western blotting (D) or qRT-PCR (E), was higher in Snail1OE than in Mock or E-cadherinOE cells. E-cadherinOE cells showed a complete shut-down of LEF1 expression. F: β-catenin/TCF transcriptional activity was extremely reduced in E-cadherinOE cells compared with Mock or Snail1OE cells. G: β-catenin was nuclear (DAPI staining colocalization) in Mock and Snail1OE cells, whereas it was membranous and cytosolic in E-cadherinOE cells. Scale bar = 50 μm. H: E-cadherin was mostly membranous in E-cadherinOE cells. Scale bar = 50 μm.
Differences in Tumor Take Rate, Colonization Sites, and Differentiation by Snail1 or E-Cadherin Overexpression
The study groups did not show significant differences in tumor take rate or in tumor spread to mesenteric lymph nodes (Table 1 and Supplemental Figure S1, C–E available at http://ajp.amjpathol.org). Moreover, we did not observe macrometastases or micrometastases in liver or lung in any group. However, the peritoneal carcinomatotic rate was significantly different (P = 0.034) among groups (Table 1). The overexpression of Snail1, which decreases E-cadherin level (Table 2), completely blocked peritoneal dissemination, because no mouse (0%) bearing a local tumor showed peritoneal foci in this group (Table 1). In contrast, E-cadherinOE cells generated peritoneal foci in all animals that developed local tumors (100%) (Table 1). Mock cells displayed an intermediate E-cadherin expression level (Table 2) and yielded a moderate rate of peritoneal foci (40%) (Table 1). Therefore, E-cadherin expression appears to be required for the development of peritoneal foci.
Table 1.
Take Rate and Size of the Local and Secondary Tumors Developed after Orthotopic Implantation of Three Distinct Human SW480-ADH–Derived Colorectal Cancer Cell Lines in Nude Mice
| Group | Mice (n) | Local tumor |
Secondary tumor foci |
|||
|---|---|---|---|---|---|---|
| Take rate (*) (%) | Tumor volume (cm3) | Lymph node (†) (%) | Peritoneum (†) (%) | Peritoneal foci volume (cm3) | ||
| Mock | 8 | 5/8 (63) | 0.05 ± 0.02‡ | 2/5 (40) | 2/5 (40)§ | 0.9 ± 0.5‖ |
| Snail1OE | 8 | 7/8 (88) | 0.13 ± 0.03‡ | 4/7 (47) | 0/7 (0)¶ | — |
| E-cadherinOE | 8 | 5/8 (63) | 0.08 ± 0.02‡ | 2/5 (40) | 5/5 (100)§,¶ | 3.6 ± 0.4‖ |
Mock group: mice implanted with Mock cells; Snail1OE group: mice implanted with Snail1 overexpressing cells; E-cadherinOE group: mice implanted with E-cadherin overexpressing cells.
— indicates undetectable;
Mice with local tumors/total number of injected mice per group;
Mice with tumor foci at the particular site/total number of mice bearing local tumors.
Nonsignificant differences (P = 0.063); Significant differences at P = 0.042
or P = 0.008
(Fisher's test);
Significant differences at P = 0.034 (Student's t-test).
Table 2.
Histopathology and CK20, Snail1, E-Cadherin, and β-Catenin Expression Levels and Subcellular Localization in Local Tumors and Secondary Tumor Foci Generated from the Three Types of Implanted SW480-ADH Cells
| Group | Local tumor* |
|||||
|---|---|---|---|---|---|---|
| Degree of differentiation | PAS staining | CK20 | Snail1† | E-cadherin† | β-catenin† | |
| Mock | Poorly differentiated | − | − | +/− Nuc./Cyt. | +/− Cyt./Mb. | ++ Nuc. |
| Snail1OE | Undifferentiated | − | − | +++ Nuc./Cyt. | — | +++ Nuc./Cyt. |
| E-cadherinOE | Well-differentiated | + | +++ Cyt. | — | ++ Cyt./Mb. | +/− Cyt. |
| Group | Lymph node secondary tumor foci‡ |
|||||
|---|---|---|---|---|---|---|
| Degree of differentiation | PAS staining | CK20 | Snail1 | E-cadherin | β-catenin | |
| Mock | Poorly differentiated | − | − | +/− Nuc./Cyt. | +/− Mb. | +++ Nuc./Cyt. |
| Snail1OE | Undifferentiated | − | − | +++ Nuc./Cyt. | — | +++ Nuc./Cyt. |
| E-cadherinOE | Well-differentiated | + | +++ Cyt. | — | + Cyt./Mb. | +/− Cyt./Mb. |
| Group | Secondary peritoneal carcinomatotic foci§ |
|||||
|---|---|---|---|---|---|---|
| Degree of differentiation | PAS staining | CK20 | Snail1 | E-cadherin | β-catenin | |
| Mock | Poorly differentiated | − | − | +/− Cyt. | + Mb. | +++ Nuc./Cyt. |
| E-cadherinOE | Well-differentiated | + | +++ Cyt. | — | +++ Nuc./Cyt./Mb. | +/− Cyt. |
Mock group: mice implanted with Mock cells; Snail1OE group: mice implanted with Snail1 overexpressing cells; E-cadherinOE group: mice implanted with E-cadherin overexpressing cells.
See Figures 2, 4, and 5 and Supplemental Figure S2);
Nuc. indicates nuclear staining, Cyt., cytoplasmic staining, Mb., membranous staining, —, undetectable;
See Figures 2, 4, 6 and Supplemental Figure S3);
See Figures 3, 7, and Supplemental Figure S4. (Supplemental figures are available at http://ajp.amjpathol.org.)
Consistent with the association described in vitro between Snail1 expression and the induction of mesenchymal characteristics and between E-cadherin expression and an epithelial phenotype, local tumors in the Snail1OE group were undifferentiated, PAS− and CK20− (Figure 2B, Table 2, and Supplemental Figure S2, B, E, and H, available at http://ajp.amjpathol.org), whereas tumors in the E-cadherinOE group were PAS+ and CK20+ (Supplemental Figure S2, C, F, and I, available at http://ajp.amjpathol.org) well-differentiated adenocarcinomas, containing glands and secretory mucini (Figure 2C and Table 2). Local tumors in the Mock group were poorly differentiated, PAS− and CK20− (Figure 2A, Table 2, and Supplemental Figure S2, A, D, and G, available at http://ajp.amjpathol.org). Lymph node tumor foci were PAS−, CK20−, and poorly differentiated in the Mock group; they were PAS−, CK20−, and undifferentiated in the Snail1OE group, and they were PAS+, CK20+, and well-differentiated in the E-cadherinOE group (Figure 2, D–F, Table 2, and Supplemental Figure S3, available at http://ajp.amjpathol.org). Peritoneal tumors in the Mock group were PAS−, CK20−, and poorly differentiated (Figure 3, A and C, Table 2, and Supplemental Figure S4, A, C, and E, available at http://ajp.amjpathol.org), whereas foci in the E-cadherinOE group were PAS+, CK20+, and well-differentiated (Figure 3, B and D, Table 2, and Supplemental Figure S4, B, D, and F, available at http://ajp.amjpathol.org). In addition, all local tumors, lymph node foci, and carcinomatotic foci were CDX2− in the three groups. Therefore, within each group local and secondary tumors showed the same degree of differentiation and marker expression.
Figure 2.
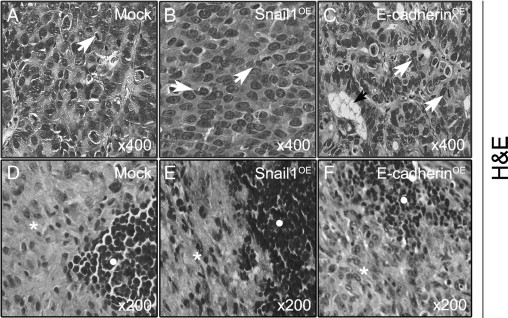
Histopathology in local colonic tumors and lymph node foci derived from Mock, Snail1OE, and E-cadherinOE cells. Local tumors were poorly differentiated in the Mock group (A), undifferentiated in the Snail1OE group (B), and well-differentiated, containing glands and mucous deposits (black arrow) in the E-cadherinOE group (C). The mitotic rate (white arrows) was similar in all three groups. All lymph node tumor foci (white asterisk) infiltrated the lymph nodes, pushing aside normal lymphocytes (white circle). The lymph node tumor foci were poorly differentiated in the Mock group (D), undifferentiated in the Snail1OE group (E), and showed differentiation features in E-cadherinOE group (F).
Figure 3.
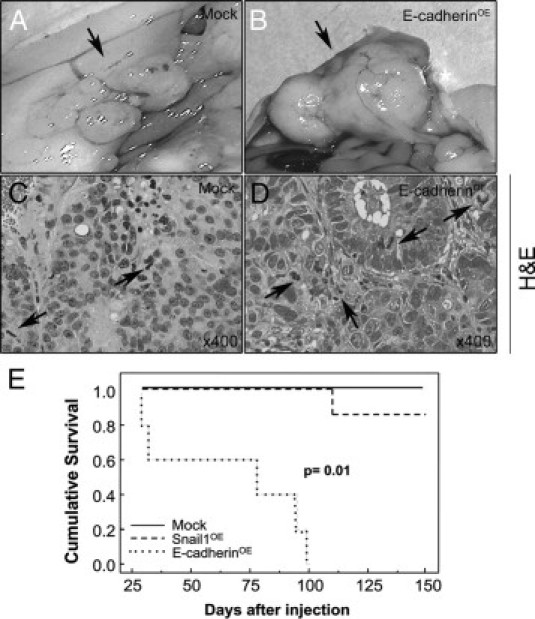
Peritoneal carcinomatotic foci development and survival in mice implanted with Mock or E-cadherinOE cells. Tumor foci developed in the peritoneum (black arrow) after cecal implantation of Mock (A) or E-cadherinOE (B) cells, but not after implantation of Snail1OE cells. Tumor foci derived from E-cadherinOE cells were large (B) and well-differentiated and they had a high mitotic rate (D, black arrows). Tumor foci in the Mock group were small (A) and poorly differentiated, and they had a lower mitotic rate (C, black arrows). E: Cumulative survival was significantly higher in mice bearing tumors derived from Mock or from Snail1OE cells than in those bearing tumors derived from E-cadherinOE cells.
Growth and Expression of Snail1, E-Cadherin, and β-Catenin in Local Tumors
Tumors grew within the cecal wall and reached a macroscopic size in all groups (Supplemental Figure S1A, B available at http://ajp.amjpathol.org). Those derived from Mock or E-cadherinOE cells were rounded, whereas tumors derived from Snail1OE cells were flattened and multilobular and displayed less defined margins. Mean final tumor volume was nonsignificantly (P = 0.063) higher in Snail1OE than in Mock or E-cadherinOE groups (Table 1). Local tumors in the Mock group displayed low nuclear Snail1 (Figure 4A), low membranous E-cadherin (Figure 5A), and high nuclear β-catenin (Figure 5D) expression (Table 2). Tumors derived from Snail1OE cells showed strong nuclear Snail1 (Figure 4B), undetectable E-cadherin (Figure 5B), and strong nuclear β-catenin (Figure 5E) expression (Table 2). Tumors derived from E-cadherinOE cells displayed undetectable Snail1 (Figure 4C), intense cytosolic/membranous E-cadherin (Figure 5C), and weak cytosolic β-catenin (Figure 5F) expression (Table 2).
Figure 4.
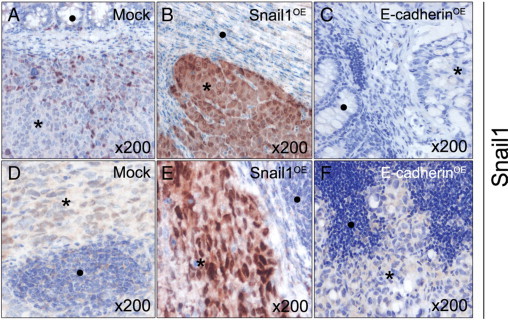
Snail1 expression in local colonic tumors and lymph node foci generated from Mock, Snail1OE, or E-cadherinOE cells. Snail1 immunostaining in both local tumor (A–C) and lymph node foci (D–F) were weak and nuclear in the Mock group (A and D), very strong and mostly nuclear in the Snail1OE group (B and E), and undetectable in the E-cadherin OE group (C and F). Black asterisk indicates tumor tissue; black circle indicates normal tissue.
Figure 5.
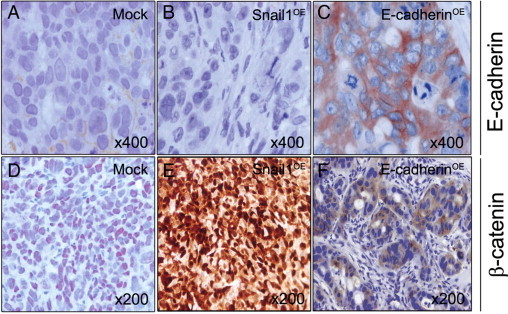
E-cadherin and β-catenin expression in local colonic tumors derived from Mock, Snail1OE, and E-cadherinOE cells. E-cadherin immunostaining was weak and membranous in Mock group tumors (A), absent in Snail1OE group tumors (B), and intense, cytosolic, and membranous in tumors derived from E-cadherinOE cells (C). β-catenin immunostaining was moderately intense and nuclear in Mock group tumors (D), very intense and mostly nuclear in Snail1OE group tumors (E), and weak and cytosolic in E-cadherinOE group tumors (F). Hematoxylin costaining.
Therefore, we observed no association between Snail1, E-cadherin, or β-catenin expression or their subcellular localization and local tumor growth. However, an association was found between membrane E-cadherin expression and tumor epithelial differentiation. Tumors of the Snail1OE group, which overexpressed Snail1 (Figure 4B) and repressed E-cadherin (Figure 5B), were undifferentiated (Figure 2B), whereas tumors expressing E-cadherin at the plasma membrane either at low (Mock group) or high (E-cadherinOE group) level (Figure 5, A and C, respectively), showed epithelial differentiation (Figure 2, A and C).
Growth and Expression of Snail1, E-Cadherin, and β-Catenin in Lymph Node Tumor Foci
Whereas local tumors reached a similar size in all groups, lymph node tumor foci were significantly larger in Mock or E-cadherinOE than in the Snail1OE group (Supplemental Figure S1, C–E available at http://ajp.amjpathol.org). The number of lymph node foci per mouse was, however, slightly increased in the latter group (Table 1).
Findings in local tumors and lymph node tumor foci were similar. Lymph node foci of mice bearing Mock cells showed weak nuclear Snail1 (Figure 4D), weak membranous E-cadherin (Figure 6A), and very strong and nuclear β-catenin (Figure 6D) expression (Table 2). Lymph node tumor foci in the Snail1OE group showed very intense and nuclear Snail1 (Figure 4E), undetectable E-cadherin (Figure 6B), and very intense and nuclear β-catenin (Figure 6E) expression (Table 2). Lymph node foci in the E-cadherinOE group showed undetectable Snail1 (Figure 4F), moderate and membranous E-cadherin (Figure 6C), and cytosolic/membranous β-catenin (Figure 6F) expression (Table 2). Therefore, there was no association between Snail1, E-cadherin, or β-catenin expression or subcellular localization and foci growth. However, Snail1 overexpression and lack of E-cadherin were associated with undifferentiation (Figure 4E, Table 2 and Supplemental Figure S3, B and E, available at http://ajp.amjpathol.org), whereas membranous E-cadherin and lack of Snail1 were associated with differentiation (Figure 4F, Table 2 and Supplemental Figure S3, C and F, available at http://ajp.amjpathol.org).
Figure 6.
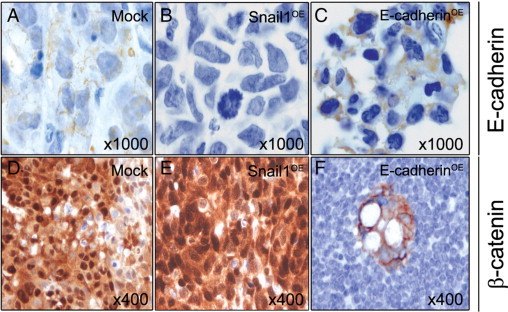
E-cadherin and β-catenin expression in lymph node foci derived from Mock, Snail1OE, or E-cadherinOE cells. E-cadherin immunostaining was weak and membranous in foci of the Mock group (A), undetectable in the Snail1OE group (B), and cytosolic and membranous in the E-cadherinOE group (C). β-catenin immunostaining was very strong and mostly nuclear in foci of the Mock (D) or Snail1OE (E) groups, and weak, cytosolic, and membranous in foci of the E-cadherinOE group (F). Hematoxylin costaining.
Growth and Expression of Snail1, E-Cadherin, and β-Catenin in Peritoneal Tumor Foci
Most peritoneal carcinomatotic foci generated in the Mock or E-cadherinOE groups reached a macroscopic size. Final foci size (3.6 ± 0.4 cm3, Figure 3B and Table 1) or mitotic rate (20.6 ± 3.1, Figure 3D) in the E-cadherinOE group were significantly higher (P < 0.01) than in the Mock group (0.9 ± 0.5 cm3, Figure 3A and Table 1; and 12.1 ± 2.4, Figure 3C). The increase in peritoneal tumor foci growth killed all mice in the E-cadherinOE group, being their mean survival 67 ± 15 days (Figure 3E). In contrast, mice in the Snail1OE or Mock groups remained alive after 150 days, except for a mouse in the Snail1OE group that died of local tumor growth. Consistently, cumulative mouse survival was significantly higher (P = 0.01) in the Mock (100%, 5/5) or Snail1 (85%, 6/7) groups than in the E-cadherinOE (0%, 0/5) group (Figure 3E and Table 1).
Immunohistochemical analysis of peritoneal tumor foci in the Mock group showed weak and cytosolic Snail1, low and membranous E-cadherin, and very intense nuclear β-catenin expression (Figure 7, A, C, and E, and Table 2). In contrast, E-cadherinOE peritoneal foci displayed undetectable Snail1, very intense and nuclear E-cadherin, and weak and cytosolic but not nuclear β-catenin (Figure 7, B, D, and F, and Table 2). Therefore, nuclear E-cadherin overexpression was associated with nuclear β-catenin withdrawal in peritoneal foci. In addition, the level of E-cadherin expression in peritoneal tumor foci correlated with growth rate and aggressiveness.
Figure 7.
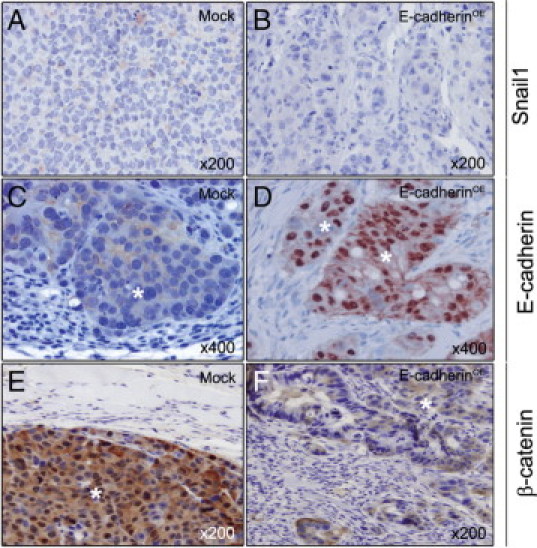
Snail1, E-cadherin, and β-catenin expression in peritoneal carcinomatotic foci of Mock and E-cadherinOE mice. Snail1 immunostaining was weak and cytosolic in Mock (A) and undetectable in E-cadherinOE (B) foci. E-cadherin immunostaining in peritoneal foci was weak and membranous in the Mock group (C) but very intense and mostly nuclear in the E-cadherinOE group (D). β-catenin immunostaining in carcinomatotic foci was very strong and mostly nuclear in the Mock group (E) but weak and cytosolic in the E-cadherinOE group (F). Hematoxylin costaining. White asterisks indicate tumor tissue.
We examined the relationship between E-cadherin proteolysis and nuclear translocation,28 and observed that the ratio of proteolyzed E-cadherin was significantly (P < 0.004) higher (10.2 ± 1.2) in peritoneal foci in the E-cadherinOE group than in the Mock group (3.7 ± 1.3) (Figure 8A left, 8B and Supplemental Table 1, available at http://ajp.amjpathol.org). This increased proteolysis was associated with E-cadherin nuclear translocation and cytosolic β-catenin (Figure 7, D and F, and Table 2). In contrast, a low level of E-cadherin proteolysis in peritoneal foci of the Mock group (Figure 8A left, 8B, and Supplemental Table 1, available at http://ajp.amjpathol.org) was associated with nuclear β-catenin and lack of nuclear E-cadherin (Figure 7, C and E, and Table 2). Concordantly, E-cadherin was not proteolyzed in Mock or Snail1 cultured cells, whereas E-cadherin fragments were detectable in E-cadherinOE cells (Figure 8A, right).
Figure 8.
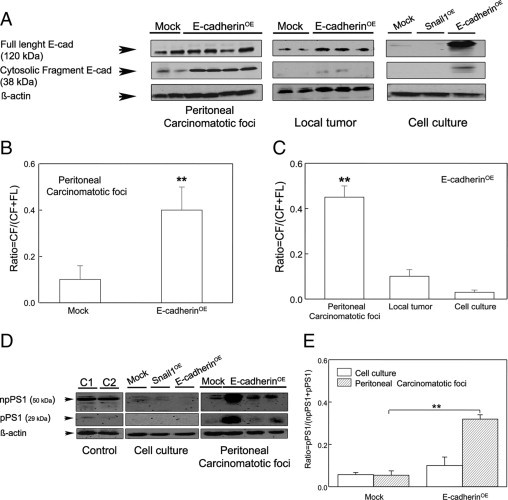
Increased levels of proteolyzed E-cadherin and proteolytically active Presenilin1 (PS1) in peritoneal carcinomatotic foci developed from E-cadherinOE cells. Peritoneal foci in the E-cadherinOE group overexpressed E-cadherin and showed a significantly (P < 0.005) higher level of proteolyzed E-cadherin than peritoneal foci in the Mock group (A, left and B), than E-cadherinOE local colonic tumors (A, center and C) or E-cadherinOE cultured cells (A, right and C). Neither Mock nor Snail1 cultured cells showed E-cadherin proteolysis (A, right). PS1 was barely detectable in Mock, Snail1OE, and E-cadherinOE cells cultured in vitro (D). Moreover, peritoneal foci generated from E-cadherinOE cells showed a significantly (**P < 0.01) higher ratio of active PS1 than foci derived from Mock cells (D and E). Ratio of proteolyzed E-cadherin = CF/(FL + CF); CF = 38-kDa cytosolic E-cadherin fragment; FL = 120 kDa full-length E-cadherin. Ratio of proteolytically active PS1 = pPS1/(npPS1 + pPS1); npPS1 = non-processed inactive 50 kDa PS1; pPS1 = processed and proteolytically active 29 kDa PS1; Control C1 = CHO k1 p70 cells; C2 = PC12 cells; there is statistically significant differences between groups **P < 0.01.
Tumor Environment Regulation of E-Cadherin and PS1 in the Mouse Model
We observed a differential regulation of expression, proteolysis, and nuclear translocation of E-cadherin depending on tumor environment (Supplemental Table 1, available at http://ajp.amjpathol.org). Thus, in the E-cadherinOE group, carcinomatotic foci showed significantly (P = 0.02) higher expression of E-cadherin (6.8 ± 0.7) than local tumors (1.8 ± 0.4) (Supplemental Table 1, available at http://ajp.amjpathol.org). Moreover, in these animals, the ratio of proteolyzed E-cadherin CF/(CF+FL) was significantly higher (P = 0.003) in peritoneal tumor foci (10.2 ± 1.2; Figure 8A left and 8C) than in local tumors (1.5 ± 1.2; Figure 8A center and 8C) or cultured cells (0.9 ± 0.1; Figure 8A right and 8C). This increase in E-cadherin expression and proteolysis in peritoneal foci of the E-cadherinOE group was associated with E-cadherin nuclear translocation (Figure 7D). E-cadherin was not detected in the nucleus of the corresponding local tumors (Figure 5C) or in the lymph node foci (Figure 6C). Neither did we find it in the nucleus of cultured E-cadherinOE cells (Figure 1H), where low levels of proteolyzed E-cadherin were detected (Supplemental Table 1, available at http://ajp.amjpathol.org).
In addition, we studied PS1 expression in primary tumors and peritoneal foci in Mock and E-cadherinOE groups (Figure 8, D and E), because this γ-secretase component cleaves E-cadherin in SW480 cells.24 Total PS1 expression in carcinomatotic foci of the E-cadherinOE group (14.1 ± 7.3) was higher than in the Mock group (1.5 ± 0.0) or than in E-cadherinOE cultured cells (Figure 8D and Supplemental Table 1, available at http://ajp.amjpathol.org). Moreover, the expression of active, processed PS1 (pPS1) was significantly higher (P = 0.003) in peritoneal foci in the E-cadherinOE group (6.1 ± 0.2) than in the Mock group (1.0 ± 0.3) or in cultured cells (Figure 8, D and E, and Supplemental Table 1, available at http://ajp.amjpathol.org). Therefore, the carcinomatotic foci derived from E-cadherinOE cells showed the highest levels of total and proteolytically active PS1 and the highest level of proteolyzed E-cadherin (Figure 8 and Supplemental Table 1, available at http://ajp.amjpathol.org). Carcinomatotic foci derived from E-cadherinOE cells were also the only tumor tissues that expressed nuclear E-cadherin (Figure 7D and Table 2).
Expression of E-Cadherin and PS1 in Colorectal Cancer Patients
To assess the clinical relevance of our model, we studied E-cadherin and β-catenin expression in primary tumors and carcinomatotic foci of 12 colorectal cancer patients. We found membranous/cytosolic E-cadherin and nuclear β-catenin expression in all 12 primary colorectal carcinomas studied and in 11 of the 12 carcinomatotic foci (data not shown). In contrast, one carcinomatotic foci from a colorectal SRCC patient presented nuclear E-cadherin (Figure 9C) and complete absence of β-catenin expression (Figure 9D). In this patient, both the primary colonic tumor and the peritoneal carcinomatotic foci displayed the nuclear shape, PAS positivity, and cytosolic mucous deposits characteristic of signet-ring tumors (Supplemental Figure S5, A–F, available at http://ajp.amjpathol.org).
Figure 9.
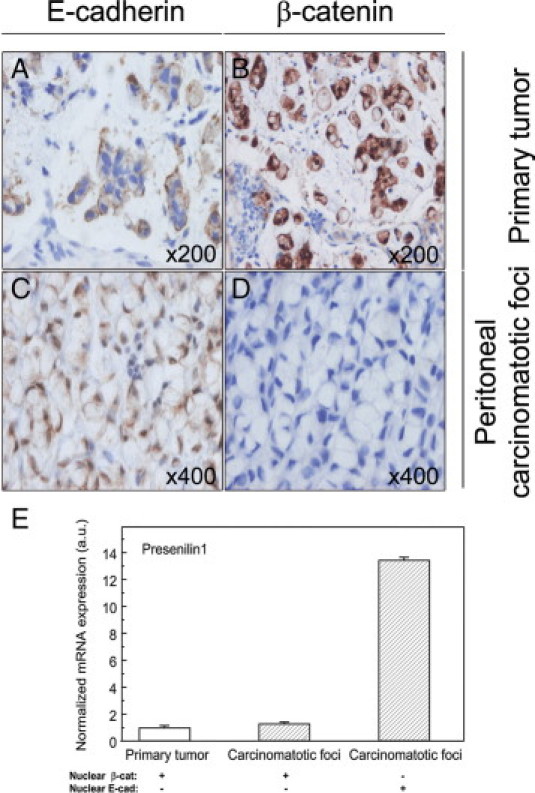
Nuclear E-cadherin and Presenilin1 (PS1) expression in peritoneal foci of colorectal signet-ring cell carcinoma. Two patients were analyzed. In the primary tumor and the carcinomatotic foci of one patient, there were moderate levels of E-cadherin in the membrane (A), intense and mostly nuclear β-catenin expression levels (B), and low PS1 RNA levels (E, qRT-PCR). In the second patient, we observed the same pattern of E-cadherin and β-catenin expression in the primary tumor, but in contrast, the carcinomatotic foci showed intense nuclear E-cadherin immunostaining (C), a complete absence of β-catenin expression (D), and a 13-fold increase in PS1 RNA expression (E).
We also studied PS1 expression in two SRCC patients showing differential subcellular distribution of E-cadherin. The primary tumor and carcinomatotic foci of one patient expressed moderate and membranous E-cadherin (Figure 9A), intense and mostly nuclear β-catenin (Figure 9B), and low PS1 RNA level (Figure 9E). The second SRCC patient showed the same pattern of E-cadherin and β-catenin expression in the primary tumor, but in contrast the carcinomatotic foci showed intense nuclear E-cadherin immunostaining (Figure 9C), complete absence of β-catenin expression (Figure 9D), and a 13-fold increase in PS1 RNA expression with respect to the primary tumor (Figure 9E).
Discussion
Unexpected Tumor Growth and Dissemination Induced by Snail1 or E-Cadherin Overexpression
In our model, the degree of epithelial differentiation observed in tumor cells correlated better with their genotype than with tumor environment. Thus, cultured cells, local tumors, and lymph node and peritoneal tumor foci in each group showed similar differentiation patterns. As reported, Snail1 overexpression repressed E-cadherin and correlated with an undifferentiated phenotype, whereas membranous E-cadherin expression was associated with differentiation,29 as assessed histologically, by PAS staining and CK20 immunostaining.
Although an inverse correlation between Snail1 and E-cadherin expression was found in all tumor tissues, we did not observe the anticipated metastatic phenotypes. Thus, tumors overexpressing E-cadherin did not show reduced invasiveness, growth, or metastatic rate, and they were not associated with good prognosis, as it could be expected if it was acting as a tumor suppressor. Likewise and in contrast with reports in breast and other cancers, Snail1-overexpressing tumors did not show increased invasiveness or metastatic rate, and they were not associated with poor prognosis.13–15 These results agree with previous observations that Snail1 expression in primary tumors does not have a prognostic value in sporadic colorectal cancer.16,17 Only the recent report by Francí et al (2009)18 has shown a correlation between Snail1 expression in the stroma of colon tumors and poor patient survival. The prognostic capacity of E-cadherin in colorectal cancer may require its analysis in both primary tumors and metastatic deposits. Thus, E-cadherin is often down-regulated in primary tumors, while it is re-expressed in metastases,7–10 frequently in the same patient.7,9 Moreover, whereas its down-regulation in the primary tumor associates with aggressiveness,7,8 high E-cadherin overexpression in liver or lymph node metastases associates with unfavorable outcome.8–10
Our unexpected finding of a dramatic increase in peritoneal foci growth in mice injected with E-cadherinOE cells as compared to low E-cadherin–expressing Mock cells, and the lack of peritoneal foci development in mice injected with Snail1 overexpressing cells suggest the existence of mechanisms of tumorigenesis additional to the previously proposed for these proteins. The requirement of E-cadherin expression for peritoneal localization agrees with data in ovarian cancer30 and may preclude Snail1 cell colonization of this site. Alternatively, the growth of Snail1OE cells may be limited by the capacity of Snail1 to attenuate the cell cycle progression,12 which could explain the lack of peritoneal tumor foci or the reduced lymph node foci growth in this group. Therefore, although Snail1 may increase resistance to death, invasiveness, and dissemination,12 this effect may not directly translate into growth at the colonized site.
E-Cadherin Gain of Oncogenic Function in Peritoneal Carcinomatotic Foci
Our observation of nuclear E-cadherin expression in E-cadherinOE carcinomatic foci has also been reported in a few human colorectal primary tumors and hepatic metastases, and it is highly prevalent in other tumors.31–34 Its functional implications, nevertheless, remain unexplored. We found nuclear β-catenin in local tumors and lymph node foci derived from Mock and Snail1OE cells, and in peritoneal tumor foci generated from Mock cells. However, we found E-cadherin rather than β-catenin in the nuclei of peritoneal foci derived from E-cadherinOE cells. These foci showed aggressive growth, suggesting that nuclear E-cadherin translocation may represent the gain of an oncogenic function. It is also consistent with the ability of nuclear E-cadherin to activate a non-canonical Wnt pathway.28
The enhanced oncogenic function of E-cadherin observed in peritoneal foci derived from E-cadherinOE cells may relate to the ability of the E-cadherin cytosolic tail to activate a transcription program other than the β-catenin-dependent Wnt pathway. This hypothesis agrees with the competition in vitro between E-cadherin cytosolic tail and Lef1 for binding to β-catenin35 leading to the suppression of Lef1-mediated transactivation in SW480 cells.36
Role of E-Cadherin in Colorectal Cancer
To date, the role of E-cadherin in colorectal cancer has not been completely dissected. We propose that E-cadherin may play a tumor suppressor role or an oncogenic role in colorectal tumorigenesis depending on its degree of proteolysis, which is determined by tumor environment. Its effect may depend on the relative abundance of full-length and proteolyzed E-cadherin cytosolic species within the tumor cell.
If full-length E-cadherin predominates, tumorigenesis will be inhibited by high intercellular adhesion that restricts invasion and migration. Consistently, its deletion or down-regulation in animal models4 or in humans7 inhibits intercellular adhesion and promotes tumorigenesis by activating the Wnt/β-catenin and other signaling pathways.3,37 Accordingly, an association exists between increased membranous E-cadherin expression in human primary colorectal tumors and favorable outcome.8
If cytosolic E-cadherin predominates over full-length E-cadherin, which would occur after E-cadherin proteolysis, the cytosolic fragment would translocate to the nucleus and, if it is accumulated at a sufficient amount, it may activate an oncogenic program. This is consistent with the previously reported induction of lymph node metastases by ectopic expression of E-cadherin cytosolic fragment in a mouse model. The authors found that the overexpression of the cytosolic fragment induces subcellular redistribution and destabilization of endogenous full-length E-cadherin.4 It is also in agreement with the reported changes in the ratio of membranous and cytosolic E-cadherin depending on the metastatic site of colon tumors,8 with the observation of nuclear E-cadherin in a few colorectal primary tumors and hepatic metastases,31 and with the increased cytosolic E-cadherin expression found in metastases and its association with tumor recurrence in colorectal cancer patients.8
In our model, the ratio between full-length and proteolyzed cytosolic E-cadherin changes with the environment. Thus, depending on the organ where the tumor grew the dramatic oncogenic effect was observed or not. This effect is probably related to the amount of active Presenilin1 present in each environment and with the total expression of E-cadherin of the cells. Thus, primary tumors and lymph node metastases did not differ in number or size between Mock and E-cadherinOE groups because in both cases the level of cytosolic E-cadherin is low. In contrast, in E-cadherinOE carcinomatotic foci the levels of cytosolic E-cadherin predominates over full-length E-cadherin, leading to E-cadherin nuclear translocation and to a dramatic increase in the size and number of metastatic foci. However, the amount of E-cadherin cytosolic fragment in Mock carcinomatotic foci is significantly lower than in those of E-cadherinOE group, and accordingly the size of peritoneal carcinomatosis in the Mock group was significantly reduced.
To explain the uncommon association between the high growth rate and a well-differentiated phenotype38 occurring in peritoneal tumor foci derived from E-cadherinOE cells, we postulate that membranous full-length E-cadherin promotes differentiation, while nuclear E-cadherin cytosolic tail stimulates tumor growth.
On the other hand, the association between high levels of proteolytically active PS1, proteolyzed E-cadherin, and nuclear E-cadherin in peritoneal foci of the E-cadherinOE group, as compared to peritoneal foci in the Mock group, identifies PS1 as a candidate protease for E-cadherin cleavage, at least in our model. Remarkably, PS1 cleaves E-cadherin in different cell types,28,39 including SW480-ADH cells, and inhibits β-catenin/TCF transcriptional activity.24
Environment-Dependent Regulation of Tumor Growth
Several observations support an environment-dependent regulation of tumor cells in our system:
-
1)
The limited tumor foci growth observed in lymph node and peritoneal foci deriving from Snail1OE cells as compared with foci in Mock or E-cadherinOE group, while local tumor growth rate was similar in the three groups.
-
2)
The positive correlation between E-cadherin expression and foci growth in the peritoneum was not observed in the lymph node or colon microenvironment.
-
3)
E-cadherin proteolysis and nuclear translocation occurred exclusively in peritoneal foci but not in local tumors, lymph node foci, or cultured cells.
We postulate that the peritoneal environment may trigger a gain of oncogenic function for E-cadherin by enhancing both its expression and proteolysis in tumor cells. This would lead to an increased pool of cytosolic E-cadherin fragments, which may translocate to the nucleus, activate transcription, and induce aggressive growth. Putatively, only tumor cells already expressing a high level of E-cadherin (E-cadherinOE cells) would generate sufficient proteolyzed cytosolic species to cause detectable E-cadherin nuclear accumulation. The low E-cadherin–expressing Mock foci may not have reached this threshold.
Our proposal is consistent with γ-secretase cleavage of E-cadherin triggering E-cadherin nuclear translocation, in a similar manner to the regulated intramembranous proteolysis of type I transmembrane proteins.40 An oncogenic effect in colorectal carcinoma has also been recently demonstrated for EpCAM, another epithelial-specific cell adhesion molecule, through its overexpression, regulated intramembrane proteolysis, and nuclear translocation.41,42 In addition, our proposal agrees with the tissue-specific pattern of metalloproteinases expression43 and with the association of metalloproteinases with colorectal cancer prognosis.44
Relevance of the Model and Clinical Implications
Our findings in colorectal cancer patients further support our proposal of an environment-dependent oncogenic effect for E-cadherin, which could be mediated by the proteolytic activity of PS1. In the peritoneal metastases of a SRCC patient we found a remarkable increase in PS1 mRNA levels, together with nuclear E-cadherin expression and absence of nuclear β-catenin. The patient's primary tumor, however, displayed low PS1 mRNA levels and the expected pattern of nuclear β-catenin and cytosolic/membranous E-cadherin. The fact that SRCC is an aggressive metastatic tumor45 is consistent with our observations in the mouse model. Our model allows the mechanistic dissection of peritoneal carcinomatosis in colorectal cancer in just three months. Unlike previous colorectal cancer models,46 it replicates the peritoneal carcinomatotic progression observed in clinical practice.47 This could be a good model for colorectal signet-ring cell carcinoma. In addition, our results support the need to explore whether or not the E-cadherin nuclear translocation observed in a small proportion of hepatic metastases of sporadic colorectal carcinomas that overexpress E-cadherin31 associates with increased PS1 expression.
In summary, we generated an animal model to study the role of Snail1 and E-cadherin in colorectal cancer metastagenesis. We observed an enhanced oncogenic effect in peritoneal foci which could be mediated through E-cadherin overexpression, coupled to its cleavage by PS1 and the generation of E-cadherin cytosolic fragments. These fragments could translocate to the nucleus and activate a transcription program that may lead to aggressive growth and animal death. Our results suggest that E-cadherin overexpression may induce colorectal cancer metastases, at least in the peritoneal tissue, a function to be added to its known tumor-suppressor or metastasis-suppressor role through the inhibition of invasion and epithelial-to-mesenchymal transition.48 Our results also suggest that the design and use of new therapies directed to block PS1 expression or activity may improve prognosis and outcome in metastatic colorectal signet-ring cell cancer.
Acknowledgements
We thank Antonio García de Herreros for providing us with an anti-Snail1 antibody, Albert Lleó for control cells for the PS1 analysis, and Carmen Cabrera and Mónica Gómez for excellent technical assistance.
Footnotes
Supported by grants from the Ministerio de Ciencia e Innovación (FISPI061294; SAF2008-04702, PS09/00965, CIBER-BBN, CB06/01/1031), and the Generalitat de Catalunya (2009-SGR-1437) (R.M.) and from Ministerio de Ciencia e Innovación (SAF2007-60341; ISCIII-RETIC RD06/0020/0009) and Comunidad de Madrid (S-GEN-0266/2006) (A.M.).
Supplemental material for this article can be found on http://ajp.amjpathol.org.
Web Extra Material
Environment-dependent regulation of E-cadherin and Presenilin1 (PS1) at the different tumor sites in the mouse model and in vitro
References
- 1.DeVita VT, Jr, Lawrence TS, Rosenberg SA. Cancer: Principles & Practice of Oncology. Eighth edition. Lippincott Williams & Wilkins; Philadelphia, PA: 2008. pp. 1144–1197. [Google Scholar]
- 2.Guyot F, Faivre J, Manfredi S, Meny B, Bonithon-Kopp C, Bouvier AM. Time trends in the treatment and survival of recurrences from colorectal cancer. Ann Oncol. 2005;16:756–761. doi: 10.1093/annonc/mdi151. [DOI] [PubMed] [Google Scholar]
- 3.Nelson WJ, Nusse R. Convergence of Wnt, beta-catenin, and cadherin pathways. Science. 2004;303:1483–1487. doi: 10.1126/science.1094291. [DOI] [PMC free article] [PubMed] [Google Scholar]
- 4.Perl AK, Wilgenbus P, Dahl U, Semb H, Christofori G. A causal role for E-cadherin in the transition from adenoma to carcinoma. Nature. 1998;392:190–193. doi: 10.1038/32433. [DOI] [PubMed] [Google Scholar]
- 5.Becker KF, Atkinson MJ, Reich U, Becker I, Nekarda H, Siewert JR, Höfler H. E-cadherin gene mutations provide clues to diffuse type gastric carcinomas. Cancer Res. 1994;54:3845–3852. [PubMed] [Google Scholar]
- 6.Bringuier PP, Umbas R, Schaafsma HE, Schaafsma HE, Karthaus HF, Debruyne FM, Schalken JA. Decreased E-cadherin immunoreactivity correlates with poor survival in patients with bladder tumors. Cancer Res. 1993;53:3241–3245. [PubMed] [Google Scholar]
- 7.Dorudi S, Sheffield JP, Poulsom R, Northover JM, Hart IR. E-cadherin expression in colorectal cancer. An immunocytochemical and in situ hybridization study. Am J Pathol. 1993;142:981–986. [PMC free article] [PubMed] [Google Scholar]
- 8.Elzagheid A, Algars A, Bendardaf R, Lamlum H, Ristamaki R, Collan Y, Syrjanen K, Pyrhonen S. E-cadherin expression pattern in primary colorectal carcinomas and their metastases reflects disease outcome. World J Gastroenterol. 2006;12:4304–4309. doi: 10.3748/wjg.v12.i27.4304. [DOI] [PMC free article] [PubMed] [Google Scholar]
- 9.Batistatou A, Charalabopoulos AK, Scopa CD, Nakanishi Y, Kappas A, Hirohashi S, Agnantis NJ, Charalabopoulos K. Expression patterns of dysadherin and E-cadherin in lymph node metastases of colorectal carcinoma. Virchows Arch. 2006;448:763–767. doi: 10.1007/s00428-006-0183-8. [DOI] [PubMed] [Google Scholar]
- 10.Ikeguchi M, Makino M, Kaibara N. Clinical significance of E-cadherin-catenin complex expression in metastatic foci of colorectal carcinoma. J Surg Oncol. 2001;77:201–207. doi: 10.1002/jso.1095. [DOI] [PubMed] [Google Scholar]
- 11.Cano A, Pérez-Moreno MA, Rodrigo I, Locascio A, Blanco MJ, del Barrio MG, Portillo F, Nieto MA. The transcription factor snail controls epithelial-mesenchymal transitions by repressing E-cadherin expression. Nat Cell Biol. 2000;2:76–83. doi: 10.1038/35000025. [DOI] [PubMed] [Google Scholar]
- 12.Vega S, Morales AV, Ocaña OH, Valdés F, Fabregat I, Nieto MA. Snail blocks the cell cycle and confers resistance to cell death. Genes Dev. 2004;18:1131–1143. doi: 10.1101/gad.294104. [DOI] [PMC free article] [PubMed] [Google Scholar]
- 13.Blanco MJ, Moreno-Bueno G, Sarrió D, Locascio A, Cano A, Palacios J, Nieto MA. Correlation of Snail expression with histological grade and lymph node status in breast carcinomas. Oncogene. 2002;21:3241–3246. doi: 10.1038/sj.onc.1205416. [DOI] [PubMed] [Google Scholar]
- 14.Elloul S, Elstrand MB, Nesland JM, Tropé CG, Kvalheim G, Goldberg I, Reich R, Davidson B. Snail. Slug, and Smad-interacting protein 1 as novel parameters of disease aggressiveness in metastatic ovarian and breast carcinoma. Cancer. 2005;103:1631–1643. doi: 10.1002/cncr.20946. [DOI] [PubMed] [Google Scholar]
- 15.Peinado H, Olmeda D, Cano A. Snail. Zeb and bHLH factors in tumour progression: an alliance against the epithelial phenotype? Nat Rev Cancer. 2007;7:415–428. doi: 10.1038/nrc2131. [DOI] [PubMed] [Google Scholar]
- 16.Peña C, García JM, Silva J, García V, Rodríguez R, Alonso I, Millán I, Salas C, García de Herreros A, Muñoz A, Bonilla F. E-cadherin and vitamin D receptor regulation by SNAIL and ZEB1 in colon cancer: clinicopathological correlations. Hum Mol Genet. 2005;14:3361–3370. doi: 10.1093/hmg/ddi366. [DOI] [PubMed] [Google Scholar]
- 17.Roy HK, Smyrk TC, Koetsier J, Victor TA, Wali RK. The transcriptional repressor SNAIL is overexpressed in human colon cancer. Dig Dis Sci. 2005;50:42–46. doi: 10.1007/s10620-005-1275-z. [DOI] [PubMed] [Google Scholar]
- 18.Francí C, Gallén M, Alameda F, Baró T, Iglesias M, Virtanen I, García de Herreros A. Snail1 protein in the stroma as a new putative prognosis marker for colon tumours. PLoS One. 2009;4:e5595. doi: 10.1371/journal.pone.0005595. [DOI] [PMC free article] [PubMed] [Google Scholar]
- 19.Céspedes MV, Espina C, García-Cabezas MA, Trias M, Boluda A, Gómez del Pulgar MT, Sancho FJ, Nistal M, Lacal JC, Mangues R. Orthotopic microinjection of human colon cancer cells in nude mice induces tumor foci in all clinically relevant metastatic sites. Am J Pathol. 2007;170:1077–1085. doi: 10.2353/ajpath.2007.060773. [DOI] [PMC free article] [PubMed] [Google Scholar]
- 20.Espina C, Céspedes MV, García-Cabezas MA, del Pulgar MT, Boluda A, Oroz LG, Cejas P, Nistal M, Mangues R, Lacal JC. A critical role for Rac1 in tumor progression of human colorectal adenocarcinoma cells. Am J Pathol. 2008;172:156–166. doi: 10.2353/ajpath.2008.070561. [DOI] [PMC free article] [PubMed] [Google Scholar]
- 21.Pálmer HG, González-Sancho JM, Espada J, Berciano MT, Puig I, Baulida J, Quintanilla M, Cano A, García de Herreros A, Lafarga M, Muñoz A. Vitamin D3 promotes the differentiation of colon carcinoma cells by the induction of E-cadherin and the inhibition of beta-catenin signaling. J Cell Biol. 2001;154:369–387. doi: 10.1083/jcb.200102028. [DOI] [PMC free article] [PubMed] [Google Scholar]
- 22.Pálmer HG, Larriba MJ, García JM, Ordóñez-Morán P, Peña C, Peiró S, Puig I, Rodríguez R, de la Fuente R, Bernad A, Pollán M, Bonilla F, Gamallo C, García de Herreros A, Muñoz A. The transcription factor SNAIL represses vitamin D receptor expression and responsiveness in human colon cancer. Nat Med. 2004;10:917–919. doi: 10.1038/nm1095. [DOI] [PubMed] [Google Scholar]
- 23.Gottardi CJ, Wong E, Gumbiner BM. E-cadherin suppresses cellular transformation by inhibiting beta-catenin signaling in an adhesion-independent manner. J Cell Biol. 2001;153:1049–1060. doi: 10.1083/jcb.153.5.1049. [DOI] [PMC free article] [PubMed] [Google Scholar]
- 24.Raurell I, Codina M, Casagolda D, Del Valle B, Baulida J, García de Herreros A, Duñach M. Gamma-secretase-dependent and –independent effects of presenillin1 on beta-catenin. Tcf-4 transcrriptional activity. PLoS One. 2008;e4080:1–12. doi: 10.1371/journal.pone.0004080. 3. [DOI] [PMC free article] [PubMed] [Google Scholar]
- 25.Aguilera O, Peña C, García JM, Larriba MJ, Ordóñez-Morán P, Navarro D, Barbáchano A, López de Silanes I, Ballestar E, Fraga MF, Esteller M, Gamallo C, Bonilla F, González-Sancho JM, Muñoz A. The Wnt antagonist DICKKOPF-1 gene is induced by 1alpha, 25-dihydroxyvitamin D3 associated to the differentiation of human colon cancer cells. Carcinogenesis. 2007;28:1877–1884. doi: 10.1093/carcin/bgm094. [DOI] [PubMed] [Google Scholar]
- 26.Cespedes MV, Sancho FJ, Guerrero S, Parreno M, Casanova I, Pavon MA, Marcuello E, Trias M, Cascante M, Capella G, Mangues R. K-ras Asp12 mutant neither interacts with Raf, nor signals through Erk and is less tumorigenic than K-ras Val12. Carcinogenesis. 2006;27:2190–2200. doi: 10.1093/carcin/bgl063. [DOI] [PubMed] [Google Scholar]
- 27.Pavón MA, Parreño M, León X, Sancho FJ, Céspedes MV, Casanova I, Lopez-Pousa A, Mangues MA, Quer M, Barnadas A, Mangues R. Ku70 predicts response and primary tumor recurrence after therapy in locally advanced head and neck cancer. Int J Cancer. 2008;123:1068–1079. doi: 10.1002/ijc.23635. [DOI] [PubMed] [Google Scholar]
- 28.Ferber EC, Kajita M, Wadlow A, Tobiansky L, Niessen C, Ariga H, Daniel J, Fujita Y. A role for the cleaved cytoplasmic domain of E-cadherin in the nucleus. J Biol Chem. 2008;283:12691–12700. doi: 10.1074/jbc.M708887200. [DOI] [PMC free article] [PubMed] [Google Scholar]
- 29.Mariadason JM, Bordonaro M, Aslam F, Shi L, Kuraguchi M, Velcich A, Augenlicht LH. Down-regulation of beta-catenin TCF signaling is linked to colonic epithelial cell differentiation. Cancer Res. 2001;61:3465–3471. [PubMed] [Google Scholar]
- 30.Imai T, Horiuchi A, Shiozawa T, Osada R, Kikuchi N, Ohira S, Oka K, Konishi I. Elevated expression of E-cadherin and alpha-, beta-, and gamma-catenins in metastatic lesions compared with primary epithelial ovarian carcinomas. Hum Pathol. 2004;35:1469–1476. doi: 10.1016/j.humpath.2004.09.014. [DOI] [PubMed] [Google Scholar]
- 31.Salahshor S, Naidoo R, Serra S, Shih W, Tsao MS, Chetty R, Woodgett JR. Frequent accumulation of nuclear E-cadherin and alterations in the Wnt signaling pathway in esophageal squamous cell carcinomas. Mod Pathol. 2008;21:271–281. doi: 10.1038/modpathol.3800990. [DOI] [PubMed] [Google Scholar]
- 32.Han AC, Soler AP, Tang CK, Knudsen KA, Salazar H. Nuclear localization of E-cadherin expression in Merkel cell carcinoma. Arch Pathol Lab Med. 2000;124:1147–1151. doi: 10.5858/2000-124-1147-NLOECE. [DOI] [PubMed] [Google Scholar]
- 33.Chetty R, Serra S. Membrane loss and aberrant nuclear localization of E-cadherin are consistent features of solid pseudopapillary tumour of the pancreas. An immunohistochemical study using two antibodies recognizing different domains of the E-cadherin molecule. Histopathology. 2008;52:325–330. doi: 10.1111/j.1365-2559.2007.02949.x. [DOI] [PubMed] [Google Scholar]
- 34.Natalwala A, Spychal R, Tselepis C. Epithelial-mesenchymal transition mediated tumourigenesis in the gastrointestianl tract. World J Gastroenterol. 2008;14:3792–3797. doi: 10.3748/wjg.14.3792. [DOI] [PMC free article] [PubMed] [Google Scholar]
- 35.Orsulic S, Huber O, Aberle H, Arnold S, Kemler R. E-cadherin binding prevents beta-catenin nuclear localization and beta-catenin/LEF-1-mediated transactivation. J Cell Sci. 1999;112:1237–1245. doi: 10.1242/jcs.112.8.1237. [DOI] [PubMed] [Google Scholar]
- 36.Sadot E, Simcha I, Shtutman M, Ben-Ze'ev A, Geiger B. Inhibition of beta-catenin-mediated transactivation by cadherin derivatives. Proc Natl Acad Sci USA. 1998;95:15339–15344. doi: 10.1073/pnas.95.26.15339. [DOI] [PMC free article] [PubMed] [Google Scholar]
- 37.Shitashige M, Satow R, Honda K, Ono M, Hirohashi S, Yamada T. Regulation of Wnt signaling by the nuclear pore complex. Gastroenterology. 2008;134:1961–1971. doi: 10.1053/j.gastro.2008.03.010. [DOI] [PubMed] [Google Scholar]
- 38.Corn PG, El-Deiry WS. Derangement of growth and differentiation control in oncogenesis. Bioessays. 2002;24:83–90. doi: 10.1002/bies.10036. [DOI] [PubMed] [Google Scholar]
- 39.Marambaud P, Shioi J, Serban G, Georgakopoulos A, Sarner S, Nagy V, Baki L, Wen P, Efthimiopoulos S, Shao Z, Wisniewski T, Robakis NK. A presenilin-1/gamma-secretase cleavage releases the E-cadherin intracellular domain and regulates disassembly of adherens junctions. EMBO J. 2002;21:1948–1956. doi: 10.1093/emboj/21.8.1948. [DOI] [PMC free article] [PubMed] [Google Scholar]
- 40.Brown MS, Ye J, Rawson RB, Goldstein JL. Regulated intramembrane proteolysis: a control mechanism conserved from bacteria to humans. Cell. 2000;100:391–398. doi: 10.1016/s0092-8674(00)80675-3. [DOI] [PubMed] [Google Scholar]
- 41.Maetzel D, Denzel S, Mack B, Canis M, Went P, Benk M, Kieu C, Papior P, Baeuerle PA, Munz M, Gires O. Nuclear signalling by tumour-associated antigen EpCAM. Nat Cell Biol. 2009;11:162–171. doi: 10.1038/ncb1824. [DOI] [PubMed] [Google Scholar]
- 42.Munz M, Baeuerle PA, Gires O. The emerging role of EpCAM in cancer and stem cell signaling. Cancer Res. 2009;69:5627–5629. doi: 10.1158/0008-5472.CAN-09-0654. [DOI] [PubMed] [Google Scholar]
- 43.Nuttall RK, Sampieri CL, Pennington CJ, Gill SE, Schultz GA, Edwards DR. Expression analysis of the entire MMP and TIMP gene families during mouse tissue development. FEBS Lett. 2004;563:129–134. doi: 10.1016/S0014-5793(04)00281-9. [DOI] [PubMed] [Google Scholar]
- 44.Munshi HG, Stack MS. Reciprocal interactions between adhesion receptor signaling and MMP regulation. Cancer Metastasis Rev. 2006;25:45–56. doi: 10.1007/s10555-006-7888-7. [DOI] [PubMed] [Google Scholar]
- 45.Makino T, Tsujinaka T, Mishima H, Ikenaga M, Sawamura T, Nakamori S, Fujitani K, Hirao M, Kashiwazaki M, Masuda N, Takeda M, Mano M. Primary signet-ring cell carcinoma of the colon and rectum: report of eight cases and review of 154 Japanese cases. Hepatogastroenterology. 2006;53:845–849. [PubMed] [Google Scholar]
- 46.Fu XY, Besterman JM, Monosov A, Hoffman RM. Models of human metastatic colon cancer in nude mice orthotopically constructed by using histologically intact patient specimens. Proc Natl Acad Sci USA. 1991;88:9345–9349. doi: 10.1073/pnas.88.20.9345. [DOI] [PMC free article] [PubMed] [Google Scholar]
- 47.Jayne D. Molecular biology of peritoneal carcinomatosis. Cancer Treat Res. 2007;134:21–33. doi: 10.1007/978-0-387-48993-3_2. [DOI] [PubMed] [Google Scholar]
- 48.Bodenstine TM, Welch DR. Metastasis suppressors and the tumor microenvironment. Cancer Microenviron. 2008;1:1–11. doi: 10.1007/s12307-008-0001-8. [DOI] [PMC free article] [PubMed] [Google Scholar]
Associated Data
This section collects any data citations, data availability statements, or supplementary materials included in this article.
Supplementary Materials
Environment-dependent regulation of E-cadherin and Presenilin1 (PS1) at the different tumor sites in the mouse model and in vitro