

Abstract
We conducted a genome-wide association study of gastric cancer (GC) and esophageal squamous cell carcinoma (ESCC) in ethnic Chinese subjects in which we genotyped 551,152 single nucleotide polymorphisms (SNPs). We report a combined analysis of 2,240 GC cases, 2,115 ESCC cases, and 3,302 controls drawn from five studies. In logistic regression models adjusted for age, sex, and study, multiple variants at 10q23 had genome-wide significance for GC and ESCC independently. A notable signal was rs2274223, a nonsynonymous SNP located in PLCE1, for GC (P=8.40×10⁻⁹; per allele odds ratio (OR) = 1.31) and ESCC (P=3.85×10⁻⁹; OR = 1.34). The association with GC differed by anatomic subsite. For tumors located in the cardia the association was stronger (P=4.19 × 10⁻¹⁵; OR= 1.57) and for those located in the noncardia stomach it was absent (P=0.44; OR=1.05). Our findings at 10q23 could provide insight into the high incidence rates of both cancers in China.
Gastric cancer and esophageal cancer cause more than 700,000 and 400,000 deaths respectively each year, and represent the 2nd and 6th leading causes of cancer death worldwide1. For GC, infection with Helicobacter pylori is the primary etiologic factor in all populations, although the majority of infected individuals do not develop cancer. Smoking tobacco and drinking alcoholic beverages explain nearly 90% of ESCC cases in the United States and other Western countries2, but these exposures represent minor factors in high-risk populations in China3 and elsewhere4. Risk factors for ESCC in populations with high incidence rates include family history5 and dietary deficiencies6, but a large proportion of the etiology in these populations remains unexplained. GC and ESCC occur in the Taihang Mountains of North-Central China at some of the highest rates reported for any cancer7; over 20% of all deaths in this area have been attributed to these cancers8, 9. However, the causes of the high rates and of the geographic correlation of these two anatomically adjacent but histologically distinct tumors have not been determined. The gastric cancers in this area occur primarily in the uppermost portion of the stomach (proximal 3 cm) and are referred to as gastric cardia cancers, while those in the remainder of the stomach are referred to as gastric noncardia cancers. In most other parts of China gastric noncardia cancers are the predominant upper gastrointestinal tract tumors10.
To investigate the genetic contribution to these highly fatal diseases in ethnic Chinese subjects, we conducted parallel genome-wide association studies (GWAS) for GC and ESCC with shared controls. Using the Illumina 660W Quad chip, we scanned 4,987 samples from the case-control and case-only components of the Shanxi Upper Gastrointestinal Cancer Genetics Project (Shanxi) and 1,389 samples from a prospective cohort, the Linxian Nutrition Intervention Trials (NIT); both studies were conducted in the Taihang Mountains (Supplementary Table 1). After quality control metrics were applied (Online Methods), 551,152 SNPs were analyzed in 1,625 cases of GC, 1,898 cases of ESCC and 2,100 controls. 12,000 SNPs with minimal linkage disequilibrium (pair-wise r2 < 0.004) were used to test for differences in population substructure11 and did not demonstrate significant evidence for population substructure within study (data not shown). In a second phase, we optimized TaqMan assays to genotype eight SNPs that were significant in the genome-wide phase for GC, ESCC, or both in an independent set of subjects (615 GC, 217 ESCC and 1202 controls) from the Shanxi and NIT studies and three additional prospective cohorts (The Shanghai Men's Health Study, the Shanghai Women's Health Study, and the Singapore Chinese Cohort Study) (Supplementary Table 1). For these eight SNPs, we conducted a combined analysis of 2,240 GC cases, 2,115 ESCC cases, and 3,302 controls (details in Supplementary Table 1).
The results of the initial GWAS for GC and ESCC, which were analyzed independently, are presented as Manhattan plots in Supplementary Figure 1 using P-values from 1 df trend tests in logistic regression models adjusted for age, sex, and study. We found independent genome-wide significant associations at chromosome 10q23 for both GC and ESCC (Tables 1 and 2, Fig. 1). For GC, an association initially observed at chromosome 1q22 was not supported in the combined data (Table 1); additional studies are required to determine if this locus contributes to risk for GC in ethnic Chinese.
Table 1.
Association between SNPs at 10q23 and 1q22 and risk for gastric cancer in all cases and by anatomic location within the stomach
| Genome-wide phase | Second phase | Combined | ||||||
|---|---|---|---|---|---|---|---|---|
| Cancer group and chromosome location | NCBI dbSNP identifier (major, minor allele) | MAF Controls, Cases combined | P1df score | OR (95%CI) per allele | P1df score | OR (95%CI) per allele | P1df score | OR (95%CI) per allele |
| Total Gastric | Controls/Cases 2100/1625 | Controls/Cases 1202/615 | Controls/Cases 3302/2240 | |||||
| 10q23 | rs2274223 (A, G) | 0.209, 0.259 | 2.33 × 10⁻⁹ | 1.40 (1.25–1.56) | 0.12 | 1.15 (0.97–1.36) | 8.40 × 10⁻⁹ | 1.31 (1.19–1.43) |
| rs3765524 (C, T) | 0.207, 0.259 | 2.78 × 10⁻⁹ | 1.39 (1.25–1.56) | 0.079 | 1.17 (0.98–1.38) | 5.32 × 10⁻⁹ | 1.31 (1.20–1.44) | |
| rs3781264 (T, C) | 0.152, 0.199 | 3.94 × 10⁻¹¹ | 1.51 (1.33–1.70) | 0.40 | 1.09 (0.90–1.31) | 3.76 × 10⁻⁹ | 1.36 (1.23–1.50) | |
| rs11187842 (C, T) | 0.147, 0.190 | 3.65 × 10⁻¹⁰ | 1.48 (1.31–1.68) | 0.42 | 1.08 (0.89–1.31) | 2.53 × 10⁻⁸ | 1.34 (1.21–1.49) | |
| rs753724 (G, T) | 0.147, 0.190 | 2.65 × 10⁻¹⁰ | 1.49 (1.31–1.68) | 0.51 | 1.07 (0.88–1.30) | 2.74 × 10⁻⁸ | 1.34 (1.21–1.49) | |
| 1q22 | rs4072037 (A, G) | 0.159, 0.125 | 1.10 × 10⁻⁶ | 0.71 (0.62–0.82) | 0.083 | 0.84 (0.69–1.02) | 4.22 × 10⁻⁷ | 0.75 (0.67–0.84) |
| rs4460629 (C, T) | 0.142, 0.112 | 3.37 × 10⁻⁷ | 0.68 (0.59–0.79) | 0.34 | 0.91 (0.74–1.11) | 2.26 × 10⁻⁶ | 0.75 (0.67–0.85) | |
| Cardia | Controls/Cases 2100/1110 | Controls/Cases 1202/103 | Controls/Cases 3302/1213 | |||||
| 10q23 | rs2274223 (A, G) | 0.209, 0.291 | 5.88 × 10⁻¹⁴ | 1.59 (1.41–1.80) | 0.016 | 1.49 (1.08–2.07) | 4.19 × 10⁻¹⁵ | 1.57 (1.40–1.76) |
| rs3765524 (C, T) | 0.207, 0.289 | 9.94 × 10⁻¹⁴ | 1.59 (1.40–1.79) | 0.014 | 1.50 (1.08–2.08) | 7.36 × 10⁻¹⁵ | 1.56 (1.40–1.75) | |
| rs3781264 (T, C) | 0.152, 0.222 | 7.94 × 10⁻¹⁴ | 1.66 (1.45–1.90) | 0.17 | 1.29 (0.89–1.87) | 1.06 × 10⁻¹³ | 1.60 (1.41–1.81) | |
| rs11187842 (C, T) | 0.147, 0.211 | 1.44 × 10⁻¹² | 1.63 (1.42–1.87) | 0.25 | 1.25 (0.86–1.81) | 2.56 × 10⁻¹² | 1.56 (1.38–1.77) | |
| rs753724 (G, T) | 0.147, 0.210 | 1.61 × 10⁻¹² | 1.63 (1.42–1.87) | 0.49 | 1.15 (0.77–1.70) | 5.21 × 10⁻¹² | 1.56 (1.37–1.76) | |
| 1q22 | rs4072037 (A, G) | 0.159, 0.122 | 3.37 × 10⁻⁴ | 0.75 (0.65–0.88) | 0.18 | 0.74 (0.48–1.15) | 9.45 × 10⁻⁵ | 0.75 (0.65–0.87) |
| rs4460629 (C, T) | 0.142, 0.108 | 1.13 × 10⁻⁴ | 0.72 (0.61–0.85) | 0.58 | 0.89 (0.58–1.36) | 1.27 × 10⁻⁴ | 0.74 (0.64–0.86) | |
| Noncardia | Controls/Cases 2100/515 | Controls/Cases 1202/402 | Controls/Cases 3302/917 | |||||
| 10q23 | rs2274223 (A, G) | 0.209, 0.221 | 0.78 | 1.02 (0.86–1.22) | 0.34 | 1.10 (0.90–1.35) | 0.44 | 1.05 (0.93–1.20) |
| rs3765524 (C, T) | 0.207, 0.222 | 0.73 | 1.03 (0.87–1.22) | 0.25 | 1.12 (0.92–1.37) | 0.32 | 1.07 (0.94–1.21) | |
| rs3781264 (T, C) | 0.152, 0.171 | 0.094 | 1.18 (0.97–1.42) | 0.60 | 1.06 (0.85–1.33) | 0.14 | 1.11 (0.97–1.29) | |
| rs11187842 (C, T) | 0.147, 0.166 | 0.099 | 1.17 (0.97–1.42) | 0.55 | 1.07 (0.86–1.34) | 0.13 | 1.12 (0.97–1.29) | |
| rs753724 (G, T) | 0.147, 0.167 | 0.070 | 1.19 (0.99–1.44) | 0.53 | 1.08 (0.86–1.35) | 0.098 | 1.13 (0.98–1.30) | |
| 1q22 | rs4072037 (A, G) | 0.159, 0.126 | 7.26 × 10⁻⁶ | 0.60 (0.47–0.75) | 0.40 | 0.91 (0.73–1.14) | 5.74 × 10⁻⁵ | 0.72 (0.62–0.85) |
| rs4460629 (C, T) | 0.142, 0.115 | 1.53 × 10⁻⁵ | 0.59 (0.47–0.75) | 0.79 | 0.97 (0.77–1.22) | 5.38 × 10⁻⁴ | 0.75 (0.64–0.88) | |
Minor allele frequencies were computed from the combined phase. Results were derived from logistic regression models using genotype trend tests adjusted for age (10 year categories), sex, and study. The total of 2,240 gastric cancer cases included all cardia and noncardia cancers plus 110 unclassified gastric cancers which were added in the second phase.
Figure 1. Association results, recombination, and linkage disequilibrium plots for the region of 10q23 with genome-wide significance for gastric cancer (GC) and esophageal squamous cell carcinoma (ESCC).
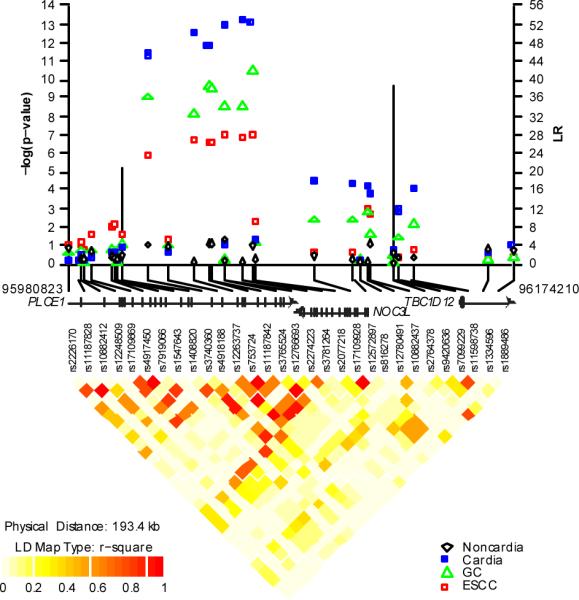
P-values were derived from 1 df trend tests in logistic regression models adjusted for age, sex, and study and are shown with the LR values for putative recombination hotspots using SequenceLDhot (vertical bars). Pair-wise r2 are displayed at the bottom for all SNPs included in the GWAS analysis. Coordinates refer to genome Build 36.1. The figure depicts a region of chromosome 10q23 (95,980,823- 96,174,210) that includes the PLCE1 gene and the different symbols indicate the four different endpoints of total GC, gastric cardia cancers, gastric noncardia cancers, or ESCC.
At 10q23, we analyzed a set of five correlated SNPs in both GC and ESCC, including two nonsynonymous variants. The strongest association for GC was with rs3781264 (P = 3.76 × 10⁻⁹; per allele OR= 1.36, 95% c.i. 1.23–1.50). The other four SNPs at 10q23 also showed genome-wide significance (Table 1). The associations differed when gastric cancers were divided into the two anatomic subsites. The strongest association for gastric cardia cancer was rs2274223 (P = 4.19 × 10⁻¹⁵; OR = 1.57, 95% c.i. 1.40–1.76,), but there was no association for gastric noncardia cancers (P = 0.44; OR = 1.05, 95% c.i. 0.93 – 1.20). rs2274223 and other SNPs at 10q23 also showed genome-wide significance with ESCC (P = 3.85 × 10⁻⁹; OR = 1.34, 95% c.i. 1.22–1.48) (Table 2). We found consistent results when comparing the two studies from the high incidence areas of the Taihang Mountains (Supplementary Table 2). The five SNPs at 10q23, which have strong pair-wise LD (r2 from 0.62 to 0.98 in controls), map to the Phospholipase C ε 1 gene (PLCE1) that lies adjacent to the nucleolar complex associated 3 homolog gene (NOC3L) (Fig. 1).
Table 2.
Association between SNPs at 22q12and 10q23 and risk for esophageal squamous cell carcinoma
| Genome-wide phase | Second phase | Combined | ||||||
|---|---|---|---|---|---|---|---|---|
| Chromosome location | NCBI dbSNP identifier (major, minor allele) | MAF Controls, Cases combined | P1df score | OR (95%CI) per allele | P1df score | OR (95%CI) per allele | P1df score | OR (95%CI)per allele |
| ESCC | Controls/Cases 2100/1898 | Controls/Cases 1202/217 | Controls/Cases 3302/2115 | |||||
| 10q23 | rs2274223 (A, G) | 0.209, 0.259 | 1.19 × 10⁻⁷ | 1.33 (1.20–1.48) | 2.13 × 10⁻⁴ | 1.59 (1.24–2.05) | 3.85 × 10⁻⁹ | 1.34 (1.22–1.48) |
| rs3765524 (C, T) | 0.207, 0.258 | 9.42 × 10⁻⁸ | 1.34 (1.20–1.49) | 6.01 × 10⁻⁵ | 1.66 (1.29–2.12) | 1.74 × 10⁻⁹ | 1.35 (1.22–1.49) | |
| rs3781264 (T, C) | 0.152, 0.194 | 1.15 × 10⁻⁷ | 1.38 (1.22–1.55) | 7.92 × 10⁻⁴ | 1.60 (1.21–2.11) | 7.30 × 10⁻⁹ | 1.38 (1.23–1.53) | |
| rs11187842 (C, T) | 0.147, 0.187 | 2.67 × 10⁻⁷ | 1.37 (1.21–1.54) | 3.91 × 10⁻⁴ | 1.64 (1.25–2.17) | 1.20 × 10⁻⁸ | 1.37 (1.23–1.53) | |
| rs753724 (G, T) | 0.147, 0.187 | 2.23 × 10⁻⁷ | 1.37 (1.22–1.55) | 5.13 × 10⁻⁴ | 1.63 (1.24–2.16) | 1.15 × 10⁻⁸ | 1.38 (1.23–1.54) | |
| 22q12 | rs738722 (C, T) | 0.254, 0.308 | 5.67 × 10⁻⁸ | 1.32 (1.19–1.45) | 0.14 | 1.20 (0.94–1.53) | 1.41 × 10⁻⁸ | 1.30 (1.19–1.43) |
Minor allele frequencies were computed from the combined phase. Results were derived from logistic regression models using genotype trend tests adjusted for age (10 year categories), sex, and study.
The SNPs that showed significant associations for GC and ESCC at 10q23 in the PLCE1 gene included two SNPs that result in missense mutations in the coding region, rs2274223 (Arg1927His) and rs3765524 (Ile1777Thr). Further work is required to determine if either of these SNPs is functionally important, but the findings suggest a single locus associated with risk for both cancers. Notably, when gastric cancers were divided into the two distinct anatomic locations, the association was restricted to tumors of the cardia (Table 1).
PLCE1 is a member of the phospoholipase C family of proteins and, uniquely within this family, it interacts with the proto-oncogene ras12 among other proteins. Variants in PLCE1 are known to cause early-onset nephrotic syndrome in humans13, but this gene may also be linked to carcinogenic processes. PLCE1 knockout mice are resistant to the promoting effects of 12-O-tetradecanoylphorbol-13-acetate in 7,12-dimethylbenzanthracene-induced skin carcinogenesis14 and are resistant to intestinal tumor formation when crossed with APCmin/+ mice15. In addition, the SNPs reside in an area between two recombination hot spots that also includes NOC3L, which has been linked to control of DNA replication during mitotic clonal expansion16.
For ESCC, we initially observed an independent significant association with rs738722 at chromosome 22q12 (P = 5.67 × 10⁻⁸; OR = 1.32, 95% c.i. 1.19–1.45) (Table 2) in the first phase, but the association was not statistically significant in the second phase by itself. In the combined data the association remained strong (P = 1.41 × 10⁻⁸; OR = 1.30, 95% c.i. 1.19–1.43). This SNP maps to a region within the CHK2 checkpoint homolog gene (CHEK2), but is also in LD with regions of the Hsc B iron-sulfur cluster co-chaperone homolog gene (HSCB) (Supplementary Fig. 2). Previous studies of Caucasian populations have suggested an association between uncommon variants in CHEK2 (rs2267130 and rs17879961) and risk of upper aerodigestive tract cancers17, 18, but these SNPs were not included in our scan. Rare variants in CHEK2 have also been associated with susceptibility to breast19, colorectal, and other cancers20. This association appears promising, but with the lack of independent confirmation further studies are needed to validate it.
We also examined loci previously reported in a GWAS21 for GC (Supplementary Table 3). Specifically, we examined rs2920297 and rs2294008 at 8q24; both SNPs are in proximity to the prostate stem cell antigen gene (PSCA). We found no associations for GC, but when we restricted our analysis to gastric noncardia tumors, both SNPs showed associations of similar magnitude to those reported in a recent meta-analysis of East Asian studies22 (e.g. rs2294008 OR = 1.35, 95% c.i. 0.94–1.94). For ESCC, we also examined SNPs marking the alcohol-metabolizing genes ADH1B (rs1159918 and rs1042026) and ALDH2 (rs3782886 and rs671) that have been reported in candidate gene studies23 and in a GWAS24. Overall and in strata defined by alcohol drinking and tobacco smoking, we found no associations with these SNPs (Supplementary Table 4), perhaps due to the different environmental risk factors for ESCC in our study populations compared to previous studies with strong alcohol- and tobacco-related risks. In the Shanxi5 and NIT3 studies, the only two studies included in this portion of the analysis, alcoholic beverage and tobacco use are not major ESCC risk factors.
In summary, we conducted parallel genome-wide association studies for GC and ESCC in ethnic Chinese subjects. Variants at 10q23 in PLCE1 showed genome-wide significant associations for gastric cardia cancer and ESCC. These findings suggest that a common genetic mechanism may contribute to the etiology of both cancers. Fine mapping and sequencing in these loci will be required to determine the optimal genetic variants to be studied in laboratory systems to explain these association signals. Additional studies are needed to confirm and discover more loci associated with risk for GC and ESCC in populations in East Asia and elsewhere25.
ONLINE METHODS
Study participants
Study participants for the GWAS were drawn from two studies, the Shanxi Upper Gastrointestinal Cancer Genetics Project (Shanxi) and the Linxian Nutrition Intervention Trial (NIT), a prospective cohort. For the second phase, we genotyped additional subjects from Shanxi and NIT as well as subjects from the Shanghai Men's Health Study (SMHS), the Shanghai Women's Health Study (SMHS), and the Singapore Chinese Health Study (SCHS) (Supplementary Table 1). The Shanxi study controls were matched on age and sex for the case-control portion, while for the NIT controls were selected as a case-cohort and frequency matched on age and sex. For the SMHS, SWHS, and SCHS cohorts, controls were alive, free of upper gastrointestinal tract cancer, and matched to cases as described in Supplementary Table 1. For the Shanxi and NIT study, tumor anatomic location was known for all cases and >85% of cases had pathologic confirmation. For the three cohorts added in the second phase, the proportion with anatomic location in the stomach is given in Supplementary Table 1 and pathologic confirmation was available for >95% of cases. All examined esophageal cancers were squamous cell carcinomas (ESCC) and all examined gastric cancers (GC) were adenocarcinomas. Cardia cancers were located in the proximal 3 cm of the stomach, while noncardia cancers were those in the remainder of the stomach. Gastric cancers without location information were included in total GC analyses but excluded from GC anatomic subsite analyses.
Each of the five participating studies obtained informed consent from subjects and from their studies Institutional Review Board(s). The NCI Special Studies-Institutional Review Board approved the overall GWAS study.
Genotyping and quality control
Genome-wide scanning was attempted on 6,384 samples using the Illumina 660W Quad chip. After excluding 8 samples with no observed intensity data, the 6,376 remaining samples were analyzed, including 4,987 from the Shanxi study and 1,389 from the NIT. Clustering was performed with 1,270 previously scanned Caucasian samples in order to improve calling for low MAF SNPs in the East Asian samples.
Participants were excluded because of: 1) completion rate lower than 94% (n=485 samples); 2) abnormal heterozygosity values of less than 25% or greater than 30% (n=53, among which 36 were also excluded for low completion rates; 3) discordant expected duplicates (n=3 pairs); 4) concordant unexpected duplicates (n=5 pairs, all from Shanxi); 5) gender discordance (n=55, all from Shanxi); 6) phenotype exclusions (due to ineligibility or incomplete information) (n=46). We checked for relatedness among study subjects using genotypes for all subject pairs with identity-by-state greater than 45%. These were input into GLU qc.ibds module (http://code.google.com/p/glu-genetics/) to estimate the identity-by-degree ratio and infer the degree of relatedness (1–2nd degree). We found 20 full sibling pairs, 2 parent-child pairs, and 22 half-sibling pairs. This level of relatedness was not surprising because of the geographic proximity of subjects accrued in the two studies. We selected and retained one from each of the 1st degree relative pair and excluded the other (n=22) for the PCA but included all for the association analyses. For the 132 known duplicate pairs the concordance was 99.98%.
Using 12,000 SNPs in low linkage disequilibrium (pair-wise r2<0.004)11, we identified and excluded two subjects with less than 90% Asian ancestry based on STRUCTURE analysis (http://pritch.bsd.uchicago.edu/structure.html)26 (Supplementary Fig. 3). For the Shanxi and NIT study subjects passing the QC metrics, principal component analysis showed borderline significant differences between but not within studies27. For subsequent analyses, we adjusted for study.
For all subjects in the genome-wide scan phase, we attempted 657,364 genotype assays. For analysis, we removed SNPs with a call rate <90%. 551,152 SNPs were advanced to the association analysis. Quantile-quantile plots (Supplementary Fig. 4) for case-control analyses were separately examined for GC and ESCC and there was no evidence for significant problems with population substructure or case-control matching: The unscaled λ for GC and ESCC were 0.990 and 0.989 respectively, while λ1000 for GC and ESCC were 0.995 and 0.994, respectively28. The Illumina Infinium genotype probe cluster plots for select SNPs (rs2274223 and rs3781264) are shown in Supplementary Figure 5.
After completion of the genome-wide phase, we selected six SNPs at10q23, two at 1q22, and two at 22q12 for TaqMan genotyping in our second phase. All ten SNPs were at or near genome-wide significance for total GC, ESCC, or both. For the selected SNPs, we successfully optimized eight TaqMan assays (ABI), while two failed manufacturing or validation. For the second phase using TaqMan, we included samples from the Shanxi and NIT study that had not been scanned or failed QC metrics in the genome-wide phase as well as samples from three prospective cohort studies of subjects of Chinese ethnicity (SMHS, SWHS, and SCHS) (Supplementary Table 1). In total, we completed TaqMan assays on 2034 subjects. After standard quality control metrics were applied, the sample completion rate overall was 98.8.%. Concordance between called Illumina genotypes and TaqMan was greater than 99.4%.
Association analysis
We used logistic regression models to estimate associations between genetic variants and disease risk. Primary models were adjusted for age in 10-year groups, sex, and study. We report trend models (Tables 1, 2), but also fit genotype models for comparison (Supplementary Table 3). All reported P-values are based on two-sided tests.
In the second and combined phases, logistic regression models were adjusted for age, sex, and study. Because previous studies reported an interaction between risk of ESCC, alcohol or tobacco consumption, and variants marking the ADH1B or ALDH2 gene loci, we fit models both adjusted for and stratified on these factors (Supplementary Table 4).
Data analysis and management was performed with GLU (Genotyping Library and Utilities version 1.0), a suite of tools available as an open-source application for management, storage and analysis of GWAS data.
Supplementary Material
ACKNOWLEDGEMENTS
The Shanghai Men's Health Study (SMHS) was supported by the National Cancer Institute extramural research grant [R01 CA82729]. The Shanghai Women's Health Study (SWHS) was supported by the National Cancer Institute extramural research grants [R37 CA70837 and 5R37CA070867-13, CANCER RISK REDUCTION AND DIET: A COHORT STUDY OF WOMEN, PI Wei Zheng] and, partially for biological sample collection, National Cancer Institute Intramural Research Program contract NO2-CP-11010 with Vanderbilt University. The studies would not be possible without the continuing support and devotion from the study participants and staff of the SMHS and SWHS.
The Singapore Chinese Health Study (SCHS) was supported by the National Cancer Institute extramural research grants [R01 CA55069, R35 CA53890, R01 CA80205, and R01 CA144034]. We are indebted to the contributions of Drs Mimi C Yu and Hin-Peng Lee in the establishment of this cohort. The study would not be possible without the assistance with the identification of cancer cases through database linkage by the Ministry of Health in Singapore. We are indebted to the study subjects for their continuing participation and staff of the SCHS for their support.
The Shanxi Upper Gastrointestinal Cancer Genetics Project was supported by the National Cancer Institute Intramural Research Program contract NO2-SC-66211 with the Shanxi Cancer Hospital and Institute, Taiyuan, Shanxi, China.
The Nutrition Intervention Trials (NIT) were supported by National Cancer Institute Intramural Research Program contracts NO1-SC-91030 and HHSN261200477001C with the Cancer Institute of the Chinese Academy of Medical Sciences, Beijing, China.
This research was supported by the Intramural Research Program of the NIH, National Cancer Institute, the Division of Cancer Epidemiology and Genetics, and the Center for Cancer Research.
Reference List
- 1.Parkin DM, Bray F, Ferlay J, Pisani P. Global cancer statistics, 2002. CA Cancer J Clin. 2005;55:74–108. doi: 10.3322/canjclin.55.2.74. [DOI] [PubMed] [Google Scholar]
- 2.Engel LS, et al. Population attributable risks of esophageal and gastric cancers. J Natl Cancer Inst. 2003;95:1404–1413. doi: 10.1093/jnci/djg047. [DOI] [PubMed] [Google Scholar]
- 3.Tran GD, et al. Prospective study of risk factors for esophageal and gastric cancers in the Linxian general population trial cohort in China. Int. J Cancer. 2004;113:176–181. doi: 10.1002/ijc.20616. [DOI] [PubMed] [Google Scholar]
- 4.Islami F, et al. Epidemiologic features of upper gastrointestinal tract cancers in Northeastern Iran. Br. J Cancer. 2004;90:1402–1406. doi: 10.1038/sj.bjc.6601737. [DOI] [PMC free article] [PubMed] [Google Scholar]
- 5.Gao Y, et al. Family history of cancer and risk for esophageal and gastric cancer in Shanxi, China. BMC Cancer. 2009;9:269. doi: 10.1186/1471-2407-9-269. [DOI] [PMC free article] [PubMed] [Google Scholar]
- 6.Kamangar F, Chow WH, Abnet CC, Dawsey SM. Environmental causes of esophageal cancer. Gastroenterol Clin North Am. 2009;38:27–57. doi: 10.1016/j.gtc.2009.01.004. [DOI] [PMC free article] [PubMed] [Google Scholar]
- 7.Ke L. Mortality and incidence trends from esophagus cancer in selected geographic areas of China circa 1970–90. Int. J Cancer. 2002;102:271–274. doi: 10.1002/ijc.10706. [DOI] [PubMed] [Google Scholar]
- 8.Li JY. Epidemiology of esophageal cancer in China. Natl Cancer Inst Monogr. 1982;62:113–120. [PubMed] [Google Scholar]
- 9.Yang CS. Research on esophageal cancer in China: a review. Cancer Res. 1980;40:2633–2644. [PubMed] [Google Scholar]
- 10.Zheng W, et al. Declining incidence is greater for esophageal than gastric cancer in Shanghai, People's Republic of China. Br J Cancer. 1993;68:978–982. doi: 10.1038/bjc.1993.465. [DOI] [PMC free article] [PubMed] [Google Scholar]
- 11.Yu K, et al. Population substructure and control selection in genome-wide association studies. PLoS One. 2008;3:e2551. doi: 10.1371/journal.pone.0002551. [DOI] [PMC free article] [PubMed] [Google Scholar]
- 12.Bunney TD, Baxendale RW, Katan M. Regulatory links between PLC enzymes and Ras superfamily GTPases: signalling via PLCepsilon. Adv. Enzyme Regul. 2009;49:54–58. doi: 10.1016/j.advenzreg.2009.01.004. [DOI] [PubMed] [Google Scholar]
- 13.Hinkes B, et al. Positional cloning uncovers mutations in PLCE1 responsible for a nephrotic syndrome variant that may be reversible. Nat Genet. 2006;38:1397–1405. doi: 10.1038/ng1918. [DOI] [PubMed] [Google Scholar]
- 14.Bai Y, et al. Crucial role of phospholipase Cepsilon in chemical carcinogen-induced skin tumor development. Cancer Res. 2004;64:8808–8810. doi: 10.1158/0008-5472.CAN-04-3143. [DOI] [PubMed] [Google Scholar]
- 15.Li M, Edamatsu H, Kitazawa R, Kitazawa S, Kataoka T. Phospholipase Cepsilon promotes intestinal tumorigenesis of Apc(Min/+) mice through augmentation of inflammation and angiogenesis. Carcinogenesis. 2009;30:1424–1432. doi: 10.1093/carcin/bgp125. [DOI] [PubMed] [Google Scholar]
- 16.Johmura Y, Osada S, Nishizuka M, Imagawa M. FAD24, a regulator of adipogenesis, is required for the regulation of DNA replication in cell proliferation. Biol. Pharm. Bull. 2008;31:1092–1095. doi: 10.1248/bpb.31.1092. [DOI] [PubMed] [Google Scholar]
- 17.Hall J, et al. The association of sequence variants in DNA repair and cell cycle genes with cancers of the upper aerodigestive tract. Carcinogenesis. 2007;28:665–671. doi: 10.1093/carcin/bgl160. [DOI] [PubMed] [Google Scholar]
- 18.Brennan P, et al. Uncommon CHEK2 mis-sense variant and reduced risk of tobacco-related cancers: case control study. Hum. Mol. Genet. 2007;16:1794–1801. doi: 10.1093/hmg/ddm127. [DOI] [PubMed] [Google Scholar]
- 19.Meijers-Heijboer H, et al. Low-penetrance susceptibility to breast cancer due to CHEK2(*)1100delC in noncarriers of BRCA1 or BRCA2 mutations. Nat Genet. 2002;31:55–59. doi: 10.1038/ng879. [DOI] [PubMed] [Google Scholar]
- 20.Cybulski C, et al. CHEK2 is a multiorgan cancer susceptibility gene. Am J Hum. Genet. 2004;75:1131–1135. doi: 10.1086/426403. [DOI] [PMC free article] [PubMed] [Google Scholar]
- 21.Sakamoto H, et al. Genetic variation in PSCA is associated with susceptibility to diffuse-type gastric cancer. Nat Genet. 2008;40:730–740. doi: 10.1038/ng.152. [DOI] [PubMed] [Google Scholar]
- 22.Lu Y, et al. Genetic variation of PSCA gene is associated with the risk of both diffuse- and intestinal-gastric cancer in a Chinese population. Int J Cancer. 2010 doi: 10.1002/ijc.25228. [DOI] [PubMed] [Google Scholar]
- 23.Yokoyama A, Omori T. Genetic polymorphisms of alcohol and aldehyde dehydrogenases and risk for esophageal and head and neck cancers. Jpn. J Clin. Oncol. 2003;33:111–121. doi: 10.1093/jjco/hyg026. [DOI] [PubMed] [Google Scholar]
- 24.Cui R, et al. Functional variants in ADH1B and ALDH2 coupled with alcohol and smoking synergistically enhance esophageal cancer risk. Gastroenterology. 2009;137:1768–1775. doi: 10.1053/j.gastro.2009.07.070. [DOI] [PubMed] [Google Scholar]
- 25.Park JH, et al. Estimation of effect size distribution from genome-wide association studies and implications for future discoveries. Nat Genet. 2010;42:570–575. doi: 10.1038/ng.610. [DOI] [PMC free article] [PubMed] [Google Scholar]
- 26.Falush D, Stephens M, Pritchard JK. Inference of population structure using multilocus genotype data: linked loci and correlated allele frequencies. Genetics. 2003;164:1567–1587. doi: 10.1093/genetics/164.4.1567. [DOI] [PMC free article] [PubMed] [Google Scholar]
- 27.Price AL, et al. Principal components analysis corrects for stratification in genome-wide association studies. Nat Genet. 2006;38:904–909. doi: 10.1038/ng1847. [DOI] [PubMed] [Google Scholar]
- 28.de Bakker PI, et al. Practical aspects of imputation-driven meta-analysis of genome-wide association studies. Hum. Mol. Genet. 2008;17:R122–R128. doi: 10.1093/hmg/ddn288. [DOI] [PMC free article] [PubMed] [Google Scholar]
Associated Data
This section collects any data citations, data availability statements, or supplementary materials included in this article.