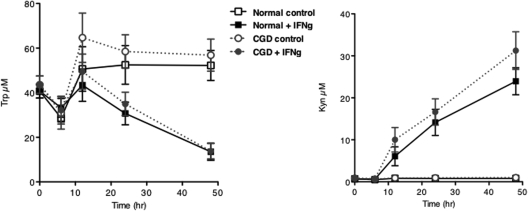
Figure 5.
Kinetics of IFNγ-induced tryptophan metabolism of MDDC from normal and CGD donors. MDDC were treated as described for monocytes and tryptophan and kynurenine concentrations measured at the indicated time points. Plotted are means ± SEM of 4 to 8 normal donors and 2 to 6 CGD donors (both genotypes).

