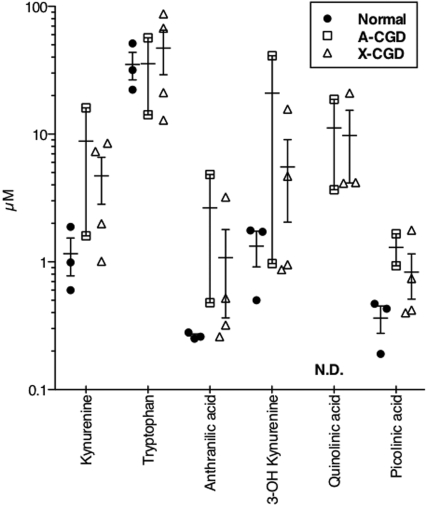
Figure 6.
Urinary trptophan levels in normal and CGD donors. Twenty-four-hour collections of urine were analyzed as described and the resulting concentrations (micromolar) plotted for each replicate (n = 3 normal, 2 A-CGD, 4 X-CGD). A line is drawn at the mean ± SEM for each set. ND indicates not detected.

