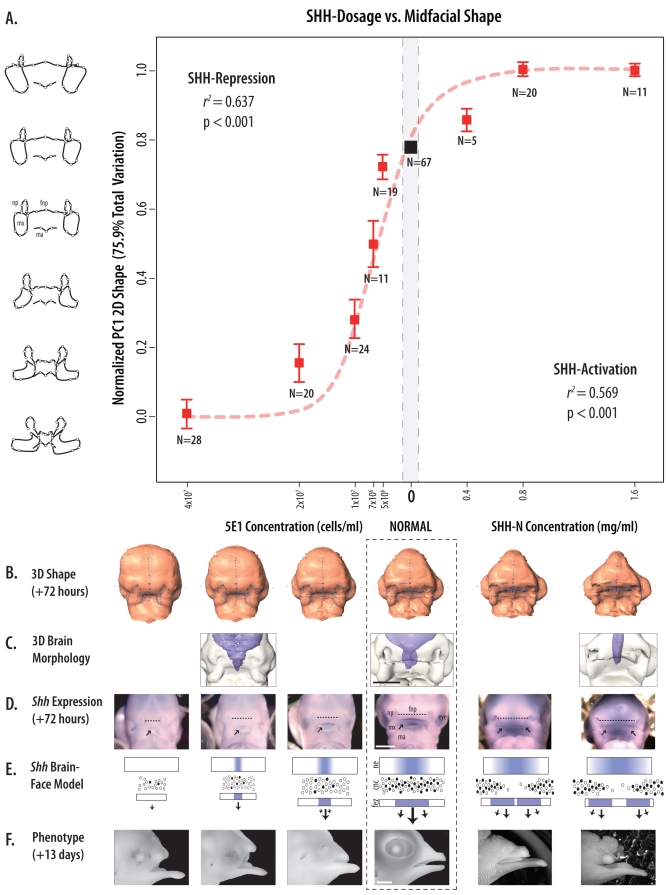
Fig. 1.
Experimental results. (A) Relationship of dosage to mean midfacial shape scores from both experiments (5E1: r2=0.637, P<0.001; SHH-N: r2=0.569, P<0.001; bars represent s.e.). y-axis represents the mathematical deformation of the mean midfacial landmark configuration. Broken line shows maximum likelihood fit of a nonlinear Hill equation (Hill coefficient n=8.73). (B) Relative 3D-shape changes using a thin-plate spline transformation of surface landmark data scaled to a common size. (C) Internal brain shape (purple). (D) Shh whole-mount in situ hybridization (arrows, positive signal). (E) Schematic transverse section illustrating the proposed relationship between Shh expression (blue) in the brain (neuroectoderm, ne), face (frontoectodermal zone, fez) and cell proliferation (white, non-proliferating; black, proliferating). Arrows show direction of midfacial growth. Frontonasal process, fnp; nasal pits, np; maxillary prominences, mx. (F) External facial shape 13 days post treatment. Scale bars: 1 mm in C,D; 2 mm in F.

