

Abstract
Objectives
The subgenual prefrontal cortex (SGPFC) is an important brain region involved in emotional regulation and reward mechanisms. Volumetric abnormalities in this region have been identified in adults with bipolar disorder but thus far not in pediatric cases. We examined the volume of this brain region in subjects with pediatric bipolar disorder (PBD) and compared them to healthy controls.
Methods
Fifty one children and adolescents (mean age ± SD; 13.2 ± 2.9 y) with DSM-IV PBD and 41 (mean age ± SD; 13.7 ± 2.7 y) healthy comparison subjects (HC) underwent 1.5 T structural magnetic resonance imaging (MRI) brain scans. We traced the SGPFC manually and compared SGPFC gray matter volumes using analysis of covariance with age, gender, and intracranial volume as covariates. We also examined the relationship of family history of affective disorders and medication status to SGPFC volumes.
Results
SGPFC volumes were not significantly different in PBD and HC subjects. However, exploratory analysis showed PBD subjects who had one or more first degree relatives with mood disorders (n = 33) had significantly smaller left hemisphere SGPFC compared to HC (p=0.03 Sidak corrected). Current usage of a mood stabilizer was significantly associated with larger right SGPFC volume in PBD (F=4.82, df = 1/41, p=0.03).
Conclusion
Subjects with PBD and a close family history of mood disorders may have smaller left SGPFC volumes than HC. Mood stabilizing medication may also impact SGPFC size and could have masked more subtle abnormalities overall.
Keywords: Pediatric bipolar disorder, Subgenual Prefrontal Cortex, Mood stabilizers, Mania, Structural MRI, emotional regulation
Introduction
The subgenual prefrontal cortex(SGPFC) is an area of the prefrontal cortex ventral to the genu of the corpus callosum (Drevets et al., 1997). Animal models show it has rich and bidirectional connections to important emotional regulatory regions including the amygdala, hippocampus, and parahippocampus (Musil & Olson, 1988). It also projects to subcortical regions including visceromotoral control neurons such as the nucleus of the solitary tract and spinal autonomic neurons (Musil et al., 1988). These unique anatomical features suggest an important role in emotional regulation and mood disorders. In adults metabolic and volumetric deficits in the SGPFC are associated with depression and abnormal reward mechanisms (Drevets et al., 1997; Phelps, Delgado, Nearing, & LeDoux, 2004). For example, in unipolar depression SGPFC exhibits abnormally decreased metabolism, small size, and volumetric changes with treatment predictive of response to antidepressive medication (Drevets, Ongur, & Price, 1998b; Drevets et al., 1997; Mayberg et al., 2000). In bipolar disorder (BD), SGPFC glucose metabolism is suppressed in depressed states and activated in manic states suggesting an important role in the pathophysiology of this condition (Drevets et al., 1997).
Smaller SGPFC volumes are reported in adults with BD but have not been consistently replicated (Brambilla et al., 2002; Bremner et al., 2002; Drevets, Ongur, & Price, 1998a). One recent examination of familial and sporadic cases of bipolar disorder did not demonstrate any differences in the SGPFC from controls(Hajek et al., 2009). This study examined both adults and adolescents in a single sample which could mask subtle differences given the variable stages of neurological development. For example the amygdala is shown to be smaller in bipolar adolescents compared to healthy controls but larger than normal in bipolar adults (Brambilla, Hatch, & Soares, 2008; DelBello, Zimmerman, Mills, Getz, & Strakowski, 2004). In the only pure pediatric bipolar disorder (PBD) sample studied there were no significant volumetric deficits in this region seen (Sanches et al., 2005). This may be because such changes potentially only manifest in adulthood. Other possibilities include insufficient sample size in previous studies and potential heterogeneity in the PBD phenotype. Most structural neuroimaging studies to date have been underpowered (Kempton, Geddes, Ettinger, Williams, & Grasby, 2008). One possible method to raise power is to increase the specificity of the phenotype. Phenotypic heterogeneity is especially problematic in PBD due to ongoing debate and uncertainty as to the specific characteristics that constitute PBD (Craney & Geller, 2003; Faedda, Baldessarini, Glovinsky, & Austin, 2004; Kowatch, Youngstrom, Danielyan, & Findling, 2005; Leibenluft, Charney, Towbin, Bhangoo, & Pine, 2003; Wozniak et al., 1995).
We attempted in this study to replicate and expand on earlier efforts to examine morphometric changes in the SGPFC in PBD subjects. We posited that given an enhanced sample we would be able to demonstrate similar volumetric brain changes in the SGPFC to those found in adults.
Methods
Child and adolescent subjects aged 7-17 years were recruited through the neuroimaging research programs at The University of Texas Health Science Center at San Antonio (UTHSCSA). The Institutional Review Board at UTHSCSA approved this study. Consent was obtained from the parents and written assent from the subjects for this study. All subjects were excluded on the basis of serious medical illness, mental retardation (IQ<70), developmental disorders, or substance abuse within the past 6 months. Inclusion criteria for PBD subjects included a current DSM-IV diagnosis of bipolar I, II, or NOS. Healthy comparison subjects were excluded on the presence of any current or past psychiatric disorder in themselves or in any first degree relative. There was no overlap in the sample population for this study and an earlier study reported by our group(Sanches et al., 2005).
Assessment
Trained clinicians administered the Kiddie Schedule for Affective Disorders and Schizophrenia for School-age Children – Present and Lifetime version (K-SADS-PL) to assess for diagnosis (Kaufman et al., 1997). These clinicians were all M.D. and Ph.D. level in training and prior to administering the KSADS-PL in this study they achieved 100% inter-rater agreement on diagnosis of bipolar disorder using this instrument with a board certified child and adolescent psychiatrist. Final diagnoses were made in a consensus conference with senior psychiatrists. Family history of psychiatric illness was obtained as part of the initial examination with a clinician administered form which screened for psychiatric illness in 1st and 2nd degree relatives. Any major affective disorder (major depressive disorder or BD) in a first degree relative was considered a positive screen for a family history of mood disorders. Sociodemographic status was assigned using the Hollingshead Socioeconomic Scale (Hollingshead Four Factor Index Total Score)(Hollingshead, 1975). IQ was assessed using the four subtest version of the Wechsler Abbreviated Scale of Intelligence (WASI)(Wechsler, 2001). Pubertal status was assessed using the Peterson Puberty Scale(Peterson, Crockett, Richards, & Boxer, 1988). Handedness was determined using the Oldfield Handedness Inventory(Oldfield, 1971).
MRI Acquisition
All subjects were scanned on a 1.5 Tesla Phillips MRI scanner (Phillips Medical System, Andover, MA). Images were acquired using an axial three-dimensional T1-weighted fast field echo sequence (field of view 256 mm, view matrix 256X256, repetition time 24ms, echo time 5ms, flip angle 40 degrees, slice thickness 1mm).
Tracing
The brain was first segmented into grey matter, white matter and CSF using the semiautomated software Brains2 (University of Iowa)(Magnotta et al., 2002). All ROIs were then traced on the T1-weighted image and over-laid onto the segmented image to obtain grey matter volume.
Total brain volume (TBV) was also traced in coronal plane. Tracing began on the most anterior slice in which brain matter was visible and continued posteriorly including only brain matter and excluding CSF, dura mater, sinuses and brainstem, until brain matter was no longer visible. The base of the cerebellum served as the inferior border The SGPFC was manually traced in the coronal plane. The borders of the SGPFC were defined rostrally as gray matter of the first full gyrus below the corpus callosum and caudally to the slice anterior to where the internal capsule no longer divided the striatum. All of the tracings were performed by the same M.D. level technician who was blind to the diagnosis. This technician was trained in the method previously utilized by our group and described in detail in an earlier manuscript (Brambilla et al., 2002).
Data Analysis
Statistical analyses were conducted using SPSS for Windows version 15.0 (SPSS Inc., Chicago, Ill.). Samples were compared on demographic variables using independent sample t-tests and chi square tests. SGPFC volumes of HC and PBD subjects were compared using analysis of covariance (ANCOVA) with age, gender, and total brain volume as covariates. We tested the effects of a narrowly defined BD diagnoses (excluding BD NOS), comorbid ADHD, medication and family history using ANCOVA and pairwise comparisons with Sidak correction for multiple comparisons where appropriate. All tests were two-sided with significance defined at the p <0.05 level.
Results
Fifty-one subjects met eligibility and exclusion criteria for DSM-IV PBD and 41 met criteria for HC (A.P.A., 1994). Further demographic details are available in table 1. The two groups were similar demographically except for a greater proportion of Hispanic subjects in the HC group.
Table 1.
Demographic and Clinical Variables
| HC (n=41) | PBD (n=51) | p | |
|---|---|---|---|
| Mean (SD) | Mean (SD) | ||
| Age in y | 13.7 (2.7) | 13.2 (2.9) | 0.41 |
| SES | 45.0(14.0) | 43.6 (14.3) | 0.68 |
| Puberty Score | 2.52(1.0) | 2.35(1.2) | 0.45 |
| N (%) | N (%) | ||
| Male | 21 (51.2) | 28 (54.9) | 0.83 |
| Caucasian | 6 (14.6) | 33 (64.7) | <0.01 |
| Hispanic | 29 (70.7) | 14 (27.5) | <0.01 |
| Right Handed | 36 (90) | 46 (90.2) | 0.36 |
| ADHD | n/a | 31 (58.5) | |
| Anxiety Disorders | n/a | 33 (62.3) | |
| Disruptive Behavior Disorders | n/a | 24 (45.3) | |
| Bipolar I Disorder | n/a | 29 (56.9) | |
| Bipolar II Disorder | n/a | 15 (29.4) | |
| Bipolar Disorder NOS | n/a | 7 (13.7) | |
| Ever taken Psychiatric Medication | 1 (2.4) | 41 (80.4) | |
| Currently taking psychiatric medication | 1 (2.4) | 36 (70.6) | |
There was no statistically significant difference in total left or right SGPFC gray matter volumes between subjects with PBD and HC (table 2). Due to our concern about the impact of phenotypic heterogeneity of PBD on our ability to detect differences in SGPFC volume we conducted a planned analysis excluding all BD NOS subjects. In this analysis the left SGPFC volume (df=1/83, F=4.38, p=.04) but not the right SGPFC was significantly smaller in PBD subjects.
Table 2.
SGPFC Comparison by Diagnostic Group
All units are mm3
ANCOVA with age, gender, TBV as covariates
Dividing the PBD subjects into subgroups according to whether or not they had one or more first degree relatives with any mood disorder revealed the subjects with a positive family history (n = 33; 18 with family history of unipolar depression, 15 with bipolar disorder) had significantly smaller left SGPFC volumes compared to those with a negative family history (n = 18, p=0.05 Sidak corrected), and compared to the HC (n = 41, p = 0.03 Sidak corrected). There were no significant differences among the three groups with respect to right SGPFC volumes (table 3).
Table 3.
Comparison of SGPFC volumes as a function of having a first degree relative with any mood disorder
| HC (n = 41) | PBD with positive family history (n = 33) | PBD with negative family history (n=18) | p** | |
|---|---|---|---|---|
| Mean (SD) | Mean (SD) | Mean (SD) | ||
| R. SGPFC* | 347(125) | 318(126) | 331(116) | 0.62 |
| L. SGPFC* | 400(144) | 318(120) | 409(118) | 0.01 |
All units are mm3
ANCOVA with age, gender, TBV as covariates. For L SGPFC, pairwise comparisons using Sidak correction for multiple comparisons showed that mean volume of HC was significantly larger than that of PBD with positive family history (p = .027). Remaining pairwise differences were not significant.
Given that ADHD was a highly co-morbid condition in our PBD sample (table 1), we examined the effect of ADHD diagnosis on SGPFC. ADHD status was not significantly associated with SGPFC volumes (Table 4).
Table 4.
SGPFC in PBD with comorbid ADHD
| ADHD (n=31) | No ADHD (n=20) | p** | |
|---|---|---|---|
| Mean (SD) | Mean (SD) | ||
| R. SGPFC* | 327(115) | 315(133) | 0.76 |
| L. SGPFC* | 327(113) | 386(138) | 0.07 |
All units are mmˆ3
ANCOVA with age, gender, TBV as covariates
Of 36 subjects with PBD who were on medication at that time of the study 8 were using a mood stabilizer, 6 antipsychotics, 11 antidepressants, and 6 stimulants. Subjects that were currently taking psychotropic medications (n = 36) did not differ significantly from those that were not taking such medications (n = 15) with respect to left (p = 0.99) or right (p = 0.61) SGPFC volume. Those PBD subjects that were using mood stabilizers (n = 8), compared to those who were not (n = 43), had significantly larger right (p = 0.01) but not left (p = 0.50) SGPFC volumes. The effects of antipsychotics were similar (n = 6 taking antipsychotics versus n = 45 not taking them) and approached significance for right (p = 0.05) but not left (p = 0.96) SGPFC volume.
Discussion
Our primary comparison of SGPFC size between diagnostic groups did not demonstrate significance. This is similar to an earlier finding by our group reported with a smaller sample(Sanches et al., 2005). After excluding BD NOS subjects we found significantly smaller left but not right SGPFC volumes in PBD subjects in comparison to healthy subjects. This line of reasoning is similar to our neurocognitive findings with this sample (Glahn et al., 2005). Those results suggested that findings in these regions are not detectable in samples using a broader phenotype. Other researchers have separated out children with chronic irritability from the PBD phenotype and have classified such cases as having a novel diagnosis called severe mood dysregulation (Brotman et al., 2006). Some also emphasize the importance of “cardinal” features of BD namely grandiosity and elation (Geller, Tillman, Craney, & Bolhofner, 2004). The current study design does not enable us to examine these controversies directly. Our study findings suggest, however, that the different PBD subtypes may have varied pathogenic mechanisms and that these differences could have implications on brain structure.
We conducted another exploratory analysis after assigning PBD subjects to subgroups according to whether they had a family history of mood disorders. The left but not right SGPFC was significantly smaller in familial cases of PBD compared to both non-familial PBD and HC subjects. Given the high degree of heritability of BD, the presence of a positive family history of mood disorder in a first degree relative may increase the specificity of the diagnosis and the power to detect differences (McGuffin et al., 2003; Sharma et al., 2003). Taken together our findings support the hypothesis that increasing the specificity of the PBD phenotype increased the ability to detect SGPFC volume differences.
Only one previous study has examined the volume of the SGPFC in PBD. In that study Sanches et al. did not find any difference in the SGPFC volume of PBD compared to HC subjects. They also examined PBD subjects with familial BD and did not find any significant results (Sanches et al., 2005). Our study is in agreement with the main finding of the Sanches et al. study in that we were not able to detect differences in SGPFC size in the overall sample comparing PBD to HC subjects. It is possible that the SGPFC differences reported in adults with BD are not present early on in childhood. Another possibility is that they are present in only certain subtypes of PBD or in high risk populations. Medication usage is also an important variable to consider. Our post hoc analysis of the influence of medication in our sample indicated that their use may have masked or reversed possible disease related changes by enlarging gray matter in treated subjects. This correlates well with previous literature documenting the impact of mood stabilizers and in particular lithium on increasing gray matter (Bearden et al., 2007; Monkul et al., 2007; Sassi et al., 2002). One of the important limitations of this study than is that it is a cross sectional study with a heterogeneous mixture of medicated and unmedicated subjects. We therefore do not know whether these subjects had these changes prior to disease expression or medication exposure. Our study was also not designed to adequately examine the differences between PBD subtypes with regards to “cardinal symptoms” or in relation to chronic versus episodic irritability. Future studies should consider investigating more specifically the significance of these phenotypic patterns of BD on brain structure. Longitudinal studies could help to parse out the role of normal brain maturation, disease trait and state related changes, and medication effects on brain morphometry. Ultimately these types of studies could improve our understanding of the pathogenesis of BD and identify more specific opportunities for early intervention and prevention.
Figure 1.
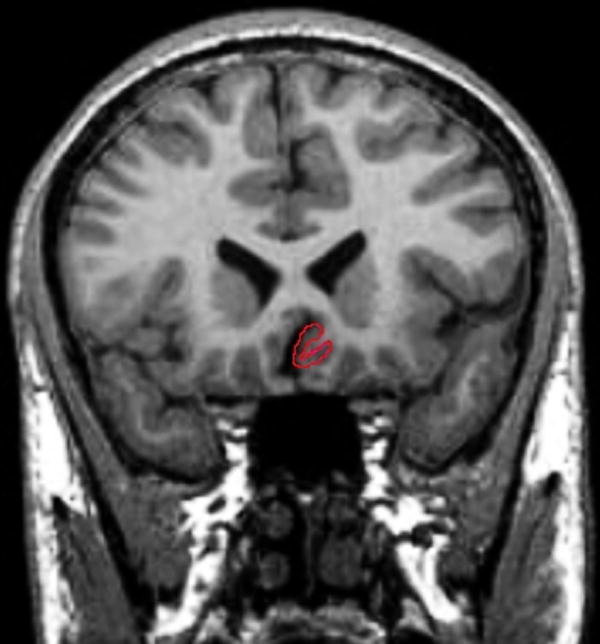
Tracing of the SGPFC in the Coronal Plane
Figure 2.
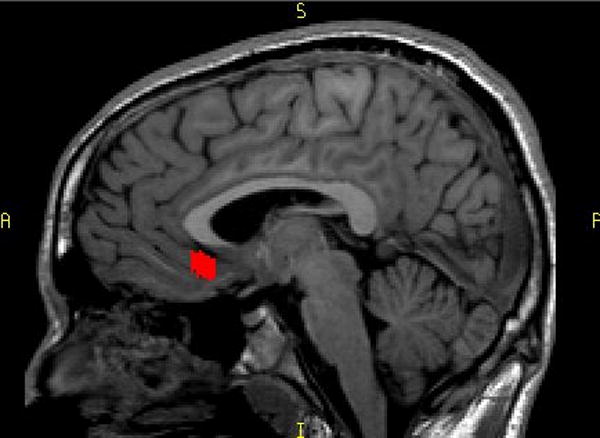
Saggital View of the SGPFC
Acknowledgments
This research was partly supported by MH 69774, MH 068662, MH068280, RR 20571, and the Krus Endowed Chair in Psychiatry (UTHSCSA). The funding sources had no further role in the study design; in the collection, analysis and interpretation of data; in the writing of the report; and in the decision to submit the paper for publication.
Footnotes
Jair C. Soares designed the study and wrote the protocol. Authors Sheila Caetano, Giovana Zunta-Soares collected and processed the data. Mark A. Nicoletti provided intellectual contribution on technical aspects of magnetic resonance spectroscopy in the protocol and manuscript writing, and on data processing. Authors Hasan A. Baloch and John P. Hatch undertook the statistical analyses. Hasan A. Baloch wrote the first draft of the manuscript. All authors contributed and have approved the final manuscript.
Jair Soares serves on the Speaker’s Bureau for Eli Lilly, AstraZeneca, BMS, and Jannsen Cillag. He is a consultant for Organon and Shire. He has received research support from Pfizer, GSK, and Repligen. Rene Olvera receives research support from Ortho-McNeil Pharmaceuticals and is a consultant for Shire Pharmaceuticals. HAB, JPH, and GBZ have no financial disclosures or conflicts of interests to report. Sheila Caetano has had scholarships from CNPq (Conselho Nacional de Desenvolvimento Cientifico e Tecnológico) and FAPESP (Fundação de Amparo a Pesquisa de São Paulo) and has research grant from NARSAD, APA (American Psychiatric Association)/AstraZeneca Young Minds in Psychiatry International Awards and CNPq.The other authors do not have any commercial associations that might pose a conflict of interest in connection with this manuscript.
Publisher's Disclaimer: This is a PDF file of an unedited manuscript that has been accepted for publication. As a service to our customers we are providing this early version of the manuscript. The manuscript will undergo copyediting, typesetting, and review of the resulting proof before it is published in its final citable form. Please note that during the production process errors may be discovered which could affect the content, and all legal disclaimers that apply to the journal pertain.
References
- A.P.A. Diagnostic and Statistical Manual of Mental Disorders. 4. Washington, D.C.: American Psychiatric Association; 1994. DSM IV. [Google Scholar]
- Bearden CE, Thompson PM, Dalwani M, Hayashi KM, Lee AD, Nicoletti M, Trakhtenbroit M, Glahn DC, Brambilla P, Sassi RB, Mallinger AG, Frank E, Kupfer DJ, Soares JC. Greater cortical gray matter density in lithium-treated patients with bipolar disorder. Biol Psychiatry. 2007;62:7–16. doi: 10.1016/j.biopsych.2006.10.027. [DOI] [PMC free article] [PubMed] [Google Scholar]
- Brambilla P, Hatch JP, Soares JC. Limbic changes identified by imaging in bipolar patients. Curr Psychiatry Rep. 2008;10:505–9. doi: 10.1007/s11920-008-0080-8. [DOI] [PubMed] [Google Scholar]
- Brambilla P, Nicoletti MA, Harenski K, Sassi RB, Mallinger AG, Frank E, Kupfer DJ, Keshavan MS, Soares JC. Anatomical MRI study of subgenual prefrontal cortex in bipolar and unipolar subjects. Neuropsychopharmacology. 2002;27:792–9. doi: 10.1016/S0893-133X(02)00352-4. [DOI] [PubMed] [Google Scholar]
- Bremner JD, Vythilingam M, Vermetten E, Nazeer A, Adil J, Khan S, Staib LH, Charney DS. Reduced volume of orbitofrontal cortex in major depression. Biol Psychiatry. 2002;51:273–9. doi: 10.1016/s0006-3223(01)01336-1. [DOI] [PubMed] [Google Scholar]
- Brotman MA, Schmajuk M, Rich BA, Dickstein DP, Guyer AE, Costello EJ, Egger HL, Angold A, Pine DS, Leibenluft E. Prevalence, clinical correlates, and longitudinal course of severe mood dysregulation in children. Biol Psychiatry. 2006;60:991–7. doi: 10.1016/j.biopsych.2006.08.042. [DOI] [PubMed] [Google Scholar]
- Craney JL, Geller B. A prepubertal and early adolescent bipolar disorder-I phenotype: review of phenomenology and longitudinal course. Bipolar Disord. 2003;5:243–56. doi: 10.1034/j.1399-5618.2003.00044.x. [DOI] [PubMed] [Google Scholar]
- DelBello MP, Zimmerman ME, Mills NP, Getz GE, Strakowski SM. Magnetic resonance imaging analysis of amygdala and other subcortical brain regions in adolescents with bipolar disorder. Bipolar Disord. 2004;6:43–52. doi: 10.1046/j.1399-5618.2003.00087.x. [DOI] [PubMed] [Google Scholar]
- Drevets WC, Ongur D, Price JL. Neuroimaging abnormalities in the subgenual prefrontal cortex: implications for the pathophysiology of familial mood disorders. Mol Psychiatry. 1998a;3:220–6. 190–1. doi: 10.1038/sj.mp.4000370. [DOI] [PubMed] [Google Scholar]
- Drevets WC, Ongur D, Price JL. Reduced glucose metabolism in the subgenual prefrontal cortex in unipolar depression. Mol Psychiatry. 1998b;3:190–1. doi: 10.1038/sj.mp.4000380. [DOI] [PubMed] [Google Scholar]
- Drevets WC, Price JL, Simpson JR, Jr, Todd RD, Reich T, Vannier M, Raichle ME. Subgenual prefrontal cortex abnormalities in mood disorders. Nature. 1997;386:824–7. doi: 10.1038/386824a0. [DOI] [PubMed] [Google Scholar]
- Faedda GL, Baldessarini RJ, Glovinsky IP, Austin NB. Pediatric bipolar disorder: phenomenology and course of illness. Bipolar Disord. 2004;6:305–13. doi: 10.1111/j.1399-5618.2004.00128.x. [DOI] [PubMed] [Google Scholar]
- Geller B, Tillman R, Craney JL, Bolhofner K. Four-year prospective outcome and natural history of mania in children with a prepubertal and early adolescent bipolar disorder phenotype. Arch Gen Psychiatry. 2004;61:459–67. doi: 10.1001/archpsyc.61.5.459. [DOI] [PubMed] [Google Scholar]
- Glahn DC, Bearden CE, Caetano S, Fonseca M, Najt P, Hunter K, Pliszka SR, Olvera RL, Soares JC. Declarative memory impairment in pediatric bipolar disorder. Bipolar Disord. 2005;7:546–54. doi: 10.1111/j.1399-5618.2005.00267.x. [DOI] [PubMed] [Google Scholar]
- Hajek T, Novak T, Kopecek M, Gunde E, Alda M, Hoschl C. Subgenual cingulate volumes in offspring of bipolar parents and in sporadic bipolar patients. Eur Arch Psychiatry Clin Neurosci. 2009 doi: 10.1007/s00406-009-0077-2. [DOI] [PubMed] [Google Scholar]
- Hollingshead AB. Four Factor Index of Social Class. New Haven: 1975. [Google Scholar]
- Kaufman J, Birmaher B, Brent D, Rao U, Flynn C, Moreci P, Williamson D, Ryan N. Schedule for Affective Disorders and Schizophrenia for School-Age Children-Present and Lifetime Version (K-SADS-PL): initial reliability and validity data. J Am Acad Child Adolesc Psychiatry. 1997;36:980–8. doi: 10.1097/00004583-199707000-00021. [DOI] [PubMed] [Google Scholar]
- Kempton MJ, Geddes JR, Ettinger U, Williams SC, Grasby PM. Meta-analysis, database, and meta-regression of 98 structural imaging studies in bipolar disorder. Arch Gen Psychiatry. 2008;65:1017–32. doi: 10.1001/archpsyc.65.9.1017. [DOI] [PubMed] [Google Scholar]
- Kowatch RA, Youngstrom EA, Danielyan A, Findling RL. Review and meta-analysis of the phenomenology and clinical characteristics of mania in children and adolescents. Bipolar Disord. 2005;7:483–96. doi: 10.1111/j.1399-5618.2005.00261.x. [DOI] [PubMed] [Google Scholar]
- Leibenluft E, Charney DS, Towbin KE, Bhangoo RK, Pine DS. Defining clinical phenotypes of juvenile mania. Am J Psychiatry. 2003;160:430–7. doi: 10.1176/appi.ajp.160.3.430. [DOI] [PubMed] [Google Scholar]
- Magnotta VA, Harris G, Andreasen NC, O’Leary DS, Yuh WT, Heckel D. Structural MR image processing using the BRAINS2 toolbox. Comput Med Imaging Graph. 2002;26:251–64. doi: 10.1016/s0895-6111(02)00011-3. [DOI] [PubMed] [Google Scholar]
- Mayberg HS, Brannan SK, Tekell JL, Silva JA, Mahurin RK, McGinnis S, Jerabek PA. Regional metabolic effects of fluoxetine in major depression: serial changes and relationship to clinical response. Biol Psychiatry. 2000;48:830–43. doi: 10.1016/s0006-3223(00)01036-2. [DOI] [PubMed] [Google Scholar]
- McGuffin P, Rijsdijk F, Andrew M, Sham P, Katz R, Cardno A. The heritability of bipolar affective disorder and the genetic relationship to unipolar depression. Arch Gen Psychiatry. 2003;60:497–502. doi: 10.1001/archpsyc.60.5.497. [DOI] [PubMed] [Google Scholar]
- Monkul ES, Matsuo K, Nicoletti MA, Dierschke N, Hatch JP, Dalwani M, Brambilla P, Caetano S, Sassi RB, Mallinger AG, Soares JC. Prefrontal gray matter increases in healthy individuals after lithium treatment: a voxel-based morphometry study. Neurosci Lett. 2007;429:7–11. doi: 10.1016/j.neulet.2007.09.074. [DOI] [PMC free article] [PubMed] [Google Scholar]
- Musil SY, Olson CR. Organization of cortical and subcortical projections to medial prefrontal cortex in the cat. J Comp Neurol. 1988;272:219–41. doi: 10.1002/cne.902720206. [DOI] [PubMed] [Google Scholar]
- Oldfield RC. The assessment and analysis of handedness: the Edinburgh inventory. Neuropsychologia. 1971;9:97–113. doi: 10.1016/0028-3932(71)90067-4. [DOI] [PubMed] [Google Scholar]
- Peterson A, Crockett L, Richards M, Boxer A. A self report measure of pubertal status: Reliability, validity, and initial norms. Journal of Youth and Adolescence. 1988;17:117–133. doi: 10.1007/BF01537962. [DOI] [PubMed] [Google Scholar]
- Phelps EA, Delgado MR, Nearing KI, LeDoux JE. Extinction learning in humans: role of the amygdala and vmPFC. Neuron. 2004;43:897–905. doi: 10.1016/j.neuron.2004.08.042. [DOI] [PubMed] [Google Scholar]
- Sanches M, Sassi RB, Axelson D, Nicoletti M, Brambilla P, Hatch JP, Keshavan MS, Ryan ND, Birmaher B, Soares JC. Subgenual prefrontal cortex of child and adolescent bipolar patients: a morphometric magnetic resonance imaging study. Psychiatry Res. 2005;138:43–9. doi: 10.1016/j.pscychresns.2004.11.004. [DOI] [PubMed] [Google Scholar]
- Sassi RB, Nicoletti M, Brambilla P, Mallinger AG, Frank E, Kupfer DJ, Keshavan MS, Soares JC. Increased gray matter volume in lithium-treated bipolar disorder patients. Neurosci Lett. 2002;329:243–5. doi: 10.1016/s0304-3940(02)00615-8. [DOI] [PubMed] [Google Scholar]
- Sharma V, Menon R, Carr TJ, Densmore M, Mazmanian D, Williamson PC. An MRI study of subgenual prefrontal cortex in patients with familial and non-familial bipolar I disorder. J Affect Disord. 2003;77:167–71. doi: 10.1016/s0165-0327(02)00109-x. [DOI] [PubMed] [Google Scholar]
- Wechsler D. Wechsler Test of Adult Reading. San Antonio, TX: Psychological Corporation; 2001. [Google Scholar]
- Wozniak J, Biederman J, Kiely K, Ablon JS, Faraone SV, Mundy E, Mennin D. Mania-like symptoms suggestive of childhood-onset bipolar disorder in clinically referred children. J Am Acad Child Adolesc Psychiatry. 1995;34:867–76. doi: 10.1097/00004583-199507000-00010. [DOI] [PubMed] [Google Scholar]