

Abstract
Backbone 1H, 13C and 15N resonance assignments are presented for the extracellular domain of tissue factor. Tissue factor is the integral membrane protein that initiates blood coagulation through the formation an enzymatic complex with the plasma serine protease, factor VIIa.
Keywords: Blood clotting, Tissue factor
Biological context
In normal hemostasis and most thrombotic diseases, blood clotting is triggered upon the assembly of the cell-surface complex of tissue factor (TF) and activated factor VII (FVIIa) (Morrissey 2004). TF is a type-I integral membrane protein found on the surface of a variety of cells outside the vasculature (Drake et al. 1989), while FVIIa is a plasma serine protease. The TF:FVIIa complex can be considered a two-subunit enzyme, with FVIIa as the catalytic subunit and TF the essential regulatory subunit; it triggers the clotting cascade via limited proteolysis of FIX and FX, which ends in the formation of a fibrin clot.
A 263-residue integral membrane protein, human TF is composed of three domains: the cytoplasmic domain (residues 243–263), a membrane spanning helix (residues 220–242) and the extracellular domain (residues 1–219) which in turn is composed of two fibronectin type III domains (Daubie et al. 2007). The cytoplasmic domain may function in signaling, and the single transmembrane helix anchors the protein in the membrane bilayer. The isolated extracellular domain, referred to as soluble tissue factor (sTF), constitutes the bulk of the protein (~83%) and is the domain that allosterically activates FVIIa. Crystal structures are available for sTF (Muller et al. 1996), as is a 1H-15N HSQC spectrum of sTF (Stone et al. 1995), although no site-specific resonance assignments have been reported for sTF or the full-length, membrane-bound TF. Here we report the assignment of 97% of the amide resonances and 90% of the backbone resonances (including 60% of the Cβ) in sTF. These site-specific chemical shift assignments will allow for further investigations into conformational changes of sTF upon interaction with FVIIa and/or the membrane bilayer.
Methods and experiments
Recombinant protein expression and purification
2H,13C,15N-labeled human sTF protein was expressed in T7 Express E. coli cells (New England BioLabs, Inc., Ipswitch, MA) from plasmid pJH677. Detailed expression conditions will be communicated elsewhere (Boettcher et al., manuscript in preparation); briefly, a starter culture was grown at 37°C to OD600 = 6 in a modified Studier MDG medium (Studier 2005) at natural isotopic abundance. The bacteria were then harvested and resuspended in 3 volumes of fresh medium containing 2H,13C,15N-BioExpress (Cambridge Isotopes Laboratories, Inc., Andover, MA), U-13C-glycerol and phosphate. Specifically, BioExpress (10X stock solution) was diluted to 1× with 100 mM phosphate buffer at pH 7.5. U-13C-glycerol was added at 2 g/L and the culture was grown at 25 °C until the OD600 reached ~3. Expression of sTF was induced with 20 μM isopropyl β-D-1-thiogalactopyranoside for 24 h. The cells were harvested, sTF released by osmotic shock, and the cell debris pelleted. The supernatant was purified with Q-Sepharose, Ni2+ affinity and gel filtration chromatography (HiPrep 16/160 Sephacryl S-200, GE Biosciences). This resulted in>95% purity, and a yield of 70–100 mg/L sTF. All purification solutions contained 1H2O, in order to exchange backbone amides.
NMR spectroscopy
Solution NMR spectra were acquired at the School of Chemical Sciences NMR Facility (University of Illinois at Urbana-Champaign) on Varian INOVA 600 and 750 MHz spectrometers equipped with a 5 mm, triple resonance (1H-13C-15N) triaxial gradient probes, using VNMRJ version 2.1B with the BioPack suite of pulse programs. Spectra were acquired at 35°C on back-exchanged 2H, 13C, 15N-sTF samples (1 mM in a 50 mM phosphate buffer, pH 6.5, containing 50 mM NaCl and 10% D2O (v/v)). 2D 1H-15N TROSY spectra were measured for an average of two hours per spectrum, digitizing 512 points in the indirect 15N dimension (t1max = 232 ms). The standard suite of TROSY-based heteronuclear triple resonance 3D spectra (HNCO, HN(CA)CO, HNCA, HNCACB, HN(CO)CA) was utilized to establish correlations among backbone resonances of the sTF sample. Measurement times for the 3D spectra were 12–48 h. Spectra were processed with NMRPipe (Delaglio et al. 1995) and analyzed in Sparky (Goddard and Kneller).
Extent of assignments and data deposition
A standard set of triple resonance TROSY based spectra was used to complete ~90% of the HN, N, Cα, Cβ, C′ backbone assignments of sTF; this includes >95% of all the HN, N, Cα, C′ and ~60% of the Cβ. The assignments are deposited in the BMRB under accession number 16838 (for release upon publication). The 1H-15N TROSY spectrum (Fig. 1) is qualitatively consistent with previously published sTF 1H-15N HSQC spectra, which were not assigned (Stone et al. 1995). The improved sensitivity and resolution enabled us to assign 213 of the expected 218 amide resonances (excluding the 9 prolines but including the 10 residue His tag). We were not able to make unambiguous assignments of residues 77, 78 and 137, or residues 229 and 230 (within the His tag). Residues 77 and 78 precede a proline, and resumption of the backbone walk was further complicated by relatively weak signal intensities throughout this portion of the protein. Residue 137, in a flexible loop, was also missing in the 3D experiments and therefore could not be assigned.
Fig. 1.
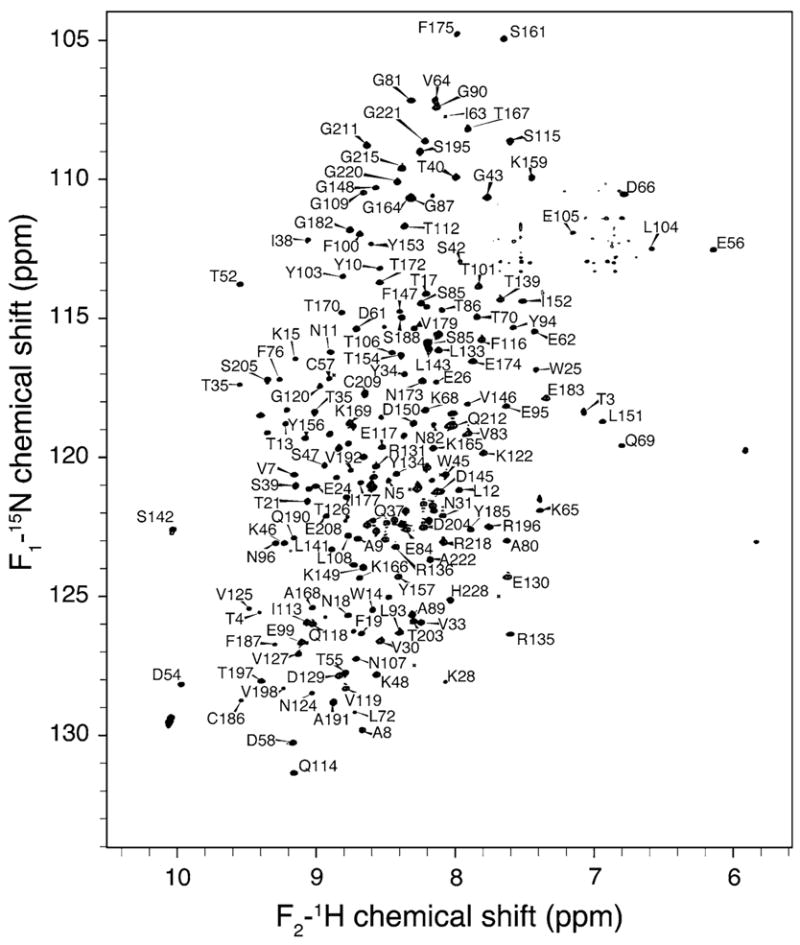
15N-1H 2D TROSY-HSQC NMR spectrum of sTF acquired at 600 MHz (1H frequency) (in phosphate buffer, 50 mM NaCl, pH 6.5, 35°C). 213 of the expected 218 resonances are assigned. The spectrum was processed with sine bell apodization and zero filled to at least double the original size in both dimensions. Subsets of the available assignments are labeled
TALOS+ (Shen et al. 2009) analysis of the secondary structure (Fig. 2) by NMR illustrates the α-helical and β-strand positions in good agreement with the crystal structure (Muller et al. 1996). We also report data for residues 87–90, 161, 162 and 212–219 that are not in the crystal structure due to the lack of electron density (Muller et al. 1996). The TALOS+ (Shen et al. 2009) analysis shows that residues 87–90 and 212–219 are in unstructured, dynamic regions, while residues 161 and 162 are both in extended conformations.
Fig. 2.

Secondary structure elements of sTF identified by TALOS+ (Shen et al. 2009). Plotted are the Phi (Φ) (black circles) and Psi (Ψ) (gray squares) backbone torsion angles as predicted by TALSO+ (Shen et al. 2009) with error bars. Along the x-axis is a cartoon representation of the secondary structure based on the crystal structure [2HFT (Muller et al. 1996)]. The results of the secondary structural analysis show the majority of sTF is β-strand with three α helices, in agreement with the crystal structure
Acknowledgments
This work was supported by NIH grants R01GM75937 (to CMR) and R01HL47014 (to JHM).
Contributor Information
John M. Boettcher, Department of Chemistry, University of Illinois at Urbana-Champaign, 600 S Mathews Ave, Box 50-6, Urbana, IL 61801, USA
Mary C. Clay, Department of Chemistry, University of Illinois at Urbana-Champaign, 600 S Mathews Ave, Box 50-6, Urbana, IL 61801, USA
Benjamin J. LaHood, Department of Biochemistry, University of Illinois at Urbana-Champaign, Urbana, IL 61801, USA
James H. Morrissey, Department of Biochemistry, University of Illinois at Urbana-Champaign, Urbana, IL 61801, USA. College of Medicine, University of Illinois at Urbana-Champaign, Urbana, IL 61801, USA
Chad M. Rienstra, Email: rienstra@scs.illinois.edu, Department of Chemistry, University of Illinois at Urbana-Champaign, 600 S Mathews Ave, Box 50-6, Urbana, IL 61801, USA. Department of Biochemistry, University of Illinois at Urbana-Champaign, Urbana, IL 61801, USA. Center for Biophysics and Computational Biology, University of Illinois at Urbana-Champaign, Urbana, IL 61801, USA
References
- Daubie V, Pochet R, Houard S, Philippart P. Tissue factor: a mini-review. J Tissue Eng Regen Med. 2007;1:161–169. doi: 10.1002/term.9. [DOI] [PubMed] [Google Scholar]
- Delaglio F, Grzesiek S, Vuister GW, Zhu G, Pfeifer J, Bax A. Nmrpipe: a multidimensional spectral processing system based on unix pipes. J Biomol NMR. 1995;6:277–293. doi: 10.1007/BF00197809. [DOI] [PubMed] [Google Scholar]
- Drake TA, Morrissey JH, Edgington TS. Selective cellular expression of tissue factor in human-tissues—implications for disorders of hemostasis and thrombosis. Am J Pathol. 1989;134:1087–1097. [PMC free article] [PubMed] [Google Scholar]
- Goddard TD, Kneller DG. Sparky 3. University of California; San Francisco: [Google Scholar]
- Morrissey JH. Tissue factor: a key molecule in hemostatic and nonhemostatic systems. Int J Hematol. 2004;79:103–108. doi: 10.1532/ijh97.03167. [DOI] [PubMed] [Google Scholar]
- Muller YA, Ultsch MH, deVos AM. The crystal structure of the extracellular domain of human tissue factor refined to 1.7 angstrom resolution. J Mol Biol. 1996;256:144–159. doi: 10.1006/jmbi.1996.0073. [DOI] [PubMed] [Google Scholar]
- Shen Y, Delaglio F, Cornilescu G, Bax A. TALOS plus: a hybrid method for predicting protein backbone torsion angles from NMR chemical shifts. J Biomol NMR. 2009;44:213–223. doi: 10.1007/s10858-009-9333-z. [DOI] [PMC free article] [PubMed] [Google Scholar]
- Stone MJ, Ruf W, Miles DJ, Edgington TS, Wright PE. Recombinant soluble human tissue factor secreted by saccharomyces-cerevisiae and refolded from Escherichia coli inclusion-bodies—glycosylation of mutants, activity and physical characterization. Biochem J. 1995;310:605–614. doi: 10.1042/bj3100605. [DOI] [PMC free article] [PubMed] [Google Scholar]
- Studier FW. Protein production by auto-induction in high density shaking cultures. Protein Expr Purif. 2005;41:207–234. doi: 10.1016/j.pep.2005.01.016. [DOI] [PubMed] [Google Scholar]