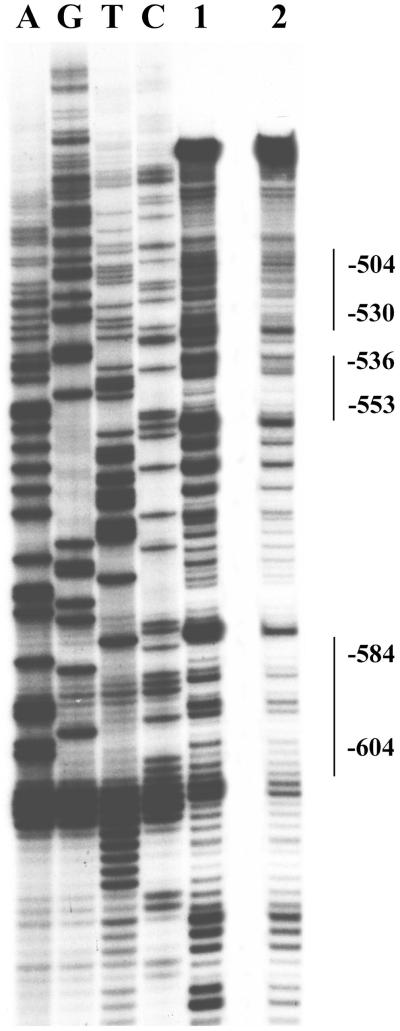
Figure 5. DNase I footprinting analysis of the TCblR gene −668 to −455 region.
The reactions were performed as described in “Experimental Procedures”. From left to right, laneA,G,T,C sequencing reactions for the top strand; lane 1, free probe; lane 2, addition of 40ug nuclear extracts from proliferating HEK293 cells; Protected regions are indicated by a vertical lines.

