Abstract
The lipid membrane is the portal to the cell and its first line of defense against the outside world. Its plasticity, diversity and powers of accommodation in a myriad of environments, mirrored by the varied make up of the cells it protects, are unparalleled. Glycerophospholipids are one of its major components. In cell membranes the extracellular layer is mainly made up of positively charged glycolipids, while the intracellular one’s main components are negatively charged. Advances in mass spectrometry have allowed the direct probing of tissues, and thus a direct approach to probing membranes make up was developed. Until recently most studies have focused on proteins. An overview of the use of matrix-assisted laser desorption/ionization time-of-flight mass spectrometry (MALDI-TOFMS) for the direct analysis of phospholipids in various tissue is presented. Molecular ions corresponding to phosphatidylcholines, sphingomyelin, phosphatidylethanolamines, Phosphatidylserines. Phosphatidylinositols and sulfatides were mapped.
INTRODUCTION
The study of lipids has been gaining in importance by leaps and bounds; the proof is that it has recently become an “OMICS”, lipidomics [1]. As proteins have overshadowed nucleotides and proteomics has gained importance over genomics; lipidomics will soon overshadow both, it is the new frontier in biological structural studies. Lipids are the main components in membranes that define the topology of the cell and its organelles. In the brain, lipids are the most common biomolecules and account for almost half of the brain dry weight [2]. Their role in signaling, has pushed the field of lipidomics forward resulting in several excellent reviews.[1–5] In addition physiologically important lipids provide energy reserves, predominantly in the form of triacylglycerols; serve as vitamins and hormones, while lipophilic bile acids aid in lipids solubilization. Fatty acids are acquired in the diet. However, the lipid biosynthetic capacity of the body can supply most of the fatty acid needed, with the exceptions of the highly unsaturated fatty acids containing unsaturation sites beyond carbons 9 and 10 such as linoleic acid and linolenic acid. Lipids also form stable noncovalent complexes with proteins as well as many drugs. Lipids are a storage depot for drugs and many organic molecules [1–5]. In addition the consequences of the integration of proteins embedded in the phospholipid bilayer are some of the most important features of biological membranes’ architecture. Phospholipid–protein interaction plays a crucial role in the behavior of such proteins in the phospholipid membrane, as when the interaction takes place, alteration of the protein structure often occurs, leading to a change in the isoelectric points (pI) of protein, thus affecting the function of the protein.
Until recently the study of cellular lipid composition and distribution was a complex and time-consuming undertaking as complex techniques had to be used to extract lipids. However, recent advances in mass spectrometry, mainly matrix-assisted laser desorption/ionization (MALDI) have made it possible to directly probe tissue to study structural components, as well as for localization of drugs [6–9]. Direct tissue imaging is a powerful tool as it gives a more complete and accurate structural picture and can trace and follow where drugs localize in tissue with minor anatomical disruption and a minimum of manipulations. Hence, we believe that in addition to its accuracy and efficiency, this new approach will lead to a better understanding of physiological processes as well as the pathophysiology of disease [9].
In the present work we use MALDI MS in positive ion mode to examine and contrast positively charged phospholipids which are mainly located in the outer cellular membranes and compare their make up in the following organs brain, liver, kidney and heart. Phosphatidylcholines in particular are zwitterionic as they have both a phosphate and a quaternary amine, which allows them to interact with aromatic compounds as well as compounds containing carboxyl, guanidinium, phosphate and sulfate groups. Phospholipids propensity for interaction explains why so many small molecules and therapeutic compounds are stored in adipose tissue, or are detected interacting with cellular membranes. [10–15]
MATERIALS AND METHODS
Mass Spectrometer
A MALDI-TOF/TOF (4700 Proteomics Analyzer, Applied Biosystems, Framingham, MA) was used in this work for both MS and MS/MS analysis in positive and negative ion mode and has been described in detail previously [16]. A Nd:YAG laser (355 nm) at a repetition rate of 200 Hz was employed for ionization. For MS analysis, mass spectra were the sum of 400 laser shots and acquired in reflectron mode. For MS/MS analysis, mass spectra were the sum of 1000 laser shots and a collision energy of 1 keV was used to induce fragmentation. The following lipid standards: brain phosphatidylcholines (99%, porcine, Avanti Polar Lipids, Alabaster, Al), sphingomyelins (99%, porcine, Avanti Polar Lipids), phosphatidylethanolamines (99%, porcine, Avanti Polar Lipids), phosphatidylserines (99%, porcine, Avanti Polar Lipids), and cerebroside sulfatides (99%, porcine, Avanti Polar Lipids) were used to calibrate the mass spectrometer.
Tissue Sectioning
All the animal work in this study abides by the Guide for the Care and Use of Laboratory Animals (NIH). Male Sprague-Dawley rats (Harlan Industries, Indianapolis, IN) between 300 and 420 g were euthanized by an intraperitoneal injection of sodium pentobarbital (> 65 mg/kg). The organs of interest (brain, liver, kidney, heart) were quickly removed and frozen in dry ice-chilled isopentane for 15 seconds, prior to storage at −80°C. The frozen tissue was cut into thin sections (12–20 µm thickness) in a cryostat (CM 3050 S; Leica Microsystems Nussloch GmbH, Nussloch, Germany) and placed onto a MALDI sample plate.
Sample Preparation
The MALDI matrix used in this study was 2,6-dihydroxyacetophenone, DHA, (Fluka, Buchs, Switzerland). Lithium chloride (Sigma-Aldrich, St. Louis, MO) was dissolved in 50% ethanol at a concentration of 100mM. Matrix solutions were prepared in 50% ethanol or 100 mM LiCl in 50% ethanol at a concentration of 30 mg/mL for DHA. For tissue analysis, 0.1 µL of matrix solution was deposited directly on the section, resulting in a matrix spot size between 800 and 1500 µm, and allowed to air-dry prior to insertion into the mass spectrometer. One note of caution is that the DHA matrix sublimes under high vacuum pressure, for the DHA concentration used in this study analysis was conducted for up to 30 minutes.
Lipid Assignment
In MALDI-TOF mass spectra, PC, PI, PS, PA, and PG species number equal the total length and number of double bonds of both acyl chains, while SM and ST species number corresponds to the length and number of double bonds of the acyl chain attached to the sphigosine base. PE species number equal the total length and number of both radyl chains with a representing 1,2 diacyl species and p representing a 1-O-(1’-alkenyl)-2-acyl (plasmalogen) species. Assignment of phosholipid species based upon product-ion spectra is as follows: PL sn-1 acyl/alkenyl group/sn-2 acyl group.
Modeling
The molecular models of PC, PE, PI, PS, and SM were created using Accelrys Discovery Studio 1.5. The geometries of the molecules were cleaned after drawing to obtain the general structural information.
RESULTS
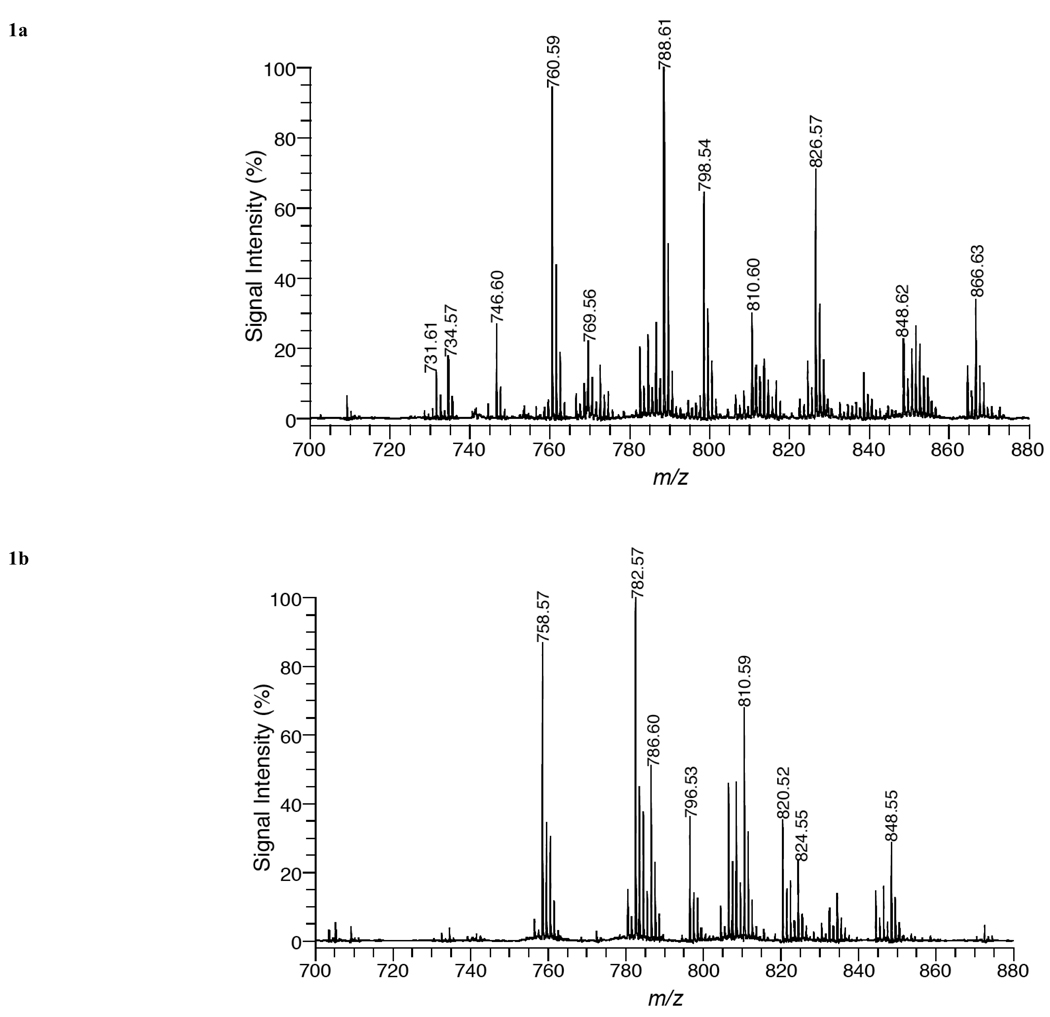
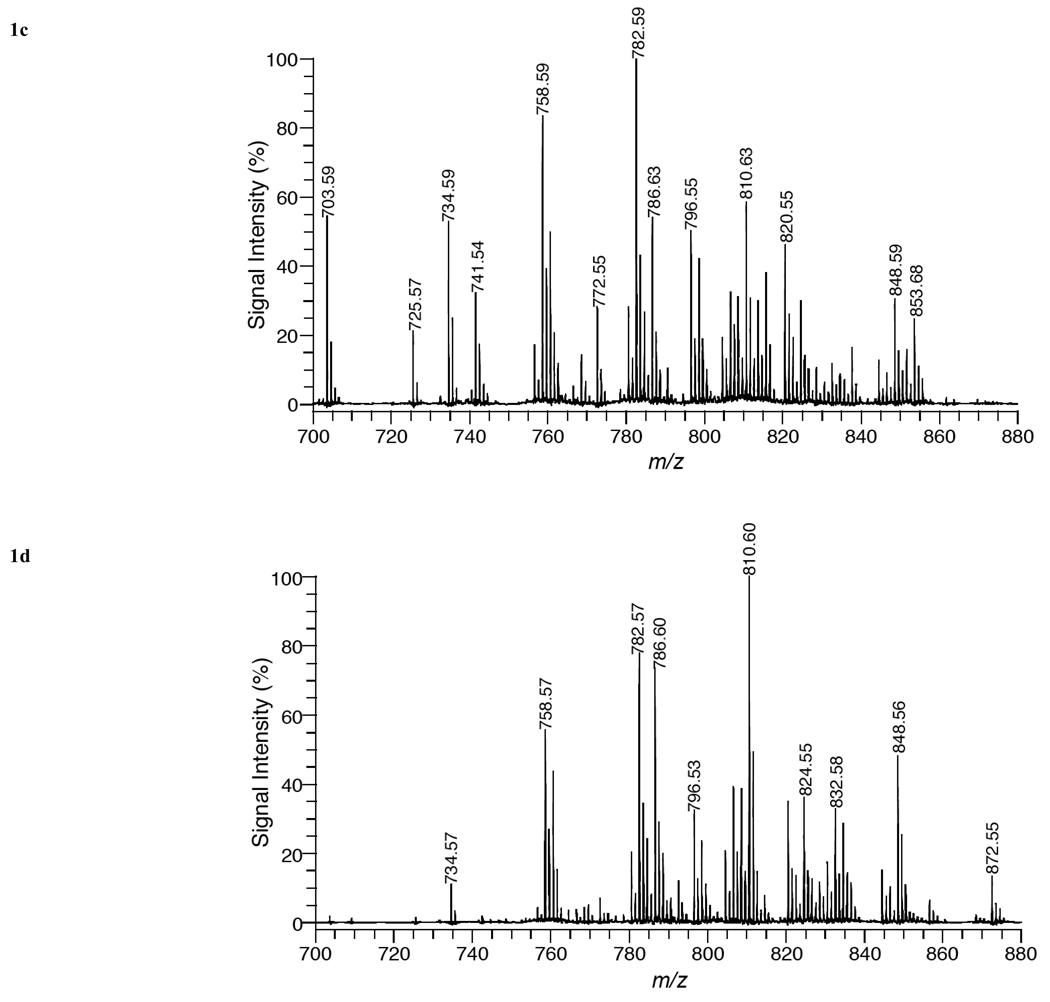
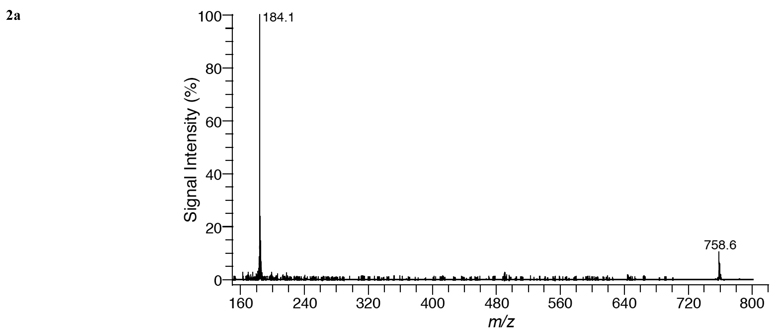
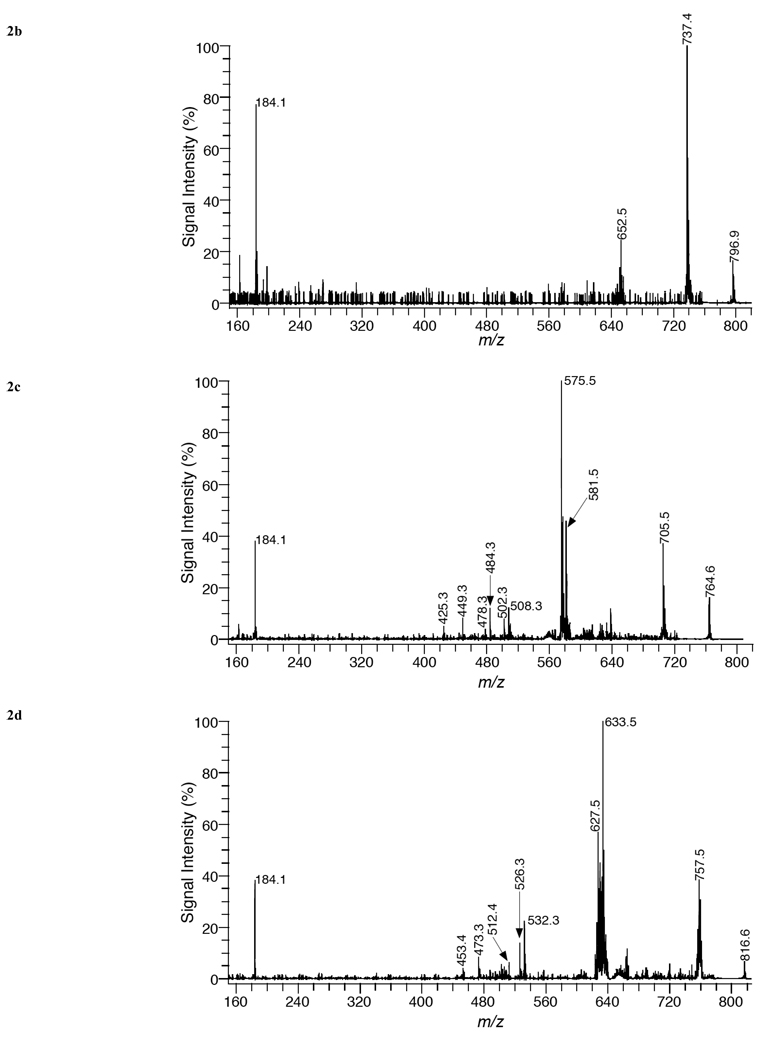
MALDI mass spectra acquired in positive ion mode (Fig. 1) illustrates the phospholipid species in tissue sections of (a) brain, (b) liver, (c) kidney, and (d) heart. Table 1 lists mass peak assignments for lipid species from mass spectra of the four organs. For each phospholipid specie assigned in Table 1, three molecular ions, [M+H]+, [M+Na]+, and [M+K]+, were observed.
Fig. (1).
MALDI mass spectra of (a) brain, (b) liver, (c) kidney, and (d) heart tissue using DHA matrix in positive-ion mode.
Table 1.
Mass Peak Assignments for Lipid Species in Positive Ion Mode
| Speciesa | [M+H]+ (Da)b | Brain | Liver | Kidney | Heart |
|---|---|---|---|---|---|
| PC 32:0 | 734.57 | 734.57 | 734.59 | 734.59 | 734.57 |
| PC 34:2 | 758.57 | --- | 758.57 | 758.59 | 758.57 |
| PC 34:1 | 760.58 | 760.59 | 760.58 | 760.61 | 760.58 |
| PC 36:4 | 782.57 | --- | 782.57 | 782.59 | 782.57 |
| PC 36:3 | 784.58 | 784.56 | 784.57 | 784.60 | 784.57 |
| PC 36:2 | 786.60 | 786.59 | 786.60 | 786.63 | 786.60 |
| PC 36:1 | 788.62 | 788.61 | --- | --- | 788.61 |
| PC 38:6 | 806.57 | --- | 806.56 | 806.58 | 806.56 |
| PC 38:5 | 808.58 | --- | 808.58 | 808.60 | 808.57 |
| PC 38:4 | 810.60 | 810.60 | 810.59 | 810.63 | 810.60 |
| PC 40:6 | 834.60 | 834.62 | 834.59 | --- | 834.59 |
| PE 36:2 | 744.55 | 744.58 | --- | --- | --- |
| PE 36:1 | 746.57 | 746.60 | --- | --- | --- |
| PE 38:5 | 766.54 | 766.55 | 766.58 | --- | 766.55 |
| PE 38:4 | 768.55 | 768.55 | --- | 768.57 | 768.55 |
| PE 40:6 | 792.55 | 792.53 | --- | --- | 792.56 |
| SM 16:0 | 703.58 | --- | --- | 703.59 | 703.57 |
| SM 18:0 | 731.61 | 731.61 | --- | --- | --- |
| SM 24:1 | 813.68 | 813.66 | --- | 813.71 | --- |
| SM 24:0 | 815.70 | --- | --- | 815.72 | --- |
PC and PE species number equal the total length and number of double bonds of both acyl chains. SM specie number corresponds to the length and number of double bonds of the acyl chain attached to the sphingosine base.
Masses are theoretical monoisotopic.
In order to confirm the assignment of phospholipid species in the various organs, MALDI-TOF/TOF analysis was conducted on the mass peaks observed in Fig. (1). Fig. (2a) shows a MALDI-TOF/TOF mass spectrum of [PC 34:2+H]+ (m/z = 758.57) in liver tissue using positive ion mode with DHA matrix. The only major fragment peak observed in this spectrum was at m/z = 184.1. This mass peak corresponds to phosphocholine (C5H15O4N), which is formed by the loss of the polar head group of PC. This result is in agreement with previous studies using MALDI-FTICR/MS (17), ESI-MS (18,19), PSD MALDI-MS [20], and MALDI-TOF/TOF MS [21]. MALDI-TOF/TOF analysis of all other protonated PC species listed in Table 1 yielded a similar fragmentation pattern, in which the only major peak was phosphocholine.
Fig. (2).
MALDI product-ion spectra of (a) PC 34:2+H mass peak, (b) PC 34:2+K mass peak, (c) PC 34:2+Li mass peak, and (d) PC 38:4+Li mass peak from liver tissue using DHA matrix in positive-ion mode.
Additional experiments were performed, in which sodiated and postassiated PC species were analyzed by MALDI-TOF/TOF. Fig. (2b) illustrates a MALDI-TOF/TOF mass spectrum of [PC 34:2+K]+ (m/z = 796.53) in liver tissue using positive ion mode with DHA matrix. Major fragment peaks in this mass spectrum were recorded at 737.4 Da and 184.1 Da. The mass peak at 737.4 Da is produced by the neutral loss of trimethylamine (N(CH3)3) from the parent ion, while the mass peak at 184.1 Da, corresponds to phosphocholine. Further analysis of potassiated and sodiated PC species produced MALDI-TOF/TOF mass spectra with similar fragment peaks with the major difference being the substitution of sodium for potassium in sodiated PC species. Previous MS/MS studies of sodiated species using ESI/MS [22], FAB-MS [23] and a PSD MALDI-MS study [20] have yielded similar fragment patterns. However, in some of these studies [20,23] additional fragment peaks corresponding to the loss of acyl groups were detected. In our work, MALDI-TOF/TOF analysis of sodiated and potassiated PC species did not produce any significant fragment peaks corresponding to the loss of acyl groups.
In order to acquire more structural information on PC species by MS/MS analysis, previous studies [18,19] have generated lithium adducts of PC species. In this current study, the matrix, DHA, was dissolved in 100 mM LiCL and deposited directly onto the tissue sections in order to produce lithium adducts. Fig. (2c) shows a MALDI-TOF/TOF mass spectrum of [PC 34:2+Li]+ (m/z = 764.6) in liver tissue using positive ion mode with DHA/LiCl matrix. Several fragment peaks providing structural information are recorded. The mass peak at m/z = 705.5 corresponds to the loss of trimethylamine, while the mass peaks at 581.5, [M + Li − N(CH3)3 − C2H5 O4P]+, and 575.5 Da, [M + H − N(CH3)3 − C2H5O4P]+, correspond to the net loss of the phosphocholine head group with and without lithium. Structural information enabling the identification of the acyl groups of the PC specie is provided by the mass peaks at 508.3, 502.3, 484.3, 478.3, 449.3, and 425.3 Da. These mass peaks are attributed to neutral losses of acyl groups and trimethylamine. These mass peaks are assigned as follows: 508.3 [M+Li−C16H32O2]+ loss of palmitic acid, 502.3 [M+H−C16H32O2]+ loss of lithium salt of palmitic acid, 484.3 [M+Li−C18H32O2]+ loss of linoleic acid, 478.3 [M+H−C18H32O2]+ loss of lithium salt of linoleic acid, 449.3 [M+Li−N(CH3)3 −C16H32O2]+ loss of trimethylamine and palmitic acid, and 425.3 Da [M+Li−N(CH3)3 −C18H32O2]+ loss of trimethylamine and linoleic acid. Based upon the fragment peaks observed in Fig. (2c), the major PC specie contributing to the mass peak assigned as [PC 34:2+Li]+ is PC 16:0/18:2. The assignment of acyl groups accordingly as sn-1or sn-2 substituents is based upon previous fragmentation studies [18,20] of PC species in which the abundance of ions corresponding to the loss of the sn-1 substituent is greater than the abundance of ions reflecting the loss of the sn-2 substituent in positive-ion mode. The fragment peaks observed for lithiated PC species in tissue by MALDI-TOF/TOF analysis are in similar agreement with ESI-MS/MS studies [18,19] of lithiated PC species.
Fig. (2d) is a MALDI-TOF/TOF mass spectrum of [PC 38:4+Li]+ (m/z = 816.6) from liver tissue, using positive ion mode with DHA/LiCl matrix. The major fragment peaks in this mass spectrum correspond to the neutral loss of trimethylamine (757.5 Da) and the phosphocholine headgroup with and without lithium (633.5 and 627.5 Da). Several additional fragment peaks were observed corresponding to the neutral loss of acyl groups and trimethylamine and were assigned as follows: 532.3 [M+Li−C18H36O2]+ loss of stearic acid, 526.3 [M+H−C18H36O2]+ loss of lithium salt of stearic acid, 473.3 [M+Li−N(CH3)3 −C18H36O2]+ loss of trimethylamine and stearic acid, 512.4 [M+Li−C20H32O2]+ loss of arachidonic acid, 453.4 [M+Li−N(CH3)3 −C20H32O2]+ loss of trimethylamine and arachidonic acid. Based upon the fragment peaks observed in Fig. (2d), the major PC specie contributing to the mass peak assigned as [PC 38:4+Li]+ is PC 18:0/20:4.
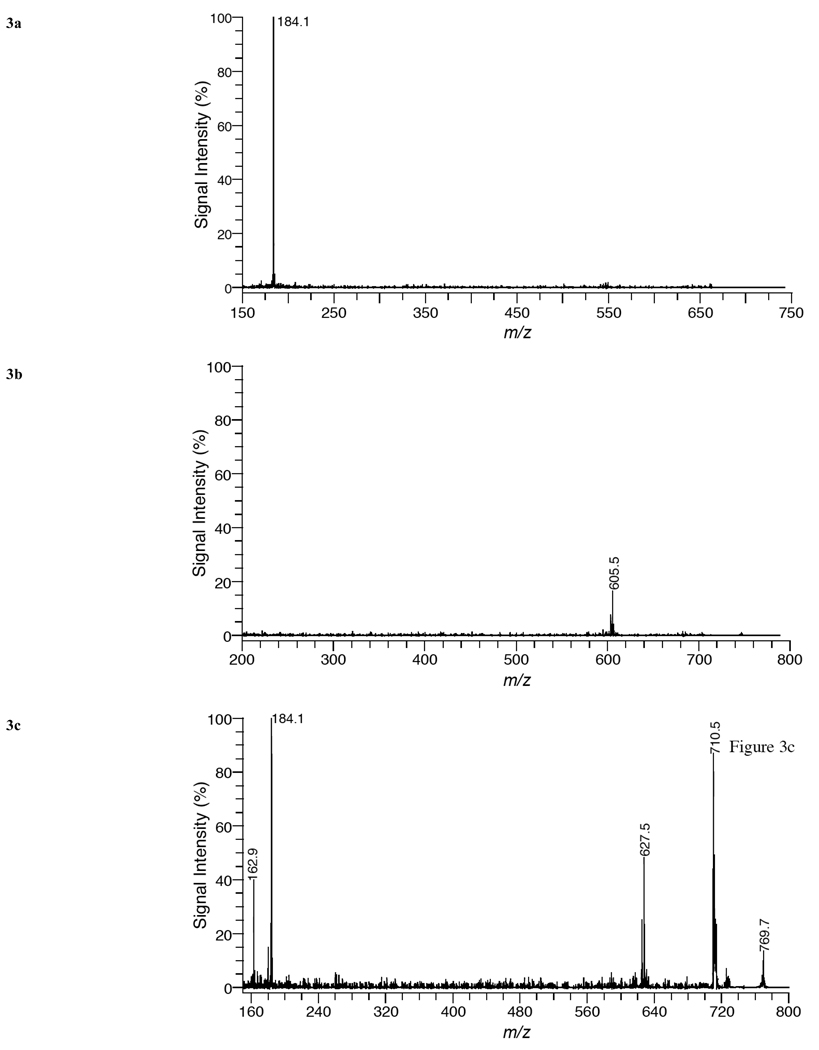
Fig. (3a) shows a product-ion spectrum of [SM 16:0+H]+ (m/z = 703.58) in kidney tissue using positive ion mode with DHA matrix. The only fragment peak observed is at m/z = 184.1 and corresponds to phosphocholine (C5H15O4N) resulting from the loss of the polar head group of SM. This result was observed for all protonated SM species in Table 1 and is the same as what was observed for protonated PC species since both PC and SM have a phosphocholine headgroup. Previous studies have shown a similar fragmentation for protonated SM species with ESI-MS [24,25].
Fig. (3).
MALDI product-ion spectra of (a) SM 16:0 [M+H]+ from kidney tissue and (b) PE 36:1 [M+H]+ and (c) SM 18:0 [M+K]+ from brain tissue using DHA matrix in positive-ion mode.
Fig. (3b) illustrates a product-ion spectrum of [PE 36:1+H]+ (m/z = 746.57) in brain tissue using positive ion mode with DHA matrix. The major fragment peak recorded is at 605.5 Da and corresponds to the neutral loss of phosphoethanolamine (141 Da). This fragment peak has been observed before for PE species in positive ion mode using ESI-MS [24,26] and MALDI-FTICR/MS [17] and has been used to distinguish PE species in complex mixtures. The loss of the phosphoethanolamine was observed for all protonated PE species assigned in Table 1.
Fig. (3c) shows a product-ion spectrum of [SM 18:0+K]+ (m/z = 769.56) in brain tissue using positive ion mode with DHA matrix. Major fragment peaks are observed at 710.5, 184.1, and 162.9 Da. The mass peak at 710.5 Da is produced by the neutral loss of trimethylamine [N(CH3)3] from the parent ion, while the mass peak at 184.1 Da corresponds to phosphocholine and the mass peak at 162.9 Da corresponds to a potassiated five-membered cyclophosphane ring (C2H5O4P + K). The fragment peak observed at m/z 627.5 corresponds to the neutral loss of the phosphoethanolamine head group (141 Da) from the parent ion [PE 38:4+H]+ (m/z = 768.55). This result demonstrates the difficulty in assigning lipid species with direct tissue analysis in which several lipid species are present and can overlap in the same mass selection range.
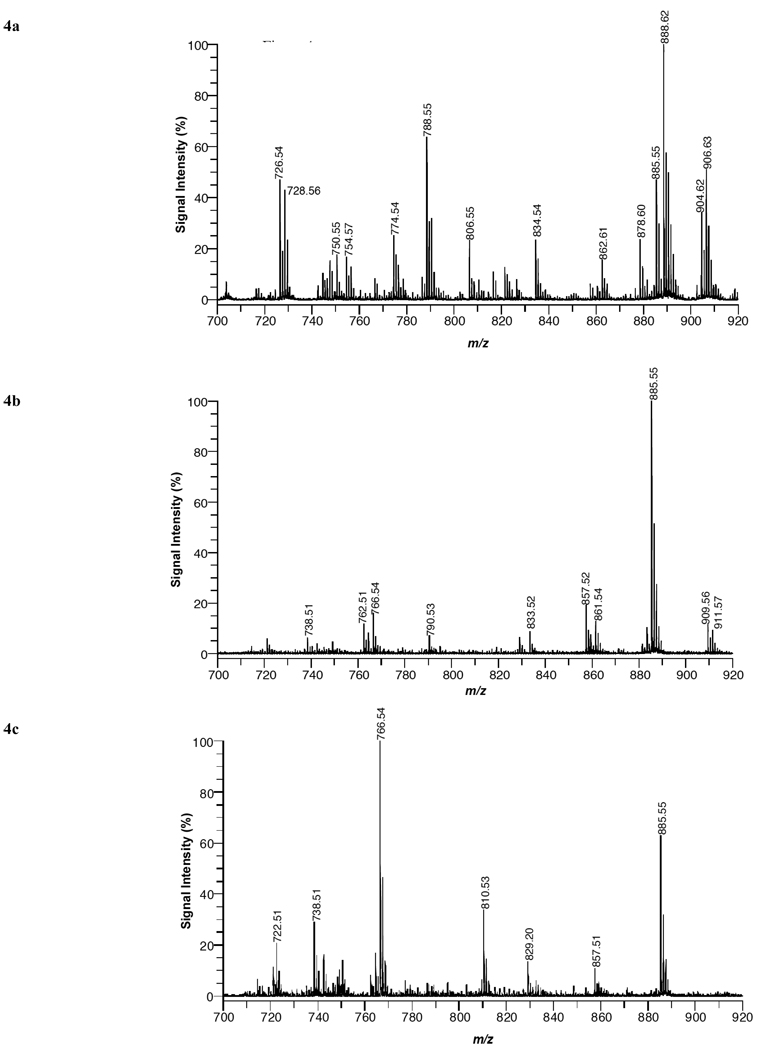
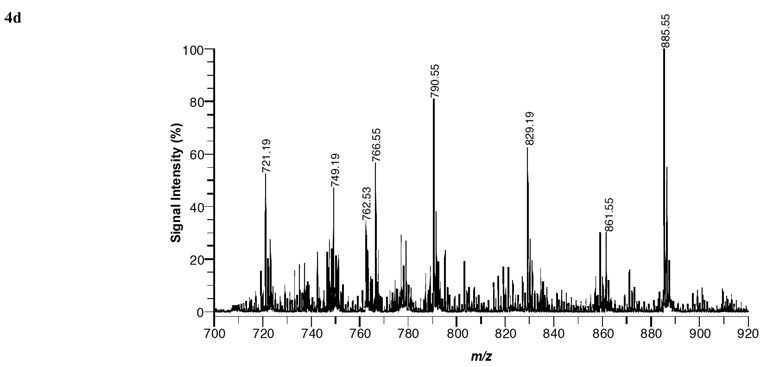
MALDI mass spectra acquired in negative ion mode (Fig. 4) illustrates the glycerolipids species in tissue sections of (a) brain, (b) liver, (c) kidney, and (d) heart. Table 2 lists mass peak assignments for lipid species from mass spectra of the four organs. In order to obtain structural information tandem MS analysis was conducted. Examples of MS/MS results in negative ion mode for a PE, PS, and PI specie are discussed below.
Fig. (4).
MALDI mass spectra of (a) brain, (b) liver, (c) kidney, and (d) heart tissue using DHA matrix in negative-ion mode.
Table 2.
Mass Peak Assignments for Lipid Species in Negative Ion Mode
| Speciesa | [M-H]− (Da)b | Brain | Liver | Kidney | Heart |
|---|---|---|---|---|---|
| PE 34:2a | 714.51 | --- | 714.50 | 714.52 | 714.55 |
| PE 34:1a | 716.52 | 716.54 | --- | 716.52 | --- |
| PE 36:4p | 722.51 | 722.52 | --- | 722.51 | --- |
| PE 36:3p | 724.53 | 724.53 | --- | --- | --- |
| PE 36:2p | 726.54 | 726.54 | --- | --- | --- |
| PE 36:1p | 728.56 | 728.56 | --- | --- | --- |
| PE 36:4a | 738.51 | --- | 738.51 | 738.51 | 738.53 |
| PE 36:3a | 740.52 | --- | 740.54 | 740.52 | 740.55 |
| PE 36:2a | 742.54 | 742.55 | 742.54 | 742.54 | 742.56 |
| PE 36:1a | 744.55 | 744.56 | --- | 744.57 | --- |
| PE 36:0a PE 38:6p |
746.57 746.51 |
746.53 | --- | 746.52 | 746.53 |
| PA 40:6 PG 34:1 PS 40:6–88 |
747.50 747.52 747.50 |
747.52 | --- | 747.52 | 747.54 |
| PE 38:5p | 748.53 | 748.52 | --- | 748.53 | 748.54 |
| PE 38:4p | 750.54 | 750.55 | --- | 750.54 | 750.55 |
| PE 38:2p | 754.58 | 754.57 | --- | --- | --- |
| PE 38:1p | 756.59 | 756.59 | --- | --- | --- |
| PE 38:6a PS 34:0 |
762.51 762.53 |
762.51 | 762.51 | 762.51 | 762.53 |
| PE 38:5a | 764.52 | 764.53 | 764.52 | 764.53 | --- |
| PE 38:4a | 766.54 | 766.54 | 766.54 | 766.54 | 766.55 |
| PE 40:6p | 774.54 | 774.54 | --- | 774.54 | 774.56 |
| PE 40:5p | 776.56 | 776.55 | --- | --- | 776.56 |
| PE 40:4p | 778.58 | 778.57 | --- | --- | --- |
| PS 36:2 | 786.53 | 786.53 | --- | 786.52 | --- |
| PS 36:1 | 788.54 | 788.55 | --- | 788.54 | --- |
| PE 40:6a | 790.54 | 790.54 | 790.53 | --- | 790.55 |
| ST 18:0 PS 38:6 |
806.55 806.50 |
806.55 | --- | --- | --- |
| PS 38:4 | 810.53 | 810.53 | --- | 810.53 | --- |
| PS 38:1 | 816.58 | 816.57 | --- | --- | --- |
| PI 34:2 | 833.52 | --- | 833.52 | --- | --- |
| PS 40:6 ST20:0 |
834.53 834.58 |
834.54 | --- | 834.52 | 834.53 |
| PI 36:4 | 857.52 | 857.52 | 857.52 | 857.51 | --- |
| PI 36:3 | 859.53 | --- | 859.53 | --- | --- |
| PI 36:2 | 861.55 | --- | 861.54 | 861.55 | 861.55 |
| ST 22:0 | 862.61 | 862.61 | --- | --- | --- |
| PI 36:1 | 863.56 | --- | 863.55 | --- | --- |
| ST 22:0 (OH) | 878.60 | 878.60 | --- | --- | --- |
| PI 38:6 | 881.52 | --- | 881.53 | 881.52 | --- |
| PI 38:5 | 883.53 | --- | 883.54 | 883.53 | --- |
| PI 38:4 | 885.55 | 885.55 | 885.55 | 885.55 | 885.55 |
| PI 38:3 | 887.56 | --- | 887.56 | --- | --- |
| ST 24:1 | 888.62 | 888.62 | --- | --- | --- |
| ST 24:0 | 890.64 | 890.64 | --- | --- | --- |
| ST 24:1 (OH) | 904.62 | 904.62 | --- | --- | --- |
| ST 24:0 (OH) | 904.63 | 906.63 | --- | --- | --- |
| PI 40:6 | 909.55 | --- | 909.56 | --- | 909.55 |
| PI 40:5 | 911.56 | --- | 911.57 | --- | --- |
| ST 26:0 | 918.67 | 918.64 | --- | --- | --- |
| ST 26:0 (OH) | 934.67 | 934.65 | --- | --- | --- |
PC and PE species number equal the total length and number of double bonds of both acyl chains. SM specie number corresponds to the length and number of double bonds of the acyl chain attached to the sphingosine base.
Masses are theoretical monoisotopic.
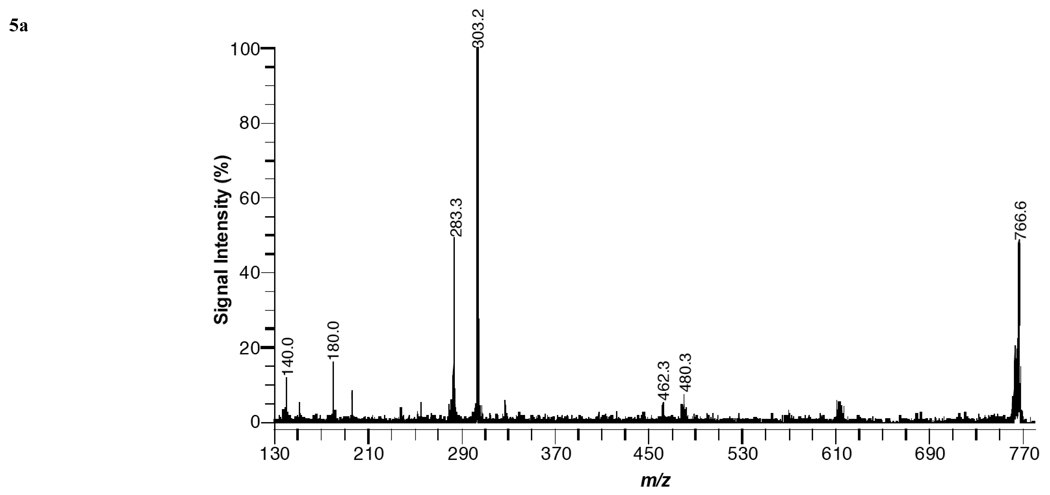
Fig. (5a) shows a product-ion spectrum of PE 38:4a –H (m/z = 766.6) from kidney tissue in negative ion mode with DHA matrix. Structural information enabling the identification and positional assignment of the acyl groups in the PE specie is provided by mass peaks at 480, 462, 303, 283, 140 Da. These mass peaks are attributed to the loss of the acyl group at sn-2 as a ketene, the loss of the acyl group at sn-2, arachidonate (20:4) anion, stearate (18:0) anion, and a fragment ion of the headgroup and are assigned as follows: 480 [M-H-R2’CH=C=O]−, 462 [M-H-R2CO2H]−, 303 [C20H31O2]−, 283 [C18H35O2]−, 140 [C2H7NPO4]−. Based upon the fragment peaks observed in Fig. (5a), the PE specie was assigned as PE 18:0a/20:4. The positional assignments of acyl groups accordingly as sn-1 or sn-2 substituent, is based upon previous fragmentation studies [27–29] of PE diacyl species, in which the R2CO2− ion is more abundant than the R1CO2− ion and the abundance of ions corresponding to the loss of the sn-2 substituent is greater than the abundance of ions reflecting the loss of the sn-1 substituent.
Fig. (5).
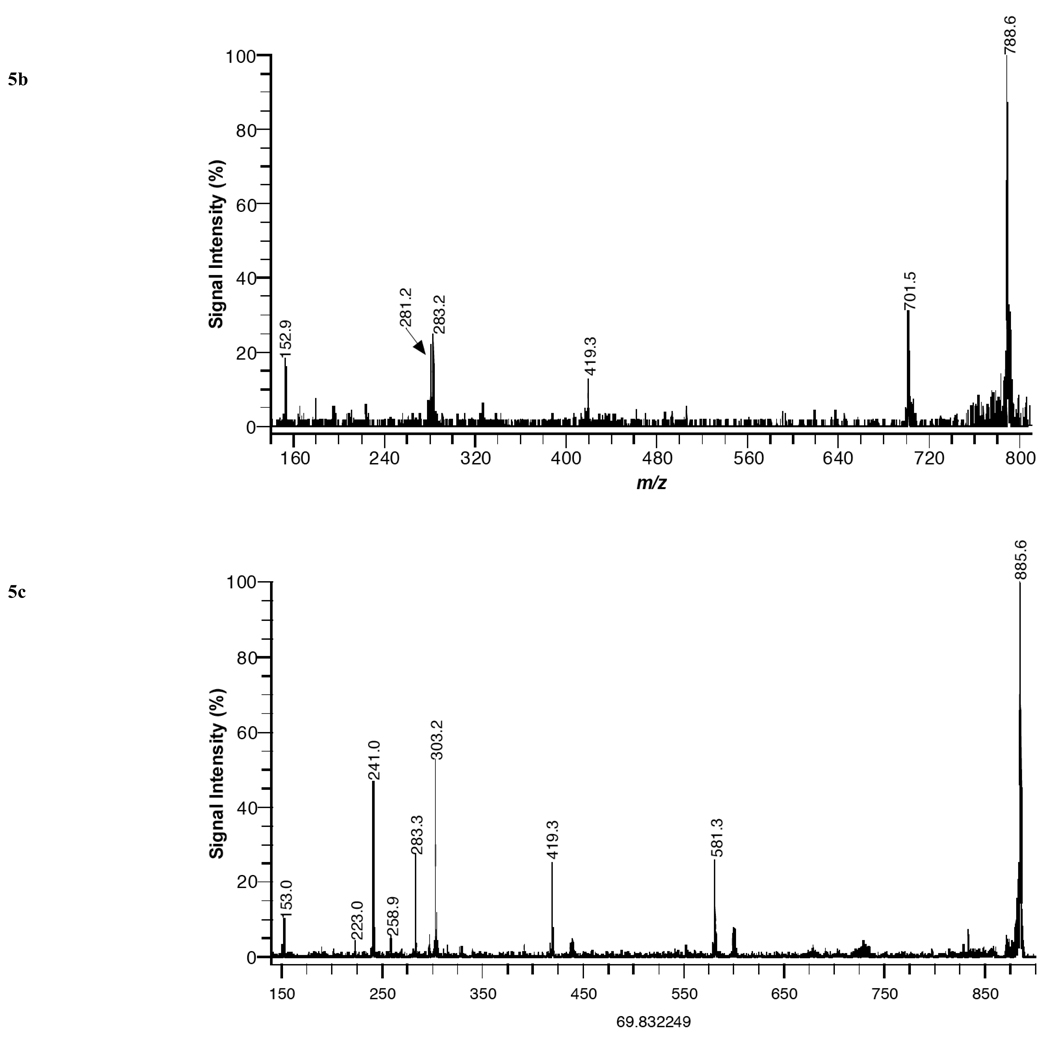
MALDI product-ion spectra of (a) PE 38:4 [M-H]− from kidney tissue, (b) PS 36:1 [M-H]− from brain tissue, and (c) PI 38:4 [M-H]− from liver tissue using DHA matrix in negative-ion mode.
Fig. (5b) illustrates a product-ion spectrum of PS 36:1–H (m/z = 788.6) from brain tissue in negative ion mode with DHA matrix. Several fragment peaks enabling the identification of the PS specie are observed at 701, 419, 283, 281, 153 Da. These mass peaks are attributed to the loss of the serine head group, the loss of the serine head group and the acyl group at sn-2, stearate (18:0) anion, oleoate (18:1) anion, and a fragment ion of the headgroup and are assigned as follows: 701 [M-H-C3H5NO2]−, 419 [M-H- C3H5NO2-R2CO2H]−, 283 [C18H35O2]−, 281 [C18H33O2]−, 153 [C3H6O5P]−. Based upon the product-ion spectrum in Fig. (5b), the PS specie was assigned as PS 18:0/18:1. Similar fragmentation patterns of PS species have been observed by FAB [31] and ESI [32]. The positional assignments of acyl groups accordingly as sn-1 or sn-2 substituent is based upon a previous fragmentation study, in which the R1CO2− ion is more abundant than the R2CO2− ion and the abundance of ions corresponding to the loss of the sn-2 substituent is greater than the abundance of ions reflecting the loss of the sn-1 substituent [32].
Fig. (5c) illustrates a product-ion spectrum of PI 38:4–H (m/z = 885.6) from liver tissue in negative ion mode using DHA matrix. Several mass peaks permitting the identification of the PI specie are observed at 581, 419, 303, 283, 259, 241, 223, and 153 Da. These mass peaks are attributed to the loss of the acyl group, the loss of the inositol head group and the fatty acid at sn-2, arachidonate (20:4) anion, stearate (18:0) anion, and several fragment ions of the headgroup and are assigned as follows: 581 [M-H-R2CO2H]−, 419 [M-H-R2CO2H-C6H10O5]−, 303 [C20H31O2]−, 283 [C18H35O2]−, 259 (inositolphosphate), 241 (inositolphosphate-H2O), 223 (inositolphosphate-2H2O), 153 [C3H6O5P]−. Based upon the product-ion spectrum in Fig. (5c), the PI specie was assigned as PI 18:0/20:4. Previous fragmentation studies using fast atom bombardment (FAB) [30], MALDI [31], and electrospray ionization (ESI)32 have yielded similar peaks for PI species. The positional assignments of acyl groups accordingly as sn-1 or sn-2 substituent is based upon a previous fragmentation study, in which the relative abundance of ions corresponding to the loss of the sn-2 substituent is greater than the relative abundance of ions reflecting the loss of the sn-1 substituent [32 and 33].
DISCUSSION
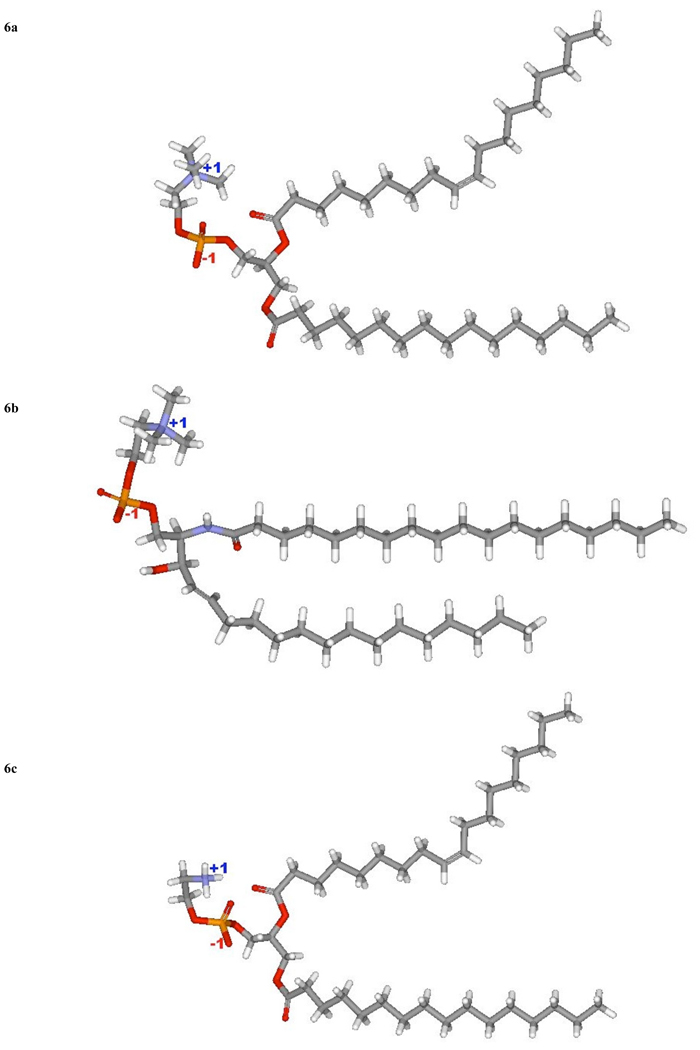
In positve ion mode, most of the species observed in the different organs are phosphatidylcholines (eleven), although five phosphatidylethanolamines and four sphyngomyelins were also seen. In brain tissue (white matter region), 14 phospholipid species were detected in Fig. (1a). The dominant specie was PC 36:1 (788.61 amu relative abundance [RA] 100%) and was only detected in brain and heart tissue. Although PC 34:1 (760.59 amu, RA 95%) was almost as abundant, while PC 32:0 (734.57 amu, RA 20%) was a minor component. The potassiated species of PC 34:1 (798.54 amu, RA 70%), PC 36:1 (826.57 amu, RA 70%) and PC 38:4 (848.62 amu, RA 20%) are also seen. SM 18:0 (731.61amu, RA 15%) and SM 24:1 (813.68 amu, RA 15%) and the potassiated SM 18:0 (769.56 amu,RA 20%) and 24:1 (851.66 amu, RA 25%) were also recorded. These results are in agreement with a previous in situ MALDI analysis of white matter regions in brain tissue [27]. Five PE species were also recorded in Fig. (1a) of these four are included in the five most abundant diacyl PE species in rat brain [2]. Despite being at similar concentrations as PC species in brain tissue, the mass peaks of PE species are relatively weak compared to the mass peaks of PC species. This is due to the presence of a quaternary amine in PC species, which aids ionization in postive ion mode. Previous MALDI-MS studies [28,29] have shown similar results in which mass spectra of mixtures containing equal amounts of PC and PE species are dominated by PC species in positive ion mode. See Fig. (4) for structures.
In liver tissue (Fig. 1b), the most abundant specie was PC 36:4 (782.57 amu, RA 100%) and the next most abundant was PC 34:2 (758.57 amu, 85%). The potassiated species of PC 36:4 (820.52 amu, RA 35%) and PC 34:2 (796.53 amu, RA 35%) were also detected. Both PC 36:4 and 34:2 were also seen in kidney and heart tissue, but not in brain tissue. PC 38:4 (810.59 amu, RA 65%) and its potassiated specie (848.55 amu, RA 30%), PC 36:2 (786.60 amu, RA 50%) and its potassiated molecular ion at 824.55 amu, RA 25% were also observed. No SM species were detected in liver tissue. (Fig. 1c) gave a similar PC distribution as liver, although the RA were often different. It also displayed a prominent peak for SM 16:0 (703.58 amu, RA 55%). Heart’s most abundant specie was PC 38:4 (810.60 amu, 100%) which is present in the other organs studied in abundances that vary between 30 to 65 % (Fig. 1d)
Performance of collision induced dissociation (CID) using MALDI-TOF/TOF mass spectrometer on several of the PC species detected have shown again that [M+H]+, [M+Na]+ or [M+K]+ (Fig. 2a and b) mass peaks do not produce fragments, that allow for the assignments of the acyl groups of the PC species. Hence in order to acquire fragment peaks that will allow for the assignment of acyl groups, the use of lithiated adducts is essential Fig. (2c and d). Furthermore, the use of MS/MS confirms the assignment of PE species, which can be isobaric with many PC species, by observing a fragment peak associated with the loss of the phosphoethanolamine head group.
In negative ion mode, looking at the variation in patterns of lipid species could help in the study of the interactions of the various organs with biomolecules and drugs. Membrane lipids are the gate through which many small molecules have to navigate to enter the cell, and the sea in which many important proteins, mainly GPR receptors float and interact with other receptors [30,31].
Fig. (6).
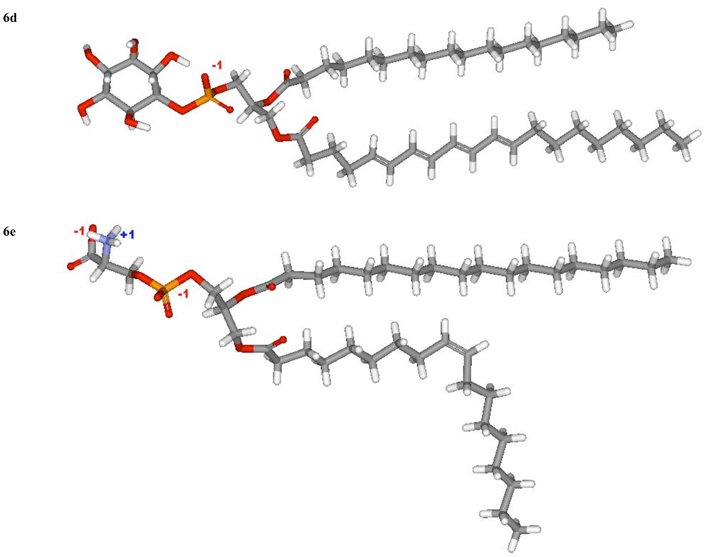
Models of (a) PC 36:1, (b) SM 18:0 and (c) PE 36:1, (d) PI 38:4, (e) PS 36:1.
ACKNOWLEDGEMENTS
This research was supported by the Intramural Research Program of the National Institute on Drug Abuse, NIH. The authors thank the Office of National Drug Control Policy (ONDCP) for instrumentation funding, without which this and other projects could not have been accomplished.
REFERENCES
- 1.Wenk MR. The emerging field of lipidomics. Nat. Rev. Drug Discov. 2005;7:594–610. doi: 10.1038/nrd1776. [DOI] [PubMed] [Google Scholar]
- 2.Piomelli D. The challenge of brain lipidomics. Prostaglandins Other Lipid Mediat. 2005;77:23–34. doi: 10.1016/j.prostaglandins.2004.09.006. [DOI] [PubMed] [Google Scholar]
- 3.Agranoff BW, Benjamins JA, Hajra AK. In: Basic Neurochemistry Molecular, Cellular and Medical Aspects. 6th ed. G. J. Siegel GJ, et al., editors. Philadelphia: Lippincott Williams & Wilkins; 1999. pp. 47–67. [Google Scholar]
- 4.Serhan CN. Mediator lipidomics. Prostaglandins Other Lipid Mediat. 2005;77:4–14. doi: 10.1016/j.prostaglandins.2004.09.016. [DOI] [PubMed] [Google Scholar]
- 5.van Meer G. Cellular lipidomics. EMBO J. 2005;24:3159–3165. doi: 10.1038/sj.emboj.7600798. [DOI] [PMC free article] [PubMed] [Google Scholar]
- 6.Caprioli RM, Farmer TB, Gile J. Molecular imaging of biological samples: localization of peptides and proteins using MALDI-TOF MS. Anal Chem. 1997;69:4751–4760. doi: 10.1021/ac970888i. [DOI] [PubMed] [Google Scholar]
- 7.Lemaire R, Tabet JC, Ducoroy P, Hendra JB, Salzet M, Fournier I. Solid ionic matrixes for direct tissue analysis and MALDI imaging. Anal Chem. 2006;78(3):809–819. doi: 10.1021/ac0514669. [DOI] [PubMed] [Google Scholar]
- 8.Wang HYJ, Jackson JN, McEuen J, Woods AS. Localization and analyses of small drug molecules in rat brain tissue sections. Anal. Chem. 2005;77:6682–6686. doi: 10.1021/ac050868d. [DOI] [PubMed] [Google Scholar]
- 9.Woods AS, Jackson SN. Brain Tissue Lipidomics: Direct Probing using MALDI MS. AAPS Journal. 2006;8:E391–E395. doi: 10.1007/BF02854910. [DOI] [PMC free article] [PubMed] [Google Scholar]
- 10.Niemela P, Hyvonen MT, Vattulainen I. Structure and dynamics of sphingomyelin bilayer: insight gained through systematic comparison to phosphatidylcholine. Biophys J. 2004;87:2976–2989. doi: 10.1529/biophysj.104.048702. [DOI] [PMC free article] [PubMed] [Google Scholar]
- 11.Tipping E, Ketterer B, Christodoulides L. Interactions of Small Molecules with Phospholipid Bilayers. Biochem. J. 1979;180:319–326. doi: 10.1042/bj1800319. [DOI] [PMC free article] [PubMed] [Google Scholar]
- 12.Barbato F, La Rotonda MI, Quaglia F. Interactions of nonsteroidal antiinflammatory drugs with phospholipids: Comparison between octanol/buffer partition coefficients and chromatographic indexes on immobilized artificial membranes. J Pharmaceut Sci. 1997;86:225–229. doi: 10.1021/js960233h. [DOI] [PubMed] [Google Scholar]
- 13.Van Bambek F, Kershofs A, Schank A, Remacle C, Sonveaux E, Tulkens PM, et al. Biophysical studies and intracellular destabilization of pH-sensitive liposomes. Lipids. 2000;35:213–223. doi: 10.1007/BF02664772. [DOI] [PubMed] [Google Scholar]
- 14.Van Bambek F, Montenez JP, Piret JPM, Tulkens PM, Mingeot-Leclercq MP. Interaction of the macrolide azithromycin with phospholipids. I. Inhibition of phospholipase A1 activity. Eur J Pharmacol. 1996;314:203–214. doi: 10.1016/s0014-2999(96)00552-3. [DOI] [PubMed] [Google Scholar]
- 15.Woods AS. The Mighty Arginine, the Stable Quaternary Amines, the Powerful Aromatics and the Aggressive Phosphate: Their Role in the Noncovalent Minuet. J. of Proteome Research. 2004;3:478–484. doi: 10.1021/pr034091l. [DOI] [PubMed] [Google Scholar]
- 16.Yergey AL, Coorssen JR, Backlund PS, Jr, Blank PS, Humphrey GA, Zimmerberg J, Campbell JM, Vestal ML. De novo sequencing of peptides using MALDI/TOF-TOF. J Am. Soc. Mass Spectrom. 2002;13:784–791. doi: 10.1016/S1044-0305(02)00393-8. [DOI] [PubMed] [Google Scholar]
- 17.Marto JA, White FM, Seldomridge S, Marshall AG. Structural characterization of phospholipids by matrix-assisted laser desorption/ionization fourier transform ion cyclotron resonance mass spectrometry. Anal. Chem. 1995;67:3979–3984. doi: 10.1021/ac00117a025. [DOI] [PubMed] [Google Scholar]
- 18.Hsu F-F, Bohrer A, Turk J. Formation of lithiated adducts of glycerophosphocholine lipids facilitates their identification by electrospray ionization tandem mass spectrometry. J. Am. Soc. Mass Spectrom. 9:516–526. doi: 10.1016/S1044-0305(98)00012-9. (19980. [DOI] [PubMed] [Google Scholar]
- 19.Hsu F-F, Turk J. Electrospray ionization/tandem quadrupole mass spectrometric studies on phosphatidylcholines : the fragmentation processes. J. Am. Soc. Mass Spectrom. 2003;14:352–363. doi: 10.1016/S1044-0305(03)00064-3. [DOI] [PubMed] [Google Scholar]
- 20.Al-Saad KA, Siems WF, Hill HH, Zabrouskov V, Knowles NR. Structural analysis of phosphatidylcholines by post-source decay matrix-assisted laser desorption/ionization time-of-flight mass spectrometry. J Am. Soc. Mass Spectrom. 2003;14:373–382. doi: 10.1016/S1044-0305(03)00068-0. [DOI] [PubMed] [Google Scholar]
- 21.Jackson SN, Wang H-YJ, Woods AS. In Situ Structural Characterization of Phosphatidylcholines in Brain Tissue Using MALDI-MS/MS. J. Am. Soc. Mass Spectrom. 2006;16:2052–2056. doi: 10.1016/j.jasms.2005.08.014. [DOI] [PubMed] [Google Scholar]
- 22.Han X, Gross RW. Structural determination of picomole amounts of phospholipids via electrospray ionization tandem mass spectrometry. J. Am. Soc. Mass Spectrom. 1995;6:1202–1210. doi: 10.1016/1044-0305(95)00568-4. [DOI] [PubMed] [Google Scholar]
- 23.Domingues P, Domingues MRM, Amado FML, Ferrer-Correia AJ. Characterization of sodiated glycerol phosphatidylcholine phospholipdis by mass spectrometry. Rapid Commun. Mass Spectrom. 2001;15:799–804. doi: 10.1002/rcm.300. [DOI] [PubMed] [Google Scholar]
- 24.Kerwin JL, Tuininga AR, Ericsson LH. Identification of molecular species of glycerophospholipids and sphingomyelin using electrospray mass spectrometry. J. Lipid Res. 1994;35:1102–1114. [PubMed] [Google Scholar]
- 25.Hsu F-F, Turk J. Structural determination of sphingomyelin by tandem mass spectrometry with electrospray ionization. J. Am. Soc. Mass Spectrom. 2000;11:437–449. doi: 10.1016/S1044-0305(99)00150-6. [DOI] [PubMed] [Google Scholar]
- 26.Berry KAZ, Murphy RC. Electrospray ionization tandem mass spectrometry of glycerophosphoethanolamine plasmalogen phospholipids. J. Am. Soc. Mass Spectrom. 2004;15:1499–1508. doi: 10.1016/j.jasms.2004.07.009. [DOI] [PubMed] [Google Scholar]
- 27.Jackson SN, Wang H-YJ, Woods AS. Direct profiling of lipid distribution in brain tisuue using MALDI-TOFMS. Anal Chem. 2005;77:4523–4527. doi: 10.1021/ac050276v. [DOI] [PubMed] [Google Scholar]
- 28.Estrada R, Yappert MC. Alternative approaches for the detection of various phospholipid classes by matrix-assisted Laser desorption/Ionization Time-of-Flight Mass spectrometry. J. Mass Spectrom. 2004;39:412–422. doi: 10.1002/jms.603. [DOI] [PubMed] [Google Scholar]
- 29.Petkovic M, Schiller J, Muller M, Benard S, Reichl S, Arnold K, Arnhold J. Detection of Individual Phospholipids in Lipid Mixtures by Matrix-Assisted Laser Desorption/Ionization Time-of-Flight Mass Spectrometry: Phosphatidylcholine Prevents the Detection of Further Species. Anal. Biochem. 2001;289:202–216. doi: 10.1006/abio.2000.4926. [DOI] [PubMed] [Google Scholar]
- 30.Jensen NJ, Tomer KB, Gross ML. FAB MS/MS for phosphatidylinositol, -glycerol, -ethanolamine and other complex phospholipids. Lipids. 1987;22:480–489. doi: 10.1007/BF02540363. [DOI] [PubMed] [Google Scholar]
- 31.Marto JA, White FM, Seldomridge S, Marshall AG. Structural characterization of phospholipids by matrix-assisted laser desorption/ionization fourier transform ion cyclotron resonance mass spectrometry. Anal Chem. 1995;67:3979–3984. doi: 10.1021/ac00117a025. [DOI] [PubMed] [Google Scholar]
- 32.Hsu F-F, Turk J. Characterization of phosphatidylinositol, phosphatidylinositol-4-phosphate, and phosphatidylinositol-4,5-bisphosphate by electrospray ionization tandem mass spectrometry: A mechanistic study. J Am Soc Mass Spectrom. 2000;11:986–999. doi: 10.1016/S1044-0305(00)00172-0. [DOI] [PubMed] [Google Scholar]
- 33.Jackson SN, Wang HYJ, Woods AS. In Situ Structural Characterization of Acidic Glycerophospholipids and Sulfatides in Brain Tissue Using MALDI-MS/MS. JASMS. 2007;18:17–26. doi: 10.1016/j.jasms.2006.08.015. [DOI] [PubMed] [Google Scholar]


